Indeed, but to follow that argument to conclusion would suggest the analysis tool should just print out the sample values of the IR and not even bother showing a graph. The information content is the same, after all. However, data visualisation can make a big difference to the ability of users to identify important features in the data being analysed, there is merit in having a variety of views to highlight features relevant to a particular area of interest, and TFR's are just one of those views. They have their place, and the various alternative TFR's have advantages and disadvantages - few would be comfortable with the significant cross terms in WVDs et al, or appreciate that they are artefacts rather than signal content, so I don't think discussion of the merits of various TFR's is pointless, if that was the implication - particularly in a thread about a particular TFR....NONE of them can show anything that cannot be seen in any other view.
Hmm, any use in pinpointing frequency source map due to non-piston operation of diaphragm?Some years ago (more than ten) I took a 40 hour course at the University of Michigan in time-frequency analysis. (UM is a world leading in this technology - they have a lab which specializes in signal processing and were the key developers of synthetic aperature radar - SAR. Being dominately top secret DOD work this is not widely known.) I came away from that course with one very important realization.
These techniques are mostly aimed at "blind" signal processing such as geophysical and other situations where one cannot do a controlled input-output experiment. In audio we always have the ability to control the input signal which has a huge advantage over the "blind" situation. When one has this controlled IO ability then quite simply put the impulse response of the system tells us all that we need to know and indeed all that can be know about the system. If it's not linear then we need multi-dimensional impulse responses, ala Wiener Series and the like, but for a linear system - and all decent audio systems are very very nearly purely linear - the impulse response is all that we need to know. The rest is simplyt different ways of viewing this fundamental parameter of a system and NONE of them can show anything that cannot be seen in any other view. Spectral, temporal, wavelet, ST, all are equivalent if done correctly. Any claimed differences are just verbiage.
Indeed, but to follow that argument to conclusion would suggest the analysis tool should just print out the sample values of the IR and not even bother showing a graph. The information content is the same, after all. However, data visualisation can make a big difference to the ability of users to identify important features in the data being analysed, there is merit in having a variety of views to highlight features relevant to a particular area of interest, and TFR's are just one of those views. They have their place, and the various alternative TFR's have advantages and disadvantages - few would be comfortable with the significant cross terms in WVDs et al, or appreciate that they are artefacts rather than signal content, so I don't think discussion of the merits of various TFR's is pointless, if that was the implication - particularly in a thread about a particular TFR.
Agreed, but I hear people here imply, if not state, that one is "right" and another "wrong". This is more than visualization.
Hmm, any use in pinpointing frequency source map due to non-piston operation of diaphragm?
Ah! That's a spatial problem and very different from what is being discussed here. You will be interested in a forth coming paper of mine on "Modal Radiation", which can do precisely what you are asking about. Or, you can read up on Nearfield Acoustic Holography, which is a close relative, except that my approach does not use nearfield data.
Agreed, but I hear people here imply, if not state, that one is "right" and another "wrong". This is more than visualization.
This has been an interesting thread at times, but this point that Earl makes has been troubling me for quite some time. There seem to be two discussions going on without any clarity about where they overlap and where they are distinct.
For linear systems all you need is the impulse response in order to characterize the system. I think that is quite well established (although I sense some on this thread want to refute it).
On the other hand, it's not easy for most of us to look at an impulse response and zero in on what it is about a system that needs to be tweaked. If it has a single resonance, that's pretty straightforward, but most impulse responses reflect contributions from many deviations from ideal behavior and it's much more convenient to use other views of the response (frequency response, wavelet, CSD, whatever...) to identify where things are working well and where they're falling short. This is a visualization issue, not a "does the impulse response capture everything?" issue.
My understanding (and I'm ready to be corrected) is that the impulse does capture everything but it doesn't always make it maximally easy to identify which aspects of the system could use some improvement. Other representations, or transformations, of the impulse response can be quite handy in those situations, as long as they're analyzed appropriately. Perhaps a bit more attention to which issue is being addressed---the completeness of the impulse response vs. the convenience of various visualization approaches---would help us make progress more quickly. Just a suggestion...
Few
Well, the impulse captures everything, but the various data processing method reveal to different degree what might be causing it through time and frequency decomposition.
Its always the same points that are brought forward against wavelet analysis - pretty boring, I'd say - and not even worth to answer again and again.
*If* you guys are happy to look at IR plots and are able to draw all your information out of that poor plots - fine ...
LOL !
There were times when you were more pin point and less vague and "walking on eggshells"
Michael
*If* you guys are happy to look at IR plots and are able to draw all your information out of that poor plots - fine ...
... and all decent audio systems are very very nearly purely linear - the impulse response is all that we need to know.
...
LOL !
There were times when you were more pin point and less vague and "walking on eggshells"
Michael
Last edited:
For linear systems all you need is the impulse response in order to characterize the system. I think that is quite well established (although I sense some on this thread want to refute it).
I'd say IR was not that much under question.
Look here:
This IMO is not the case for „impulse response“ concept.
Exciting any speaker with a Dirac stimulus and engrave its amplitude in wax – still valid !
Its the validity of FR plots that is under question.
The validity in practical terms not in math terms (as I've been corrected)
This thread and the horn honk thread lead directly to CMP concept.
In FR plots with systems of minor CMP behaviour mixed in you never ever will have any chance to identify whats correctable non-CMP behaviour and what non-correctable CMP behaviour of that system. There you only see a loooot of peaks and dips but are not able to distinguish which ones are caused by discontinuity along time line
In time frequency plots CMP becomes obvious as seen in my old pretty pix of decay in steps:


To show not only "wax" own my measurements in this respect 😉 , just have a look here too and make up your own mind:
Enable Tests
Wavelet analysis would certainly be even more pin point
🙂
Michael
Last edited:
"The requested document is not available!"
The FR plots provide very useful information for speaker system design, without which there is no other valid way of going through a design process. This is something that CMP cannot even get into if it is ever proven to exist. We have yet to see that minimum phase data can be extracted from any section of an impulse or any kind of data set. Once you can show that is possible, then the CMP theory might stand a chance.I'd say IR was not that much under question.
Look here:
Its the validity of FR plots that is under question.
The validity in practical terms not in math terms (as I've been corrected)
This thread and the horn honk thread lead directly to CMP concept.
In FR plots with systems of minor CMP behaviour mixed in you never ever will have any chance to identify whats correctable non-CMP behaviour and what non-correctable CMP behaviour of that system. There you only see a loooot of peaks and dips but are not able to distinguish which ones are caused by discontinuity along time line
In time frequency plots CMP becomes obvious as seen in my old pretty pix of decay in steps:
To show not only "wax" own my measurements in this respect 😉 , just have a look here too and make up your own mind:
Enable Tests
Wavelet analysis would certainly be even more pin point
🙂
Michael
I'm almost temped to get back into this thread. Fortunately I have the will power not to, except for the brief relapse. I am glad to see some signs of sanity, thank you Earl and JohnPM. To paraphrase Bill Clinton, "It's the impulse response, st&*^d!" Everything else is just visualization. And the entire CMP argument is nothing but a shell game. Every example presented that is supposed to reveal problems is designed to do just that. Every example that proposed to show problems with OB systems simply shows situations which are not realistic or that represent poor design practices. If the system is MP then it behaves identically to any other system with is MP and has the same IR or FR. To continue to ignore that reality boarders on sociopathic behavior.
"The requested document is not available!"
That is because the stupid censorship engine of the forum.
Replace the first star with b and the second with s
Yes the problem lies there in "across all time averaging" of S transform. If instead I plot the wavelet amplitudes the same, I can directly see how impulse response behaves at every frequency in the same dynamic range plot. This makes reflections, diffractions and resonances more clearly visible. This gives valuable information for me.
- Elias
- Elias
The average of the ST across all time at any chosen frequency will have the same value as the FT of the time series at that frequency
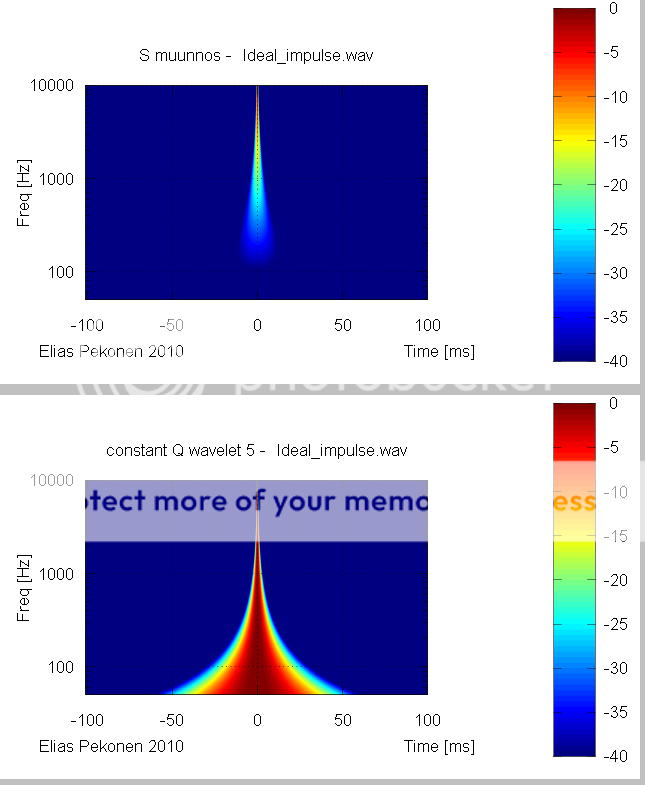
To more emphasize the difference between S-transform and wavelets in ability to visualise impulse response consider this plot. S-transform versus constant Q wavelet. I already said S transform is not matched with impulse visualisation but some people are having hard time to accept that.
The S transform plot runs quickly out of dynamic range. No wonder Brueggeman is using 200dB range in his S transform plots! Very useful to observe the small details lol 😀
From this two there is no doubt which I find more useful from visualisation point of view.
- Elias
The S transform plot runs quickly out of dynamic range. No wonder Brueggeman is using 200dB range in his S transform plots! Very useful to observe the small details lol 😀
From this two there is no doubt which I find more useful from visualisation point of view.
- Elias
That wavelet plot omits the wavelet's scale factor normalisation, there is no logic and even less common sense in comparing one plot with energy normalisation and one without. Either put the normalisation into the wavelet plot (in which case it will unsurprisingly begin to look very like the ST plot) or remove it from the S Transform plot (which will then look very like the wavelet plot).To more emphasize the difference between S-transform and wavelets in ability to visualise impulse response consider this plot. S-transform versus constant Q wavelet.
Elias, what does the wavelet of ideal impulse using bark band look like?To more emphasize the difference between S-transform and wavelets in ability to visualise impulse response consider this plot. S-transform versus constant Q wavelet. I already said S transform is not matched with impulse visualisation but some people are having hard time to accept that.
The S transform plot runs quickly out of dynamic range. No wonder Brueggeman is using 200dB range in his S transform plots! Very useful to observe the small details lol 😀
From this two there is no doubt which I find more useful from visualisation point of view.
- Elias
Hi,
See post 248.
- Elias
See post 248.
- Elias
Elias, what does the wavelet of ideal impulse using bark band look like?
- Status
- Not open for further replies.
- Home
- Loudspeakers
- Multi-Way
- WTF!? Wavelet TransForm for audio measurements - What-is? and How-to?