...but this one is right on the money...
How has any of this led to a better sounding loudspeaker?
As a wise man once said 😉 :
„Please do not confuse us with practical matters!“
I am watching form the sidelines and the amount of jibberish being spouted here is amazing (John and John being the exception).
Thanks for joining the show !
Right to the point and in best form as I can see...
🙂
But besides that – could it be that you are acting a little – just a very little – bit emotionally ?
Let me ask you :
you stated several times that the concept of Min-Phase does not apply to speakers (in your opinion!)
Now that *I* say something in this direction and presented a pin point concept – you find all being stated just „jibberish“ ???
Well, the mic is yours, Earl, please elaborate...
😀
Michael, It sounds like you are trying to theorize something, ....
Sure – didn't I say its about CMP *concept* ?
For example, based on what you have explained, it would seem like a system with a CSD that looked like a brick wall would be a non-CMP system, a system with a CSD that has a gradual decay is a CMP system.
Even if *only* so – wouldn't it be enough to have an explanation that clearly explains such effects?
As far as I remember there was no one that had a good explanation when I posted CSD plots that show pretty strange behaviour some time back – with CMP concept I think I've got some answers :
An externally hosted image should be here but it was not working when we last tested it.
An externally hosted image should be here but it was not working when we last tested it.
An externally hosted image should be here but it was not working when we last tested it.
An externally hosted image should be here but it was not working when we last tested it.
An externally hosted image should be here but it was not working when we last tested it.
An externally hosted image should be here but it was not working when we last tested it.
An externally hosted image should be here but it was not working when we last tested it.
An externally hosted image should be here but it was not working when we last tested it.
An externally hosted image should be here but it was not working when we last tested it.
The point is :
With non-CMP systems there is no probelm to EQ for flat and getting subsequent „decay like a stone“
So – looking at CSD actually is a pretty useless exercise unless there is more to see than what shows up in „FR“
With CMP systems time-frequency analysis is a different story I'd say.
Michael
Last edited:
Hi Michael,
Maybe can repeat the simulation but first set the low pass corner freq below 20Hz (the green curve below) to equalise the dipole in the pass band.
- Elias
In the pipe
Hi,
I'm glad to hear someone finds the value of looking the data in terms of psychoacoustics 🙂
Actually I'm looking forward to get this (or these) wavelets integrated into the Diyaudio wavelet package. Propably I'll write a function that can be added easily.
- Elias
Yippiiiiiiiiie !!
Let me ask you :
you stated several times that the concept of Min-Phase does not apply to speakers (in your opinion!)
Now that *I* say something in this direction and presented a pin point concept – you find all being stated just „jibberish“ ???
Well, the mic is yours, Earl, please elaborate...
😀
Michael
Normally I wouldn't comment on your discussions for the obvious reasons, but you are mistating something and that needs to be cleared up.
I never said "that the concept of Min-Phase does not apply to speakers". It does apply to a single point in space as long as the input to that transfer function is in the electrical domain. It does NOT apply spatially in the acoustic domain - namely correcting one point in space, MP or not, DOES NOT correct other points in space. So two spatial points need not be MP WRT each other even though both of those points are MP WRT an electrical input. Acoustics is simply NOT a SISO problem.
As far as I can tell the concept of CMP is ill-defined as both Johns have attempted to point out. What part of it is correct is already well know and the unknown parts don't seem to be valid.
....
I never said "that the concept of Min-Phase does not apply to speakers".
....
Thanks so much for your speech, Earl.
.....
It's the diffraction that is almost always present in a dipole that is non-minimum phase.
.....
....
Normally I wouldn't comment on your discussions for the obvious reasons,
...
🙂
Michael
Last edited:
...
What part of it is correct is already well know and the unknown parts don't seem to be valid...
I'm with you - partly - so to say,
its never about if "its well known" its all about if " its well put" ..
I mean - whats actually *unknown* in audio ?
😀
Michael
Last edited:
And what had you concluded was really causing the problem that cannot be explained just looking at the CSD?...
Even if *only* so – wouldn't it be enough to have an explanation that clearly explains such effects?
As far as I remember there was no one that had a good explanation when I posted CSD plots that show pretty strange behaviour some time back – with CMP concept I think I've got some answers :
The point is :
With non-CMP systems there is no probelm to EQ for flat and getting subsequent „decay like a stone“
So – looking at CSD actually is a pretty useless exercise unless there is more to see than what shows up in „FR“
With CMP systems time-frequency analysis is a different story I'd say.
Michael
I am willing to go over those measurement data, if you can answer all my specific questions concerning those measurements and will post further data on corrective action to verify whether I have made a correct judgement.
Are you game?
Last edited:
Are you game?
I'm sorry.
Its not that "I have the wisdom" - what I do is to try to develop understanding - *my* understanding of things actually.
I share how far I've come - and even thats only "work in progress" - thats all - the "hard work" you have to do yourself.
Michael
We all appreciate others sharing what they have found, but certainly DIY is not about philosophy where lots' of people tend to express the same concept in different ways to as to confuse the poor listeners to the point that they get hypnotized into accepting the expression.I'm sorry.
Its not that "I have the wisdom" - what I do is to try to develop understanding - *my* understanding of things actually.
I share how far I've come - and even thats only "work in progress" - thats all - the "hard work" you have to do yourself.
Michael
What I would recommend is to provide example how you have solved specific problems using this point of view, or how certain CMP criteria relates with better sound reproduction.
Otherwise, please spare us from the hypothetical views unless it really helps the wavelett discussions.
Hello,
Some observations can be made regarding the critical bandwidth:
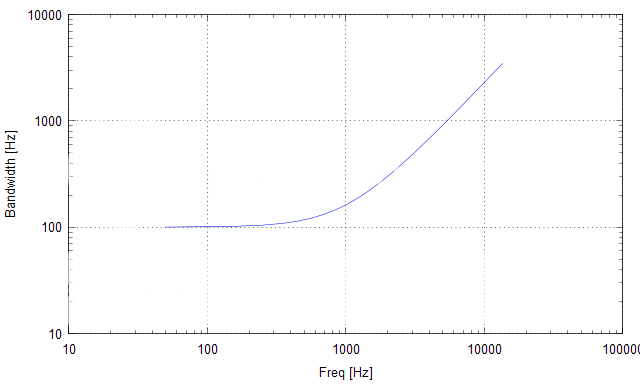
Critical bandwidth have importance in defining how ear process broad band sounds (like music). All the frequencies within certain band are processed as one at the low level of abstraction. This has implications to analysing what is important in the 'frequency response' for example. Even if the response is having ripples the perceived sound can be the same as with a perfectly smooth response if the total intensity is the same within the critical bandwidth. This can help to understand what ripples are important and what are not from the perception point of view! Some ripples can be there and some cannot.
If one only looks from the pure engineering point and drives towards physical perfection (what ever that is) one can make counterproductive trade offs (because perfection is not possible) rather than first understanding the ranking of importances.
I'm trying to hit exactly to this point with Bark wavelet. To tell me what are the best trade offs one should make in designing the better loudspeaker.
- Elias
Some observations can be made regarding the critical bandwidth:
Critical bandwidth have importance in defining how ear process broad band sounds (like music). All the frequencies within certain band are processed as one at the low level of abstraction. This has implications to analysing what is important in the 'frequency response' for example. Even if the response is having ripples the perceived sound can be the same as with a perfectly smooth response if the total intensity is the same within the critical bandwidth. This can help to understand what ripples are important and what are not from the perception point of view! Some ripples can be there and some cannot.
If one only looks from the pure engineering point and drives towards physical perfection (what ever that is) one can make counterproductive trade offs (because perfection is not possible) rather than first understanding the ranking of importances.
I'm trying to hit exactly to this point with Bark wavelet. To tell me what are the best trade offs one should make in designing the better loudspeaker.
- Elias
I'm not familiar with what that chart means, but isn't the Bark bands just dividing the frequency into 24 bands (or probably more)? I would also consider the ear sensitivity curves also as a way of determining what might be critical.
Some extra observations can be made about the critical bandwidth. The low frequency behaviour is interesting (maybe even striking for some). At low frequencies (<200Hz) the processing bandwidth is very wide (compared to center frequency). Wide processing bandwidth means high temporal resolution. The fine temporal resolution allows to follow the rapidly varying changes in the envelope of the sound. This could indicate that at low frequencies ear is primarly a temporal device!
Now, you'll find someone claiming you something like "at low frequencies steady state is all we hear" but that is some thick gibberish coming out from the Tuba!!
- Elias
Now, you'll find someone claiming you something like "at low frequencies steady state is all we hear" but that is some thick gibberish coming out from the Tuba!!
- Elias
The actual number of bands depends the physical measures of cochlea and there are about 3000 of them. They must be concidered as sliding window through the frequency scale.
Yes, the level is important. But some studies indicate level independent linear bandwidths are an adequate starting point.
I am, however, considering adding level dependency on the model. This what I'm doing now it's just a start 😀
- Elias
Yes, the level is important. But some studies indicate level independent linear bandwidths are an adequate starting point.
I am, however, considering adding level dependency on the model. This what I'm doing now it's just a start 😀
- Elias
I'm not familiar with what that chart means, but isn't the Bark bands just dividing the frequency into 24 bands (or probably more)? I would also consider the ear sensitivity curves also as a way of determining what might be critical.
https://ccrma.stanford.edu/~jos/bbt/Bark_Frequency_Scale.htmlThe actual number of bands depends the physical measures of cochlea and there are about 3000 of them. They must be concidered as sliding window through the frequency scale.
...
- Elias
Lecture 006 - Hearing I
Basilar membrane vibrating within critical band:
Basilar membrane vibrating within critical band:
An externally hosted image should be here but it was not working when we last tested it.
Lecture 007 Hearing II
"
Loudness of complex sounds
Because the acoustic intensity of the sound is also proportional to the sum of the squared pressure the loudness of a sound within a critical band is independent of the number of frequency components so long as their total acoustic intensity is constant. When the frequency components of the sound extend beyond a critical band an additional effect occurs due to the presence of components in other critical bands. In this case more than one critical band is contributing to the perception of loudness and the brain appears to add the individual critical band responses together. The effect is to increase the perceived loudness of the sound even though the total acoustic intensity is unchanged."
An externally hosted image should be here but it was not working when we last tested it.
Hello Elias,
I like the "based on Bark" wavelet graph a lot.
But I don't have enough time for now to read papers referring to the suject.
Is there, for a given frequency, any possible estimation of the width of the Bark window used in the wavelet graph in term of number of wavelengths.
If any I could adapt my "quasiwavelets" routine.
Best regards from Paris, France
Jean-Michel Le Cléac'h
Very true! I'm thinking to take it into account by an integrator, or lossy integrator.
I'm also experimenting here different solutions. I don't have the meta theory in one formula yet. Getting there maybe one day 😉
- Elias
I'm also experimenting here different solutions. I don't have the meta theory in one formula yet. Getting there maybe one day 😉
- Elias
Duration of sound is also critical to perception.😉
Hello Jean-Michel,
You are using Gaussian window?
If yes then you can try the following:
In this experimental Bark wavelet I matched the -3dB bandwidth of the wavelet to the critical bandwidth and also the center freq of the wavelet to the Bark scale center freq.
According to Zwicker / Fastl critical bandwidth is:
bw = 25 + 75*(1 + 1.4*(fc/1000).^2).^0.69;
where fc is center freq of the wavelet in [Hz].
Then the Gaussian modulator at the center freq is:
e.^(-t.^2*bw^2/0.16);
where t is time vector centered at t=0 and bw is the critical bandwidth corresponding to the center freq.
I used complex modulatee with this modulator to generate the wavelet.
Post a plot if you succeed 🙂
- Elias
Hello Elias,
I like the "based on Bark" wavelet graph a lot.
But I don't have enough time for now to read papers referring to the suject.
Is there, for a given frequency, any possible estimation of the width of the Bark window used in the wavelet graph in term of number of wavelengths.
If any I could adapt my "quasiwavelets" routine.
Best regards from Paris, France
Jean-Michel Le Cléac'h
Hello Elias,
Thanks for the formula, I'll see what I can do with it.
In the original version of my quasiwavelets Matlab routine I used a Gaussian window.
But in the latest version, the one used in David McBean's software "Hornresp" see as an example
http://www.diyaudio.com/forums/attachments/subwoofers/177241d1277209292-hornresp-2.png
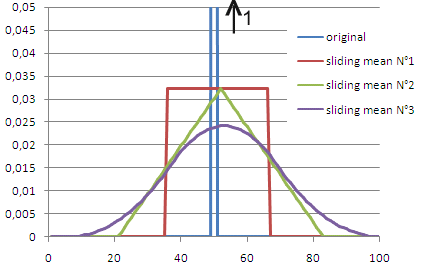
, which is a superfast quasiwavelets routine specially written to be easily translated under Visual Basic I don't use any time consuming function as EXP, LOG... I use a quasi Gaussian window (of finite width) obtained by applying 3 steps of a sliding mean.
A graphical explanation is given by the graph
http://www.diyaudio.com/forums/attachments/subwoofers/186359d1283504299-hornresp-sliding_means.gif
Simplistic explanations (too much simplistic may be so in the end I don't know if it is understandable...) of my fast quasi wavelets algorithm is given in message:
http://www.diyaudio.com/forums/subwoofers/119854-hornresp-142.html#post2292136
Best regards from Paris, France
Jean-Michel Le Cléac'h
Thanks for the formula, I'll see what I can do with it.
In the original version of my quasiwavelets Matlab routine I used a Gaussian window.
But in the latest version, the one used in David McBean's software "Hornresp" see as an example
http://www.diyaudio.com/forums/attachments/subwoofers/177241d1277209292-hornresp-2.png
, which is a superfast quasiwavelets routine specially written to be easily translated under Visual Basic I don't use any time consuming function as EXP, LOG... I use a quasi Gaussian window (of finite width) obtained by applying 3 steps of a sliding mean.
A graphical explanation is given by the graph
http://www.diyaudio.com/forums/attachments/subwoofers/186359d1283504299-hornresp-sliding_means.gif
Simplistic explanations (too much simplistic may be so in the end I don't know if it is understandable...) of my fast quasi wavelets algorithm is given in message:
http://www.diyaudio.com/forums/subwoofers/119854-hornresp-142.html#post2292136
Best regards from Paris, France
Jean-Michel Le Cléac'h
Hello Jean-Michel,
You are using Gaussian window?
If yes ...
.... Post a plot if you succeed 🙂
Last edited:
- Status
- Not open for further replies.
- Home
- Loudspeakers
- Multi-Way
- WTF!? Wavelet TransForm for audio measurements - What-is? and How-to?