Hi,
I'd like to add few points, not to pick but to broaden the perspective.
I rather see the impulse response processing as a special case of wavelet analysis. Certainly most of the cases in the field the signals to be analysed are not related to impulse responses in any way. I just thought wavelets also suit audio analysis very well, and impulse response is a natural place to start.
I think it's just the opposite way: with wavelet analysis we can understand what is going on in the impulse!
One can use various methods (FR, CSD, Burst response, wavelet) to gain the total understanding if it is lacking.
I think wavelet is more valid, in terms of human sound perception, than impulse or frequency response. Human do not process the sound by capturing the impulse response and calculating the frequency response. It rather happends dynamically in the time-frequency domain. Frequency response do not indicate that. 'Constant Q' wavelet on the other hand follows more closely what is perceived.
Well 😀 There is a duality of frequency response and the infinity in time domain. It is mathematically equally valid to determine the freq response by inserting a number of sinusoids of infinite length to the system and measure amplitude and phase of the sinusoids to obtain the frequency response. There is no argument if this is practical or not, but giving the same result as Fourier transform of the impulse response it is valid. Of course it requires the signal to be in steady state, and thus it can be said the frequency response is a steady state measure.
Yes wavelet is a time-frequency domain method, and as such it gives you more in one plot than frequency response will do.
Overall I think it is time to move on to the next level and give less emphasis on frequency response as a quality measure of the system (e.g. a loudspeaker). I think it is invalid method and at best gives results only of suggestive nature when human psychoacoustics are considered.
I think there are methods that better serve the purpose - to visualise what is being heard. Wavelets.
- Elias
I'd like to add few points, not to pick but to broaden the perspective.
The entire wavelet analysis is just convolution with the system impulse
I rather see the impulse response processing as a special case of wavelet analysis. Certainly most of the cases in the field the signals to be analysed are not related to impulse responses in any way. I just thought wavelets also suit audio analysis very well, and impulse response is a natural place to start.
If you do not understand what is going on with the impulse how can you interpret what the wavelet analysis tells you? And once again, FR, CSD, Burst response, wavelet, step response...., are all just post processing of the impulse.
I think it's just the opposite way: with wavelet analysis we can understand what is going on in the impulse!
One can use various methods (FR, CSD, Burst response, wavelet) to gain the total understanding if it is lacking.
Frequency response? Forget about it. It is just a representation of the impulse. Wavelet analysis is not more valid, it is just a representation of the impulse.
I think wavelet is more valid, in terms of human sound perception, than impulse or frequency response. Human do not process the sound by capturing the impulse response and calculating the frequency response. It rather happends dynamically in the time-frequency domain. Frequency response do not indicate that. 'Constant Q' wavelet on the other hand follows more closely what is perceived.
No. FR has nothing to do with steady state (deja vu here). The system's Frequency Response is the FT of its impulse response. That is the definition of the FR.
Well 😀 There is a duality of frequency response and the infinity in time domain. It is mathematically equally valid to determine the freq response by inserting a number of sinusoids of infinite length to the system and measure amplitude and phase of the sinusoids to obtain the frequency response. There is no argument if this is practical or not, but giving the same result as Fourier transform of the impulse response it is valid. Of course it requires the signal to be in steady state, and thus it can be said the frequency response is a steady state measure.
The wavelet analysis shows the varying spectral content of narrow slices of the impulse response over time. It is a useful plot, but it does not show the system's frequency response, that is not its purpose.
Yes wavelet is a time-frequency domain method, and as such it gives you more in one plot than frequency response will do.
Overall I think it is time to move on to the next level and give less emphasis on frequency response as a quality measure of the system (e.g. a loudspeaker). I think it is invalid method and at best gives results only of suggestive nature when human psychoacoustics are considered.
I think there are methods that better serve the purpose - to visualise what is being heard. Wavelets.
- Elias
I think it's just the opposite way: with wavelet analysis we can understand what is going on in the impulse!
One can use various methods (FR, CSD, Burst response, wavelet) to gain the total understanding if it is lacking.
- Elias
I agree, maybe some people can look at the impulse and spot things but not everyone is an expert so this wavelet helps the rest of us understand what issues are going on. The impulse didnt show me the "ringing" down low in my waveguides like this stuff does.
Side by side comparison of impulse measurements = unclear results and they are BORING.
side by side comparisons of wavelets = distinct difference and they also look good.
Why do people care what anyone else uses. If someone can look at the impulse and be 100% accurate in their conclusions, more power to them. The wavelets are just another tool to help people see something in a different way.
Hello John,
I tried to equalize above 1 Hz (previously it was 10Hz) and the result is better now.
Above which frequency the NaO is "dipole" equalized?
As you said, the loudspeaker itself will bring its own contribution to level and phase variation at low frequency and this is probably the main origin of the tail we observe on the measured IR of the dipole (rise in group delay at low frequency).
The choice of the frequency above which the equalization is performed has to be also done in order for the coil to not get out of the gap to easily (Xmax...).
In the document
http://infraplanar.free.fr/Mesures-champ-libre.pdf
you'll see in fig 21 the free field measurement at 5 meters of a large dipole commercialzed under the label "Infraplanar".
We can see the 6dB slope very easily (the whole curve until 500Hz is consistent with a diffrence of path of 96centimeters between the rear wave and the front wave).
We had hard discussions about the need or not to equalize it.
When listening in proximity (from 1 to 3 meters)
at 1 meter, the intensity from the front wave begins to dominate and the response get flatter. This can be seen in figures 008 and 020 (taken at 1 meter at 45° and 0° respectively). At the moment I don't know a single listener of that Infraplanar who would use equalization. May be if they read you they'll change your mind...
Best regards from Paris, France
Jean-Michel Le Cléac'h
None of my examples are for my speakers. They are just examples. Also let's not confuse more or less "point source" dipoles with large planar radiators. You are correct in that dipole speakers will tend to the response of the front side only as listening distance decreases. I have a web page that discusses that. But with large planers there is also the effect of baffle size which comes into play. It gets more complicated. They really aren't dipoles at all except at low frequency
But over all this is still a minimum phase thing. Dipole low frequency response, far from the sources, follows a 1st order LP response with pole at the dipole peak frequency and a zero at 0 Hz. As you move closer the the zero moves higher in frequency. The response becomes that of an shelving filter.
But with a woofer system you must realize that the response has a number of poles and zeros not only associated with the dipole behavior, but also with the natural roll off of the driver for the woofer. There are a number of ways to perform the EQ of the entire system when accounting for the response of the woofer. Again, I have discussed this in some detail in my article on Gradient Woofer Equalization. In the case on the NaO II the woofer is EQ'ed approximately as discussed for a 2nd order high pass with Q<0.5 woofer, and will ultimately roll off 3rd order. I add a 5 Hz, 1st order HP section in addition so at very low frequency the response rolls off 4th order. In the NaO Note my low frequency target is a 3rd order Bessel high pass. Again I add a 1st order HP at 5 Hz (or below).
We have been discussin things here using point sources flat to DC. In reality the dipole transfer function is superimposed (cascaded) onto the monopole response of the actual driver used for the dipole system, atleast at low frequency. But the bottom line is still that what ever the applied EQ is, the low frequency response remains MP and will have impulse to match the target response.
When you look at large panels the next thing that complicates things is what happens in a room. With an H frame woofer room response is pretty well analyzed as two out of phase point sources place some distance apart. But with a large panel the idea of source is a point source becomes questionable. With large panels or even dynamic driver on large baffles, there is also the possibility of blocking reflections from the wall by the baffle leading to midrange colorations. My experience with large format dipoles, like Dayton Wright XG10, Acoustat IV, and my own design indicates that they need to be out in the room to sound best.
An externally hosted image should be here but it was not working when we last tested it.
Michael, at some point I hope you will comprehend how nonsensical that question is. .Good
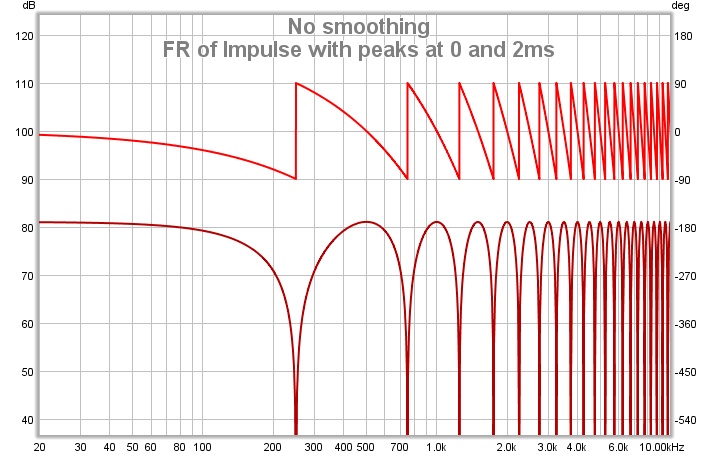
And - at what time slot does that spectral distribution actually happen ?
Thanks for you good wishes – but I guess we probably only talk „chicken to duck“ 😉
Not knowing how you got your FR plot – but anyway - its just the same I get when doing the SPICE simus I've shown in my paper.
*If* you use something as flexible as SPICE you probably also should try transient analysis.
I strongly suggest you to try sine bursts at different frequencies.
This would simply result in the plots outlined in my paper (there inverted in phase to mimic OB of course = -6dB slope).
As Elias said *if* you would pack together all sine bursts form all frequencies – this would show
1.)the FR if looked at time slot „infinity“
2.)would show Elias CMP ladder if stimulus is switched of at those 4ms
So – the question arises:
At what time slot is FR valid with CMP systems ?
And the answer is :
from „after delay time“ till stimulus „switch off“ (...the spectral distribution of an ideal native source equals such a "FR")
The *additional* question is :
Whats until „delay time“ & whats after stimulus „switch off“ ?
This additional question is answered by CMP concept.
Without CMP this additional question and answer is pretty meaningless (as its determined by the FR itself) – or as you would say „nonsensical“
🙂
Michael
Last edited:
Hi,
I'd like to add few points, not to pick but to broaden the perspective.
I rather see the impulse response processing as a special case of wavelet analysis. Certainly most of the cases in the field the signals to be analysed are not related to impulse responses in any way. I just thought wavelets also suit audio analysis very well, and impulse response is a natural place to start.
I was talking in the context it is being used here, to evaluate speaker performance.
I think it's just the opposite way: with wavelet analysis we can understand what is going on in the impulse!
One can use various methods (FR, CSD, Burst response, wavelet) to gain the total understanding if it is lacking.
As I have said, these are all post processing of the impulse. All of them show the same info in a different light. If it helps great.
I think wavelet is more valid, in terms of human sound perception, than impulse or frequency response. Human do not process the sound by capturing the impulse response and calculating the frequency response. It rather happends dynamically in the time-frequency domain. Frequency response do not indicate that. 'Constant Q' wavelet on the other hand follows more closely what is perceived.
Actually I think FR does. It just requires knowing what you are looking at. Wavelet analysis, like CSD and burst response, help quantify things in the time domain, but the fundamental problems are apparent int he FR.
Well 😀 There is a duality of frequency response and the infinity in time domain. It is mathematically equally valid to determine the freq response by inserting a number of sinusoids of infinite length to the system and measure amplitude and phase of the sinusoids to obtain the frequency response. There is no argument if this is practical or not, but giving the same result as Fourier transform of the impulse response it is valid. Of course it requires the signal to be in steady state, and thus it can be said the frequency response is a steady state measure.
And it would be equally valid to use the frequency response so obtained as the input to an IFFT to generate the impulse. The problem is that using sine waves it becomes difficult to obtain the phase response. Many sine sweep FR tools don't generate anything but amplitude response which, alone, isn't much help.
Yes wavelet is a time-frequency domain method, and as such it gives you more in one plot than frequency response will do.
Overall I think it is time to move on to the next level and give less emphasis on frequency response as a quality measure of the system (e.g. a loudspeaker). I think it is invalid method and at best gives results only of suggestive nature when human psychoacoustics are considered.
I think there are methods that better serve the purpose - to visualise what is being heard. Wavelets.
I don't know. Like FR and impulse and any other measurement, the wavelet is only an analysis of what is happening at a single point in space, the measurement point. And any speaker that is designed to have flat response at the design point will look pretty good no matter how it is looked at. The problems that show up in a wavelet analysis are the same ones that show up in FR, burst, CSD: stored energy or linear distortion. Take a look at this figure:
An externally hosted image should be here but it was not working when we last tested it.
Taken alone, which tells you more about the speaker? From my position I see problems, particularly below 1k hz in both figures. But the FR plot on the left shows me just what they are. If I "fix" (flatten) the amplitude response the wavelet will look much better. I can fix the FR by just looking at the FR. But given just the wavelet plot, what would I do to fix it? I doesn't tell me what the cause of the problem is. It just says there is a problem.
So – the question arises:
At what time slot is FR valid with CMP systems ?
Michael
The answer is that frequency response is a steady state (SS) concept. We have been through that before. SS = no turn on, no turn off. The stimulus has been on forever and will remain on for evermore.
Remember Hoyle and the SS Universe? It always was and always will be.
We measure (approximately) steady state results by applying a stimulus for a period of time much, much longer than the duration of the impulse. Even in a single impulse system if we do not meet this requirement the result will not be representative of the SS.
As I said Micheal, you have presented a result which substantiates you position. But that case is not representative of a correctly designed OB system. .
I'd rather not go into a discussion about "correctly designed OB" at hand of your new NAO - too many bad experience in such cases.
By the way - you still have me on your early adapters list for the NAO Note ?
😉
If you'd like to go ahead with CMP discussion "as such" - I'd be pleased, though.
I guess we should go beyond "what can be measured via IR" and look at how does CMP work at hand of simulation (much clearer there to demonstrate).
IR is by no means any revealing (to the most of us) - and FR in case of CMP systems, well, you know my position.....
Michael
Last edited:
The answer is that frequency response is a steady state (SS) concept. We have been through that before. SS = no turn on, no turn off. The stimulus has been on forever and will remain on for evermore.
Remember Hoyle and the SS Universe? It always was and always will be.
We measure (approximately) steady state results by applying a stimulus for a period of time much, much longer than the duration of the impulse. Even in a single impulse system if we do not meet this requirement the result will not be representative of the SS.
Thanks - this is what I said and meant.
You *can* turn on a system but you have to wait a whole eternity to reach steady state - so FR in any case represents spectral distribution for a time slot at eternity (with non CMP system).
----------------
The exception is with ideal (ruler flat) system - there FR represents spectral distribution from the very beginning (with non CMP system).
And in case of CMP systems - FR is pretty meaningless due to their discontinuous time behaviour
Michael
Last edited:
Hi John,
Please take a note that the wavelet plot you show is normalised, and amplitude info vs frequency has been lost!
Usually wavelet normalisation is applied to better see the temporal phenomenas, but that is no necessity if one needs to observe the 'whole' picture. Sometimes it good to see both unnormalised and normalised plots.
If there would be no normalisation the same bumps would be visible in wavelet plots, of course plus the temporal information that's missing from the freq response plot.
- Elias
An externally hosted image should be here but it was not working when we last tested it.
Taken alone, which tells you more about the speaker? From my position I see problems, particularly below 1k hz in both figures. But the FR plot on the left shows me just what they are. If I "fix" (flatten) the amplitude response the wavelet will look much better. I can fix the FR by just looking at the FR. But given just the wavelet plot, what would I do to fix it? I doesn't tell me what the cause of the problem is. It just says there is a problem.
Last edited:
Hi John,
Please take a note that the wavelet plot you show is normalised, and amplitude info vs frequency has been lost!
Usually wavelet normalisation is applied to better see the temporal phenomenas, but that is no necessity if one needs to observe the 'whole' picture. Sometimes it good to see both unnormalised and normalised plots.
If there would be no normalisation the same bumps would be visible in wavelet plots, of course plus the temporal information that's missing from the freq response plot.
- Elias
The point about normalization is well taken but I think it is incorrect to state than the same bumps would be present in the response. Correct me if I am wrong. Going back to what I said about SS in my post to Michael; Wavelets are basically an input signal convolved with the system input. That signal is of finite duration and it may not be of sufficient duration for the system to come to steady state amplitude at all or even any frequencies.
Additionally, as you probably know, for constant Q (or bandwidth) analysis there is a trade off between frequency resolution and time resolution. Higher Q yields greater frequency resolution but lower time resolution and vise versa. It is like smoothing in the frequency domain. You will see dips and peaks in the response but they are just mapping out the temporal response vs frequency and a slice at any given time does not represent the system frequency response. Michael will tell you that. 🙂
But I have never been against adding tools to my tool box. I just not convinced that adding this tool will help me build a better speaker.
In any event, I am more concerned with the misconceptions of this so called CMP stuff applied to OB or any system.
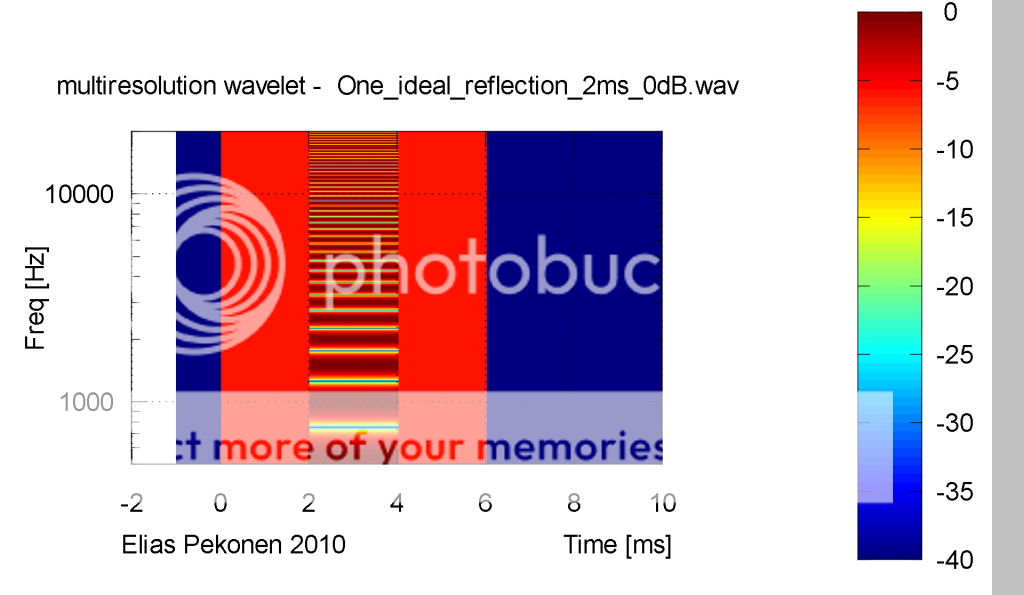
As usual Michael (sorry, Donald) you are wrong. One last time: the system FR is not the spectrum of the system output, it is the spectrum of the impulse response, the whole impulse response, and nothing but the impulse response. You seem to be obsessed with "time slots" and the spectra of small slices of time signals, whether those time signals are impulse responses or the responses of systems to other stimuli. Think for a moment what Elias' wavelet plot of the IR would look like if generated using a wavelet with higher time resolution, let's say one that spans 1ms. Now the plot just shows two vertical red bars centred around 0ms and 2ms. Where is your "CMP ladder"? Is the new plot, with its greater time resolution, a better view of the system behaviour? Let's narrow the wavelet so it only spans one sample period. Now the plot looks just like the impulse response, a spike at 0ms and a spike at 2ms. Is that an improvement? Oops, that's no good, you don't find impulse responses to be "revealing". Let's try much lower time resolution, maybe that will be better. But now the whole plot is starting to look like the system FR, with its notches spaced at 500Hz. But let's pretend it isn't an exact copy of the FR for the whole period the wavelet spans the twin spikes of the IR, let's invent a new name for it, maybe "CMP ladder", that sounds much more clever that just observing it happens to be the same as the FR.As Elias said *if* you would pack together all sine bursts form all frequencies – this would show
1.)the FR if looked at time slot „infinity“
2.)would show Elias CMP ladder if stimulus is switched of at those 4ms
So – the question arises:
At what time slot is FR valid with CMP systems ?
And the answer is :
from „after delay time“ till stimulus „switch off“ (...the spectral distribution of an ideal native source equals such a "FR")
The *additional* question is :
Whats until „delay time“ & whats after stimulus „switch off“ ?
This additional question is answered by CMP concept.
Without CMP this additional question and answer is pretty meaningless (as its determined by the FR itself) – or as you would say „nonsensical“
Most people look at an IR, see its value varying over its duration, and are not surprised that the output when signals are passed through a system with that IR also varies. They are similarly unsurprised that the spectrum of that varying output varies. But Donald is. He is so profoundly surprised by how much that variation can be when the IR has a later peak as large as the initial peak that he feels such systems are too grand to be described by their impulse response or frequency response, no, they should have some entirely new way of describing them, which he will figure out later, and certainly an entirely new name. "System with echo", maybe? No, far too obvious. I'm sure Donald can come up with something better than that, as soon as he gets back from a few more laps of the pond. He always has better ideas after munching on some pond weed.
 Let's keep to the subject and away from personal remarks, please.
As usual Michael (sorry, Donald) you are wrong.
...
As much as I love to keep discussions „light“, I don't like the connotation either 🙁
Besides that, I never particularly liked that „Doanld“ figure nor did I particularly like the stories. From nowadays view I'd possibly say I don't particularly like the cynicism of the ultra conservative dogma behind that product – characterized in short, its just „another brick in the wall“ - severely lacking precious things in life, like personal development and having the choice...
...
One last time: the system FR is not the spectrum of the system output,
As for the CMP ladder – just look at it like the logged output of an „ideal“ spectrum analyzer.
You are not going to tell me that the output of a spectrum analyzer (at time slot „eternity“) does not represent the spectral distribution of FR (for non-CMP systems) – do you?
What such a tool makes obvious is tht discontinuity of the CMP systems in time. IR plots can show us this as well (*if* we are able to read it) - FR plots can not – hence „FR concept“ is void in the context of CMP systems.
In any event, I am more concerned with the misconceptions of this so called CMP stuff applied to OB or any system.
Hey John – why concerned ???
Either CMP a „real thing“ or it is not.
If not – who cares (except me) ?
If yes – I guess not a single Maggi, or NAO or Quad or.. will sound less superb or exciting from now on
So why concerned about CMP concept?
I mean – we could be happy to have a new tool / toy to wrap our head around and all the fans of double blind tests will have a loooot of fun too – no ?
Michael
Last edited:
The point about normalization is well taken but I think it is incorrect to state than the same bumps would be present in the response. Correct me if I am wrong.
Amplitude information can be maintained in wavelet plot. Why is the assumption that it wouldn't?
Also why assume that the bumps in the frequency response have any psychoacoustic meaning? As I said human don't process impulse response like Fourier transform.
Wavelets are basically an input signal convolved with the system input. That signal is of finite duration and it may not be of sufficient duration for the system to come to steady state amplitude at all or even any frequencies.
Yes wavelets are not steady state signals, but that's a benefit not a lack! Music is not steady state either 🙂 If we design system to reproduce music, one can think if steady state is a meaningful concept or not. I think it is not.
Additionally, as you probably know, for constant Q (or bandwidth) analysis there is a trade off between frequency resolution and time resolution. Higher Q yields greater frequency resolution but lower time resolution and vise versa.
Same tradeoff applies to frequency response as well, but there the trade is worse - no time resolution at all. I think it's a lack of frequency response.
Wavelet is fully scalable in this time-frequency trade off. It can have constant logarithmic bandwidth (constant Q), increasing bandwidth vs freq (similar to CSD), or any arbitrary function, or matched to psychoacoustic models, for example.
It is like smoothing in the frequency domain.
Notice that if you use smoothing it does not represent the system frequency response anymore (the system has been modified).
- Elias
Amplitude information can be maintained in wavelet plot. Why is the assumption that it wouldn't?
Every system, loudspeakers or otherwise, that does not have a perfect impulse (which translates to flat amplitude and linear or zero phase) has stored energy or linear distortion. Put simply, that means it takes time for the system to response to the input. That is the point of the WTF in the first place, to visualize the time distortion. Being that it takes time to response and being that the wavelet has a continuous time variation, the system can not reach its steady state amplitude because, due to the time lag, the system will always have an output amplitude some what different than it would if given the same amplitude input in SS. Thus, when the wavelet reaches its peak level the system will not be at that peak. But then the wavelet amplitude begins to decay and, as a result the system is no longer being forced toward the max level and it will also begin to decay. Only if the system has perfect response will it exactly follow the input. So, when the system is responding to a wavelet input it can never reach the true SS values of amplitude. Depending on the transient response of the system, it may come close at some frequencies and not so close at others. But the wavelet, being time varying and hitting peak amplitude only for an instant, will never drive the system to SS amplitude, unless the system is perfect. There can never be a constant time slice of a wavelet transformation which has the same amplitude spectrum as the steady state frequency response unless the system is perfect. The dips and peaks seen in the wavelet plots may be indicative of dips and peaks in the SS FR, but they are not the same amplitude.
It can be likened to stepping on the accelerator of a car. If you are on a long flat, straight road and floor the gas the car begins to accelerate. Hold the gas down and eventually the car will reach it maximum speed. But if you take you foot off the gas, the car immediately starts to decelerate.
Also why assume that the bumps in the frequency response have any psychoacoustic meaning? As I said human don't process impulse response like Fourier transform.
Who said anything about psychoacoustics? I am referring to physical accuracy. Seems to me the WFT is being applied here to view temporal behavior, i.e. transient distortion. If you want to make the system perfect then what is needed is to drive the error to zero. To do that it would be better to look at the difference between the perfect wavelet response and the speaker's wavelet response, an error wavelet so to speak. If I look at FR the errors are rather apparent.
Yes wavelets are not steady state signals, but that's a benefit not a lack! Music is not steady state either 🙂 If we design system to reproduce music, one can think if steady state is a meaningful concept or not. I think it is not.
Here we go again. SS FR has all the time information in it. If the SS FR is flat and zero or linear phase then the speaker will have perfect time domain response. The output would be a perfectly scaled version of the input.
Same tradeoff applies to frequency response as well, but there the trade is worse - no time resolution at all. I think it's a lack of frequency response.
You haven't been paying attention to JohnPM and me. Frequency response is just a characterization of a system in the frequency domain. The impulse response is the system characterization in the time domain. The FFT/IFFT allow us to go between one and the other. Wavelet analysis melds the two.
Wavelet is fully scalable in this time-frequency trade off. It can have constant logarithmic bandwidth (constant Q), increasing bandwidth vs freq (similar to CSD), or any arbitrary function, or matched to psychoacoustic models, for example.
Certainly true, but then you have to start defining what each of those really means and how to interpret them.
Notice that if you use smoothing it does not represent the system frequency response anymore (the system has been modified).
- Elias
Well it still goes back to the impulse as that is the mother of all this stuff. Smoothing of the FR is post processing too.
But this argument has other implications. We would hopefully agree that wavelet analysis is intended to show temporal distortion and that when looking at the wavelet analysis of a speaker's impulse response we see, at any time is a spectrum of the output. When compared to the spectrum of the perfect output this represents error. That error arises from two and only two sources, non flat SS amplitude response and nonlinear phase. Now, there has been lots of research indicating that our perception of things like timbre are primarily dependent on the direct sound. Thus, if the spectrum of the direct sound doesn't match the spectrum of the input it would seem that the perceived timbre etc would be different. Since even with flat amplitude there will be temporal distortion perhaps this would lead to reconsidering the effects of phase distortion. It has long been stated that linear phase system sound different and this has been "blamed" on pre-ringing of linear phase systems. I examined this and what I tend to conclude is that on axis there is no effect of pre-ringing. Off axis the distortion due to pre-ringing is less than that which occurs on axis fro an LR4 type crossover. The difference seems to me to be in that there may be less difference between and LR4 on and off axis than between a linear phase system on and off axis. Perhaps wavelet analysis would aid in illustrating these differences. Perhaps the difference is that on axis the linear phase system is correct?
But the thing that amuses me the most at this point is this condemnation of frequency response as not having temporal information in it. As you can see from this figure I put together,the way the wavelet transformation is computed in CLIO is to use the frequency domain representation of convolution. The conjugate of the FFT of the wavelet is multiplied by the FFT of the impulse response (i.e. system frequency response) and the result IFFT'ed back to the time domain. How is that going to work if the frequency response doesn't have all the temporal information of the system embedded in it? In particular, Michael, how can your wavelet analysis of you CMP behavior be based on the SS frequency response of the CMP system if FR is meaningless? Are you now going to tell us that wavlet analysis fails on your CMP?
An externally hosted image should be here but it was not working when we last tested it.
Every system, loudspeakers or otherwise, that does not have a perfect impulse (which translates to flat amplitude and linear or zero phase) has stored energy or linear distortion. Put simply, that means it takes time for the system to response to the input. That is the point of the WTF in the first place, to visualize the time distortion. Being that it takes time to response and being that the wavelet has a continuous time variation, the system can not reach its steady state amplitude because, due to the time lag, the system will always have an output amplitude some what different than it would if given the same amplitude input in SS. Thus, when the wavelet reaches its peak level the system will not be at that peak. But then the wavelet amplitude begins to decay and, as a result the system is no longer being forced toward the max level and it will also begin to decay. Only if the system has perfect response will it exactly follow the input. So, when the system is responding to a wavelet input it can never reach the true SS values of amplitude. Depending on the transient response of the system, it may come close at some frequencies and not so close at others. But the wavelet, being time varying and hitting peak amplitude only for an instant, will never drive the system to SS amplitude, unless the system is perfect. There can never be a constant time slice of a wavelet transformation which has the same amplitude spectrum as the steady state frequency response unless the system is perfect. The dips and peaks seen in the wavelet plots may be indicative of dips and peaks in the SS FR, but they are not the same amplitude.
It all depends on the selection of the wavelet, and there is no limitations in the selection of it in this regard.
But the thing that amuses me the most at this point is this condemnation of frequency response as not having temporal information in it. As you can see from this figure I put together,the way the wavelet transformation is computed in CLIO is to use the frequency domain representation of convolution. The conjugate of the FFT of the wavelet is multiplied by the FFT of the impulse response (i.e. system frequency response) and the result IFFT'ed back to the time domain. How is that going to work if the frequency response doesn't have all the temporal information of the system embedded in it?
But you see the freq response and impulse response takes place in different domains. That's why there is need to have a domain transformation to flip back and forth between them. In frequency domain there is no time, it is one dimensional, the only dimension is frequency. The same is true for time domain, there is no frequency.
What we need is a combined time-frequency domain to observe both dimensions at once in one plot.
Due the lack of temporal resolution of FT they invented STFT. Wavelet is an additional step from here providing more flexibility and additional benefits.
- Elias
It all depends on the selection of the wavelet, and there is no limitations in the selection of it in this regard.
But you see the freq response and impulse response takes place in different domains. That's why there is need to have a domain transformation to flip back and forth between them. In frequency domain there is no time, it is one dimensional, the only dimension is frequency. The same is true for time domain, there is no frequency.
What we need is a combined time-frequency domain to observe both dimensions at once in one plot.
Due the lack of temporal resolution of FT they invented STFT. Wavelet is an additional step from here providing more flexibility and additional benefits.
- Elias
I think you missed the point on both counts.
In frequency domain there is no time, it is one dimensional, the only dimension is frequency. The same is true for time domain, there is no frequency.
These are 2 dimensional measurements AKFAIK, or doesn't amplitude count?
Hi,
You are right, amplitude is one. Wavelets are always 3D even if plotted as a flat plane.
- Elias
You are right, amplitude is one. Wavelets are always 3D even if plotted as a flat plane.
- Elias
These are 2 dimensional measurements AKFAIK, or doesn't amplitude count?
There are two quantities in the FR, magnitude and phase. The time information is in the phase. The FR is just the IR represented using a different basis, it is still the same IR, just expressed differently.In frequency domain there is no time, it is one dimensional, the only dimension is frequency.
Wavelets are by no means the optimal TFR, the wavelet transform distorts amplitudes (HF is attenuated) and does not maintain absolute phase reference.Due the lack of temporal resolution of FT they invented STFT. Wavelet is an additional step from here providing more flexibility and additional benefits.
- Status
- Not open for further replies.
- Home
- Loudspeakers
- Multi-Way
- WTF!? Wavelet TransForm for audio measurements - What-is? and How-to?