The voltage of the emission surface may be millivolts or less above the cathode nickel sleeve.
Silly question: How do you measure it?
With your little gopher perhaps? 😀
If you read up on the subject, you'll see that researchers have used such things as special custom test vacuum tubes with essentially two oxide cathodes pressed together emission surface to emission surface, enabling them to measure the radial resistance of the activated oxide. If you have a current flowing in a resistance, then you have a voltage drop.
So much post annoying with your nonsense about Va, insisting on the measurement of the voltage at the emitter surface, and now it results that it is needed a special valve???
Let me change the question:
How do you measure the voltage of the emitter surface (oxide coated cathode) in a common valve?
Why do you keep up with this nonsense?
As I pointed out before, it matters not a whit what scales you choose to graph with, or whether the axes be log, lin, square root, or freddy frogs.
Are you serious?
What matters is the percentage change in Ia for a given range in Va. Or, if you like, the percentage change on Ln(Ia) for a given range of root Va.
Rather than “if you like”, “you must” plot Ln(ia) vs √Va, let me explain…again
Js = Jo exp [(α √ Va ) / (k T)]
Then
Ln(Js) = Ln(ia/S) = Ln(ia) - Ln(S) = [α / (k T)] √ Va + Ln(Jo) =
= [α / (k T)] √ Va + Ln(io/S) = [α / (k T)] √ Va + Ln(io) - Ln(S)
It follows that
Ln(ia) = [α / (k T)] √ Va + Ln(io)
For Va high enough, this is a straight line, for a horizontal line it needs T → ∞
Same analysis applies to your nonsense about a horizontal line on ia vs Va.
Do you hear me now?

And as I pointed out to you before, your monochrome graph puporting to be for a pure tungsten cathode simply isn't. There's way too much change in Ia when compared with measured data for actual pure cathode tubes such a the AV44 regulator tube.
No Keit, please read the title:
Logarithm of thermionic emission current I of tungsten as function of square root of anode voltage Va. (After W. B. Nottingham, Phys. Rev., 58:927–928, 1940)
Clearly, the plot corresponds to Ln(ia) vs √Va, and I must repeat over and over…
Now, increase the anode-cathode spacing to 20 mm...
Whoa! That is a diode! Is it similar to your mentioned A2087? 😀
According to you, the current will be greater, as you think schottky effect is driven by anode voltage. It ain't so - the current will be the same as before.
No Keit, the idea is change the electric field by changing Va
E = Va/dak
And with the same valve...you cannot change it in the middle of a measurement...
BTW, your proposed planar diode with variable geometry is not a real valve.
Please, stop to say nonsense, it is nasty explain you the same thing n times. 🙄
Last edited:
Bingo!
Your exotic planar diode with variable geometry of post#295 it is not...
Sure it is. There's no law that says the current cannot be drawn from the same terminal as the voltage is applied to.
You obviously are not familiar with how electronics is treated mathematically.
The six findamental components is standard stuff to electronic engineers.
So much post annoying with your nonsense about Va, insisting on the measurement of the voltage at the emitter surface, and now it results that it is needed a special valve???
Let me change the question:
How do you measure the voltage of the emitter surface (oxide coated cathode) in a common valve?
There's no terminal brought out for the purpose, so you can't. So what?
That doesn't mean it isn't there. As I explained, you can calculate it if you know the physical geometry of the valve, and the type of oxide mix used.
Rather than “if you like”, “you must” plot Ln(ia) vs √Va, let me explain…again
......
Your repetition proves nothing. You can repeat a wrong a 1000 times - it will still be wrong.
I say your nonsense is nonsense because it is nonsense. Here's a blatant example:-
Your post #271, about half way down:
That's utter nonsense.Contrary to your belief, "free" electrons inside the conductor (E=0) can "feel" the presence of an external electric field outside the conductor.
You must have realised that is nonsense yourself, for in your next post (#291), you said:
Unfortunately, as is blindingly obvious, that is an even bigger nonsense (even allowing for the word "producing" being a typo). Electrons outside the cathode has already been emitted - they have already been driven past the work function barrier and have escaped. Schottky is too late for them. The best they can do is contribute to the space charge and oppose emission by making some space charge electrons return to the cathode.... the electrons producing the work function barrier are outside the cathode, and then you have no excuse to admit Schottky effect in conductors.
I gues the last bit, "you have no excuse to admit Schottky effect" is a typo, as that has been my stated postion all along - you cannot have schottky effect in pure metal cathodes. You are the one who claimed you can. I assume you meant to say "you must admit schottky effect applies to conductors." Which I do not admit.
It doesn't matter how many times you repeat your graphs. Even using your Ln(Ia) vs root(Va) axes, the slope in your graphs is just well and truely too steep for real pure tungsten tubes.
I note that you have essentially two arguments - the math and the graphs. I've provided multiple reasons why both are wrong, and I notice you've never discussed those reasons, you just keep trotting out the same thing. At one point you came out with nonsense about images to support your contention, and I showed by example that you had misapplied the concept of images. No logical refutation by you was forthcomming.
You don't understand the math/physics of tubes. You just repeat. That's the beginning and end of it.
Put another record on.
Last edited:
also a electrostatic attraction can do something here 🙂 ?When it is turned on, there are temperature differences between the surfaces of the elements and glass which means that there are different vapour pressures at different locations.
In other words, the Ba vapour pressure close to the cathode is higher than that of the cooler glass or grid, resulting in diffusion of barium atoms away from hot surfaces.
also a electrostatic attraction can do something here 🙂 ?
Parafeed was of the view that B++ ions were emitted. If so they will mostly grab electrons from the sapce charge and continue on their way.
However, since more than one reference has informed us that BaO cathode matrix vaporises as BaO molecules, and the free (and neutral) Ba atoms present in the matrix due to activation will be the dominant gas species due to the vastly higher vapour pressure of Ba compared to BaO, electrostatic effects are not relavent.
Last edited:
No Keit, the idea is change the electric field by changing Va
E = Va/dak
And what, pray, is "dak"?
Typical of you, we have to guess. You often do this at critical points - I suspect it is an attempt to sow confusion, instead of informing.
If "dak" means "distance from anode to cathode", then that is precisely how I calculated the electric field in my planar diode/triode example.
So, answer the question, Popilin: In that example, does the current change or not? Why?
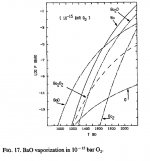
Concerning evaporation of BaO and (lack of) dissociation, here's confirmation that vapour pressure of Ba arising from evaporation of Ba-O is small:
http://www.nist.gov/data/PDFfiles/jpcrd326.pdf
High Temperature Vapourisation Behaviour of Oxides II. oxides of ..(..)..Ba...(..)..
Lamoreaux and Hildenbrand and Brewer 1986, p430:
"Recent mass spectrometric invetsigation in our own laboratory (Lamoreaux and Hildenbrand, 1983), however, show that under neutral conditions the ratio p(BaO)/p(Ba) is greater than 100....."
Attached is a clip from p430 which shows this graphically versus temperature.
Even below nominal cathode temperatures, condensation of intact BaO should significantly exceed that of Barium. As H/W also reads.
Attachments
Last edited:
Concerning evaporation of BaO and (lack of) dissociation, here's confirmation that vapour pressure of Ba arising from evaporation of Ba-O is small:
High Temperature Vapourisation Behaviour of Oxides II. oxides of ..(..)..Ba...(..)..
Lamoreaux and Hildenbrand and Brewer 1986, p430:
"Recent mass spectrometric invetsigation in our own laboratory (Lamoreaux and Hildenbrand, 1983), however, show that under neutral conditions the ratio p(BaO)/p(Ba) is greater than 100....."
But how relavent is this? Not at all relavent, it seems.
The text states that the data used to plot the graphs were calculated for evaporation of BaO. They make the point that for evaporating BaO, you won't get just BaO gas, you'll get traces of other species, eg Ba, O, Ba2O, BaO2, etc. Nothing remarkable about that - evaporation is driven by temerature, which also drives dissocaition.
However, these calculated results do not allow for activation - which happens in vaccum tube manufacturer and results in loss of oxygen and excess Ba atoms in the matrix. You can't have much Ba vapour if there was practically no Ba to start with.
Furrther, the authors state on page 430 that their calculated result does not agree with measured results obtained by several other independent researchers. But they don't describe the descrepancies, nor do they explain them. Not very confidence inspiring.
Even below nominal cathode temperatures, condensation of intact BaO should significantly exceed that of Barium. As H/W also reads.
You are mistaken there.
H/W Vol 1 fig 54 gives the evaporation rate of BaO, but Ba isn't mentioned. The data was obtained from a paper by Claasenn & Veenemans and is for unactivated BaO - their experimental apparatus did not provide for activation.
H/W Vol 2 fig 82 and fig 83 show that the vapour pressure (at tube temperatures) of Ba is about 10^9 times that of BaO, which agrees with Ba data in the CRC handbook and the BaO data given in Blewett J P, Liebhafsky H A, Henneley E F, The Vapor Pressure and Evaporation Rate of Barium Oxide, J Chem Phys 7 478 1939.
In order to be condensed, each species has to be evaporated (from the hot cathode) in the first place.
Last edited:
And what, pray, is "dak"?
Dark matter? 😕
Typical of you, we have to guess. You often do this at critical points - I suspect it is an attempt to sow confusion, instead of informing.
Sure, a trivial quotient in a critical point must produce confusion, and a derivative should be a mass destruction weapon. 😀
If "dak" means "distance from anode to cathode",…
Keit, I must admit that you are a kind of genius, how the hell did you to solve such extremely difficult issue? 😕
…then that is precisely how I calculated the electric field in my planar diode/triode example.
I have no doubt that you needed the equation in front of you to make such difficult calculation. 🙄
H/W Vol 2 Sec 6.31.2 p261 Evaporation of Excess Barium states published figures for rate of evaporation of Ba from a Bao/Ba cathode, in units of ug per hour per cm^2. At temperatures typical of oxide cathodes, this rate of evaporation can be directly contrasted with the (far faster) rate of evaporation of BaO published in Vol 1, and I've previously posted an overlay of these two results showing precisely that. Lamoreaux and Hildenbrand and Brewer appears to confirm this..........H/W Vol 1 fig 54 gives the evaporation rate of BaO, but Ba isn't mentioned.
Pointers are that BaO is the primary evaporate here, and presumably that is what condenses mostly on the grid. We'll soon see !
Sure it is. There's no law that says the current cannot be drawn from the same terminal as the voltage is applied to.
You obviously are not familiar with how electronics is treated mathematically.
I will refresh your memory
Now, consider this: Assume a planar diode (that is a diode with flat cathode near a flat anode). Let's say the cathode-anode spacing is 5mm. Let's say the anode voltage is +100 V. The electric field is thus 20V/mm - we can assume the space charge is well depleted. The anode current will be whatever it is, as a function of the tube dimensions, cathode temperature, schottky effect.
Now, increase the anode-cathode spacing to 20 mm and the anode voltage to +400V. The electric field is still 20V/mm.
According to you, the current will be greater, as you think schottky effect is driven by anode voltage. It ain't so - the current will be the same as before.
Your planar diode “grows up” with applied anode voltage in order to maintain constant the electric field, and then the constant current.
Rather than a voltage controlled current source, I would call this a voltage controlled nonsense which proves nothing, a desperate attempt to cover the sun with your hand.
There's no terminal brought out for the purpose, so you can't. So what?
So, all that you can measure referred to emission is Va and ia, and you had no reason to annoy through so much post with your nonsense about it.
Thermionic emission and Schottky effect are quantum phenomena.
Contrary to your belief, "free" electrons inside the conductor (E=0) can "feel" the presence of an external electric field outside the conductor.
That’s why Schottky effect is also shown in conductors.
From a classical visualization, the surface of the conductor has two sides, electrons at the surface, inside the conductor, can "see" both electric fields, E=0 inside and E≠0 outside, so I cannot see the problem.
This is also the third time that we discuss the surface issue, and we only agree on that the electric field inside the conductor
E = - ∇ φ = - ∇(constant) = 0
It results more than evident that the electric field must be evaluated at the surface, outside the conductor, regardless if it starts or terminates there.
According to the free electron model, the electrons producing the work function barrier are outside the cathode, and then you have no excuse to admit Schottky effect in conductors.
No contradiction at all, I gave you two alternate explanations for Schottky effect in conductors; you did not understand any of them, regardless my Tarzan-English.
Electrons outside the cathode has already been emitted - they have already been driven past the work function barrier and have escaped. Schottky is too late for them. The best they can do is contribute to the space charge and oppose emission by making some space charge electrons return to the cathode.
You are absolutely wrong, and this is the proof that you do not understand Schottky effect.
As I said before, in metals (conductors) according with the free electron model, the work function barrier is produced by an excess of electrons spilling out from inside the cathode to a distance of the order of interatomic distance, and these electrons cannot escape easily due to the force exerted by nuclei; do not confuse these electrons with those of the electron cloud (space charge)
Electrons of the metal (conductor) can escape surpassing the barrier, then and only then, they can be considered part of the electron cloud (space charge); and no, Schottky effect it is not too late for them, because the barrier was already lowered by the external electric field before they were emitted, which is the essence of Schottky effect, which obviously you cannot understand.
Even historically, in 1914 Walter Schottky discovered an irregularity in thermionic emission in a valve, now known as the Schottky effect.
No oxide cathodes at that time AFAIK.
At the beginning I thought that your obstinacy was due you were disingenuous, over the time I realized that simply you are not able to understand physics.
Quod natura non dat, Salmantica non praestat.
No offence intended.
Last edited:
H/W Vol 2 Sec 6.31.2 p261 Evaporation of Excess Barium states published figures for rate of evaporation of Ba from a Bao/Ba cathode, in units of ug per hour per cm^2. At temperatures typical of oxide cathodes, this rate of evaporation can be directly contrasted with the (far faster) rate of evaporation of BaO published in Vol 1, and I've previously posted an overlay of these two results showing precisely that. Lamoreaux and Hildenbrand and Brewer appears to confirm this..........
Pointers are that BaO is the primary evaporate here, and presumably that is what condenses mostly on the grid. We'll soon see !
Well, it says on page 262 that Kawamura measured the Ba evaporation rate at 7.5 ug.cm^-2.hr-1 at 1200 K. Fig 54 shows the evaporation of BaO at 1200 K to be about 2 ug.cm^-2.hr-1. (I think you may have gone on Becker's measurements, which were not applicable to "modern" oxide ctahodes, being about 2 orders of magnitude too low.)
So, it appears from that Ba still predominates, but only just and by nowhere near as much as I anticipated.
But wait....
H/W gets that figure from Kawamura H, On the evaporation of oxide cathode, Journ. Phys. Soc Japan 1946 (8).
That paper says that Kawamura measured it as follows:-
He used a special vacuum tube with an oxide cathode, and anode, and a grid wire outside the anode. It was constructed so that (judging by the drawing, by inverting the tube) the anode could be slid at will up and down. With the anode down, the anode shields the grid from cathode vapour. With the anode up the grid is exposed to cathode vapour.
He activated the cathode by a variation of the usual procedure not adequately explained.
He then operated the tube with anode up (thus exposing the grid to the cathode vapour) and periodically lowered the anode (blocking cathode emission) and measured the grid-anode current with the cathode emission blocked.
He thus did not measure the Ba mass transfer directly. He inferred it by the degree in which grid emission increased over time.
Interestingly, if you are correct and BaO is the dominant vapour species, he was really measuring that! He just assumed that the grid emission was due to Ba and not something else. He thus assumed that the cathode vapour was Ba and nothing else of significance. Perhaps he had good reason to assume that. Perhaps he didn't.
His measurement intervals were extremely short, minutes. Nothing like the 20,000 hour typical life of a commercial vacuum tube. I don't know how he accounted for general tube gas - he may simply not have. And his grid was a simple bent wire. Doesn't sound an accurate method. There no mention of any getter to soak up the oxygen (which must be liberated at the same rate as Ba), which would affect the test.
All things considered, I don't think we can rely on it.
The moral of the story: When taking from a book that information that isn't explained in that book, but simply quoted from another reference, always get that source reference and critically examine it.
Last edited:
...... We'll soon see !
Perhaps.
I have some reasons I haven't mentioned yet for thinking it may well remain unresolved. I haven't mentioned them because I don't want to queer Sy's lab procedure.
Perhaps.
I have some reasons I haven't mentioned yet for thinking it may well remain unresolved. I haven't mentioned them because I don't want to queer Sy's lab procedure.
Presumably you mean the oxidation of surface barium.
Yes, that is the crux here, and specifically the interaction with gold, platinum, silver that apparently leads to suppressed grid emission.........we'll soon find out !He thus did not measure the Ba mass transfer directly. He inferred it by the degree in which grid emission increased over time.
Interestingly, if you are correct and BaO is the dominant vapour species, he was really measuring that! He just assumed that the grid emission was due to Ba and not something else. He thus assumed that the cathode vapour was Ba and nothing else of significance. Perhaps he had good reason to assume that. Perhaps he didn't.
Just in case anyone thinks there is any reality behind Popilin's parrotings in this thread, despite his inability to logicaly invalidate what I've said:-
The type AV44 diode was once commonly used in AC voltage regulators e.g., "Stabilac" units used for TV studio, photographic studios, and research & development laboratories. This is a directly heated vacuum tube with a pure tungsten filament. It was used with the filament sensing the RMS output voltage via a step down transformer, the anode current (sharply dependent on filament voltage) controlling the output via a power tetrode and magnetic amplifier.
I digitised the anode current (Ia) vs anode voltage (Va) plot from the datasheet and used a curve follower macro in CAD software to produce a list of plot points, at each 0.5V Va increment. I then imported the list into MS-Excel so I could re-plot with both linear and log(Ia)-vs-root(Va) scales. I applied a sliding 5v-wide Hamming window to smooth out digitisation errors.
Here is the log(Ia) vs root(Va) plot:-
.jpg")
I have included a "schottky line" it appears to fit pretty good. But more about that later.
Here is a plot included by Popilin in several of his posts. He claimed it represents a pure tungsten vacuum tube.

We see that Popilin's plot in no way resembles any real pure tungsten tube, and I'm not talking about it apparently taking 2,000,000 mega-amps at 1 kV - presumably a typo.
The first thing we notice is that Popilin's plot has the "schottky line" way way too steep - unbelievably steep. All the pure tungsten types (noise diodes, regulators) I've seen data for have it just about horizontal. For a doubling of voltage, Popilin's schottky line inceases 24% whereas the AV44 line increases only 4%.
The second thing we notice is that Popilin's plot to the left of the transition away from the "schottky line" (ie below about root 36 volts, "6" on the scle provided) is completely wrong and impossible. There ought to be a definite slope starting from the origin, following the V^3/2 Langmuir law out from the origin.
We can conclude that Popilin's plot was drawn up not from measuring a real tube, and also not from any proper calculation for a pure tungsten cathode tube, plotting dots notwithstanding tube. It's a fake. It was obviously drawn up by someone not familiar with tube physics, and definitely by someone who has not worked with such tubes in a laboratory or engineering workshop.
Here is the same AV44 data plotted with linear scales as is usually done:-
.jpg")
We see that:-
1) A straight line is still a good fit to the "schottky line". This will not be surprising to any engineer accustomed to graphing data - A straight line function in linear axes is still a straight line in log-log axes, and over the range used here, there's little difference between a log scale and a root scale.
2) Some ripples in the plot are more visible. It is the nature of log scales to de-emphasize small errors in plotting. These are in the original datasheet and can be assumed to be dafting error arising from the use of a lead-line (People who did tech drawing before computers will know what a lead-line is - a length of Pb between 2 stainless steel flat springs - an alternative to french curves) or lab measurement error - no 5-1/2 digit multimeters existed in 1948.
3) It would be equally valid to assume the "schottky line" is curved slightly, assymptoting to a horizontal line, and is not a sloping straight line. Given the plotting errors as large as they are, you can't actually tell, but there's a hint.
We most likely could tell if the plot was extended to 200V, but unfortunately although the tube is rated to take 200V, the datasheet plot stops at 100 V.
As I posted previously, the slope past the transition point, and the lack of sharpness in the transition from space charge limitted region to the emission limitted region, are both due to practical tube geometry. End effects distort the electric field and cause the transition to be different at different positions along the filament. The saturation current varies because the residual space charge varies.
The filament consists of a single tungsten wire under tension. The practicalities of manufacture mean that it is not exactly centred and parallel on the anode cylinder axis - this also means the electric field is uneven along the filament length - again the saturation varies along the filament length.
The type AV44 diode was once commonly used in AC voltage regulators e.g., "Stabilac" units used for TV studio, photographic studios, and research & development laboratories. This is a directly heated vacuum tube with a pure tungsten filament. It was used with the filament sensing the RMS output voltage via a step down transformer, the anode current (sharply dependent on filament voltage) controlling the output via a power tetrode and magnetic amplifier.
I digitised the anode current (Ia) vs anode voltage (Va) plot from the datasheet and used a curve follower macro in CAD software to produce a list of plot points, at each 0.5V Va increment. I then imported the list into MS-Excel so I could re-plot with both linear and log(Ia)-vs-root(Va) scales. I applied a sliding 5v-wide Hamming window to smooth out digitisation errors.
Here is the log(Ia) vs root(Va) plot:-
I have included a "schottky line" it appears to fit pretty good. But more about that later.
Here is a plot included by Popilin in several of his posts. He claimed it represents a pure tungsten vacuum tube.
We see that Popilin's plot in no way resembles any real pure tungsten tube, and I'm not talking about it apparently taking 2,000,000 mega-amps at 1 kV - presumably a typo.
The first thing we notice is that Popilin's plot has the "schottky line" way way too steep - unbelievably steep. All the pure tungsten types (noise diodes, regulators) I've seen data for have it just about horizontal. For a doubling of voltage, Popilin's schottky line inceases 24% whereas the AV44 line increases only 4%.
The second thing we notice is that Popilin's plot to the left of the transition away from the "schottky line" (ie below about root 36 volts, "6" on the scle provided) is completely wrong and impossible. There ought to be a definite slope starting from the origin, following the V^3/2 Langmuir law out from the origin.
We can conclude that Popilin's plot was drawn up not from measuring a real tube, and also not from any proper calculation for a pure tungsten cathode tube, plotting dots notwithstanding tube. It's a fake. It was obviously drawn up by someone not familiar with tube physics, and definitely by someone who has not worked with such tubes in a laboratory or engineering workshop.
Here is the same AV44 data plotted with linear scales as is usually done:-
We see that:-
1) A straight line is still a good fit to the "schottky line". This will not be surprising to any engineer accustomed to graphing data - A straight line function in linear axes is still a straight line in log-log axes, and over the range used here, there's little difference between a log scale and a root scale.
2) Some ripples in the plot are more visible. It is the nature of log scales to de-emphasize small errors in plotting. These are in the original datasheet and can be assumed to be dafting error arising from the use of a lead-line (People who did tech drawing before computers will know what a lead-line is - a length of Pb between 2 stainless steel flat springs - an alternative to french curves) or lab measurement error - no 5-1/2 digit multimeters existed in 1948.
3) It would be equally valid to assume the "schottky line" is curved slightly, assymptoting to a horizontal line, and is not a sloping straight line. Given the plotting errors as large as they are, you can't actually tell, but there's a hint.
We most likely could tell if the plot was extended to 200V, but unfortunately although the tube is rated to take 200V, the datasheet plot stops at 100 V.
As I posted previously, the slope past the transition point, and the lack of sharpness in the transition from space charge limitted region to the emission limitted region, are both due to practical tube geometry. End effects distort the electric field and cause the transition to be different at different positions along the filament. The saturation current varies because the residual space charge varies.
The filament consists of a single tungsten wire under tension. The practicalities of manufacture mean that it is not exactly centred and parallel on the anode cylinder axis - this also means the electric field is uneven along the filament length - again the saturation varies along the filament length.
Last edited:
Here for completeness is Popilin's alleged tungsten cathode tube re-plotted with linear scales:-

The schottky line, which was pretty steep, is thus now seen to be very slightly curved.
The pre-transition region (below 6V) is even now still clearly seen to be nothing like the normal three-halve power law increase from zero anode volts. A practical tube with a saturation point at only 6V would be pretty remarkable anyway, let alone one that can take 1 kV on the anode.
If you are checking that individual points match up with Popilin's plot, please take into account that the horizontal axis in Popilin's version is not an accurate square root progression - the "20" mark is slightly to the right of where it should be for some reason (drawn up "feehand" with MS-Paint or similar and not plotted from a calculation?). But the schottky line in Popilin's version is ruler straight.
Hmmm, and does not BaO hydrolyse in air to form the hydroxide due to normal moisture? Chemistry is hard........😕Presumably you mean the oxidation of surface barium.
- Status
- Not open for further replies.
- Home
- Amplifiers
- Tubes / Valves
- Why Gold Grids