Hi andrea_mori,
My 2015 TWTMC has not been built, but the new clock looks really fantastic!
As I missed the group buy, I would like to know if there are PCB and SC Cut Xtal still available for building a TWTMC-DRIXO at 22.5792 MHz?
Thx.
My 2015 TWTMC has not been built, but the new clock looks really fantastic!
As I missed the group buy, I would like to know if there are PCB and SC Cut Xtal still available for building a TWTMC-DRIXO at 22.5792 MHz?
Thx.
I suggest rfsupplier, you can get custom cables at affordable prices
Custom Cable Assemblies | No Minimum Order
Cables arrived today. Exactly 30 days from order shipped to Canada. Really nice custom length RG400 cables. Great price.
I would like to report about my result..
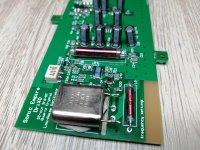
I had received from Andrea my kit. Obviously I had to assemble the DriXo 5,6448MHz oscillator, like the most interesting and challenging for my test setup, which is the fantastic project of Andrew Holme PhaseNoise
Some quick photos:
I had received from Andrea my kit. Obviously I had to assemble the DriXo 5,6448MHz oscillator, like the most interesting and challenging for my test setup, which is the fantastic project of Andrew Holme PhaseNoise
Some quick photos:
Attachments


I would love to see your Holme analyzer.
Demian, we can talk about it, I would be happy
So, now to the measurement: I would copy here what I had just written in the other thread:
""
Now, obviously the problems mentioned here, about thermal stability (non existent..) of an SC-cut crystal out of it's flex zone - are real. There is a constant, slow drift during operation. This drift is worse for a measurement - a typical phase noise setup works with cross-correlation, long averaging, - it definitely works out better if the signal is not drifting too much.
Then, there is a difference between how instruments deal with it. In the Timepod, visibly it had been better elaborated this part, probably the FFT's are longer, less bin with in the lower segments..
The Holme setup had been more concentrated on high quality, ovenized crystals, so less attention had been given this type of slowly drifting carrier.
In a sense, reassuming in a word. my measurement is more 'exposed', or sensitive to this problem, and it shows.
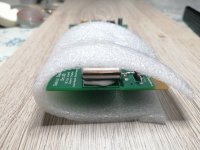
Obviously I had wrapped the oscillator in some layer of bubble wrap. Not more has been done, apart from the long waiting for thermal stabilization.
""
ok, so here it is:
""
Now, obviously the problems mentioned here, about thermal stability (non existent..) of an SC-cut crystal out of it's flex zone - are real. There is a constant, slow drift during operation. This drift is worse for a measurement - a typical phase noise setup works with cross-correlation, long averaging, - it definitely works out better if the signal is not drifting too much.
Then, there is a difference between how instruments deal with it. In the Timepod, visibly it had been better elaborated this part, probably the FFT's are longer, less bin with in the lower segments..
The Holme setup had been more concentrated on high quality, ovenized crystals, so less attention had been given this type of slowly drifting carrier.
In a sense, reassuming in a word. my measurement is more 'exposed', or sensitive to this problem, and it shows.
Obviously I had wrapped the oscillator in some layer of bubble wrap. Not more has been done, apart from the long waiting for thermal stabilization.
""
ok, so here it is:
Attachments

What is shown in those two images? E.g., did you take those measurements (first looks like Andrea's other plots and file naming), what was used to take the measurements, and what are the two plots in the second picture?
-Bryan
-Bryan
Dear Bryan,
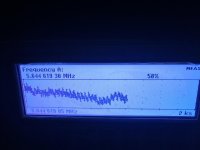
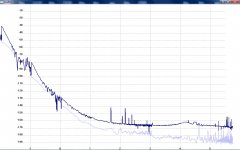
Yes, pardon, I did not explain that: Andrea had sent me the kit with the Xtal measured by him, on his own setup (TimePod 5330A) That is the first graph.
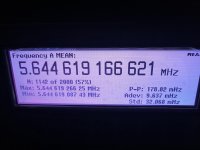
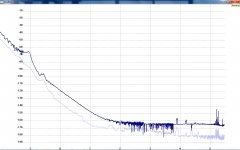
The second graph is made by me, after assembly, burn in etc, by my own test setup, which is the above mentioned Andrew Holme designed Phase Noise analyser project.
The Xtal in my board is exactly the same one that had been previously measured by Andrea, first graph.
In my measurement the horizontal axis needs a bit of explanation: the numbers are the exponent in the expression of power of 10;
Thus the graph starts with 10^-1, that is, 0,1Hz.
Then 1Hz(0), 10Hz(1),100Hz(2), etc.
These two graphs presented together are intended to be a confirmation, that Andrea's measurements are repeatable.. They are similar, with slight differences, that I could explain happily, upon request.
Yes, pardon, I did not explain that: Andrea had sent me the kit with the Xtal measured by him, on his own setup (TimePod 5330A) That is the first graph.
The second graph is made by me, after assembly, burn in etc, by my own test setup, which is the above mentioned Andrew Holme designed Phase Noise analyser project.
The Xtal in my board is exactly the same one that had been previously measured by Andrea, first graph.
In my measurement the horizontal axis needs a bit of explanation: the numbers are the exponent in the expression of power of 10;
Thus the graph starts with 10^-1, that is, 0,1Hz.
Then 1Hz(0), 10Hz(1),100Hz(2), etc.
These two graphs presented together are intended to be a confirmation, that Andrea's measurements are repeatable.. They are similar, with slight differences, that I could explain happily, upon request.
Last edited:
What are the two plots in the second image? Based on the Holme setup description (here: Direct digital phase noise measurement), I presume the lower one is the reference oscillator and the upper one is the DriXO, correct? Also, what did you use for the reference oscillator?
-Bryan
-Bryan
Ah, You see.. one gets used to things that I did not even notice.
In the second image, there are two traces, plots. The upper, dark blue plot is the measurement of the Drixo 5,6448 MHz oscillator.
The light blue trace is showing the measurement floor, which depends on the instrument, but also the time spent in cross correlation.
The more distant is the instrumental floor from the actual plot of the DUT, the measurement more clearly characterize the DUT itself
Last edited:
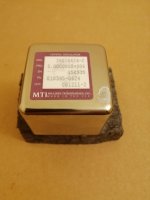
The references are two, selected MTI260-0624-C OCXO-s from Milliren Technologies.
I have selected the better measuring ones as References. See plot, one of these.
I have selected the better measuring ones as References. See plot, one of these.
Attachments
There is no real constraint.. Reference phase noise will be multiplied up, when comparing to a higher frequency DUT.. Sometimes a higher frequency Reference can be useful, so it's own noise gets less multiplied.
@ Joseph
Nice work Joseph !
"They are similar, with slight differences, that I could explain happily, upon request."
ok, it seems, when I read correctly, that your measurement is consistently 10dB better on the 0,1Hz to 100Hz points.
why would that be?
Nice work Joseph !
"They are similar, with slight differences, that I could explain happily, upon request."
ok, it seems, when I read correctly, that your measurement is consistently 10dB better on the 0,1Hz to 100Hz points.
why would that be?
Because in the meantime the crystal has matured and therefore it has been mechanically stabilized, with positive effects on its random walk.
Then there is the measurement time.
To get truly reliable results in the 1/f3 region measurements of several hours are required (8 or more).
Then there is the measurement time.
To get truly reliable results in the 1/f3 region measurements of several hours are required (8 or more).
Last edited:
Off Topic mode on
, for those loving the TDA1541A, Pedja Rogic on Audial is making an interest poll to a new launch of his DIY AYA board with embeded USB to simultaneous mode.
It uses two Crystek crystal and the board has air (area has space) and imo the Andrea's adaptator can be easily soldered instead Crysteks cans. There are also direct uf-l pads to pass through the USB stage for those wanting to feed directly the dac chip with I2S or simultaneous pcbs of their choice (SD trans card player, DIYs, JLSounds USB, etc)
off topic : mode off
Last edited:
- Status
- Not open for further replies.
- Home
- Source & Line
- Digital Line Level
- The Well Tempered Master Clock - Building a low phase noise/jitter crystal oscillator