My local electronics surplus store was open for business this week, without the silly 1 customer in store at a time limitation. They have had these LED heatsinks for a while, and I finally realized a good use for them.
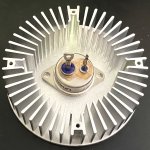
The plan would be to use these as heat spreaders / extra dissipation for the hockey pucks, and attach the remaining TO-247 packages directly to the main channel sinks. The LED heatsinks have a nice smooth surface on the back side which will make a good thermal interface to the main sinks.
The plan would be to use these as heat spreaders / extra dissipation for the hockey pucks, and attach the remaining TO-247 packages directly to the main channel sinks. The LED heatsinks have a nice smooth surface on the back side which will make a good thermal interface to the main sinks.
Attachments
What do your ears say?
We need to put a knob on that and dial it left or right!
Rush
My local electronics surplus store was open for business this week, without the silly 1 customer in store at a time limitation. They have had these LED heatsinks for a while, and I finally realized a good use for them.
Interesting. Do you have a parts number?
(PS: The front side does not look very smooth, doesn't it matter?)
Last edited:
Unfortunately no part number. This is surplus. There may have been something on the box, but I didn’t make a note. They were only $4.95 each, and I bought four of them.
I have a set of Arctic thermal interface sheets. These and the large surface area should work Ok.
I have a set of Arctic thermal interface sheets. These and the large surface area should work Ok.
Last edited:
What do your ears say?
My ears say that the amp sounds different with different load values,
causing it to traverse a different load line, and we should be seeing this
on distortion analysis. A SIT-3 is a fine example, where the lowest
distortion is seen for the region roughly between 4 and 8 ohms.
You can listen for this with a given pair of speakers by putting different
values of resistance in parallel with the load.
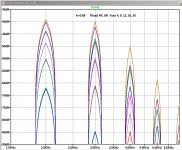
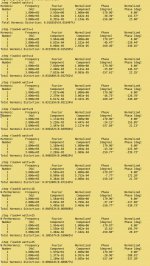
OK. Spinning the magic A-pot to 0.89 is get something that looks pretty good by your criteria. I show the spectra for 4R and 8R loads, with peak output levels of 4V, 8V, 12V, 16V and 20V. The 2nd and 3rd harmonics are nearly identical, and in the fourier data the phase change of H2 between 4R and 8R loads is about 10 degrees at 4V increasing to 45 degrees at 20V. In the spectral plots, the the 4th and higher harmonic are affected by Rload values.
The nice thing about the A-pot is that its adjustment does not affect the bias current Vds of the SIT.
The nice thing about the A-pot is that its adjustment does not affect the bias current Vds of the SIT.
Attachments
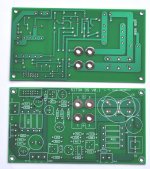
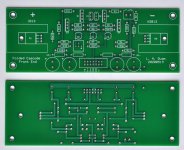
PCBs and parts were ordered today. I have a fair amount of chassis work to do, but I should have the SIT3X up and running within 10 days to 2 weeks.

I just discovered that ExpressPCb now supplies complete Gerber files to my PCB layouts. I am willing to make them available.


indeed also highly interested, just had a very good leftover deal on two Amplimo 2x35v 500VA trafos... might try LT4320 diode bridges if i can find suitable mosfets.
Try IPP040N06N or IPP034NE7N3.
The LT4320 based rectifier should give about 1.2 to 1.5 Volts higher output than the next best conventional bridge rectifier.
The LT4320 based rectifier should give about 1.2 to 1.5 Volts higher output than the next best conventional bridge rectifier.
Thanks will consider themTry IPP040N06N or IPP034NE7N3.
The LT4320 based rectifier should give about 1.2 to 1.5 Volts higher output than the next best conventional bridge rectifier.
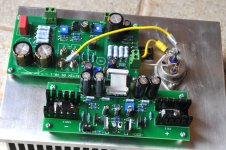
I am still waiting for parts to arrive, but much of the chassis work is complete.
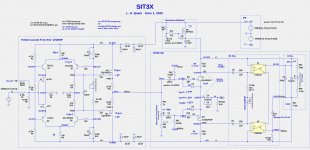
In the meantime, I did some work with the fourier .log data in the LTSpice simulations to display the distortion waveforms at different values for Vout and Rload. Below are the residual waveforms with the magical value of A=0.89, which corresponds to a Schade feedback ratio, R1/R2=A/(1-A), of about 8.09. They look good to me.
In the meantime, I did some work with the fourier .log data in the LTSpice simulations to display the distortion waveforms at different values for Vout and Rload. Below are the residual waveforms with the magical value of A=0.89, which corresponds to a Schade feedback ratio, R1/R2=A/(1-A), of about 8.09. They look good to me.
Attachments
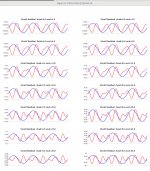
Looks like the residual waveforms I get on my old HP distortion analyzer as the power is increased. Dominant H2, with increasing amounts of H3 as the output is increased. Very well behaved.
And, the residual waveforms appear to be very insensitive to the load resistance for a given input (and output) voltage.

- Home
- Amplifiers
- Pass Labs
- The SIT-3X Amplifier