Sorry for not replying earlier to this post Steph. As I said in an earlier post, I love the idea of achieving 'the optimum' theoretical filter, but what I'd really like to do would be to incorporate the individual driver correction as you suggest in this post. I'm presuming you're thinking of anechoic measurements. If only had access to a chamber! But I am also fascinated by the idea of room correction, so I have my microphone ready anyway.In a nutshell, once digital will pervade diyAudio, there will be obvious choices:
- for sure, the symmetric 6th-order with -20dB preshoot and ringing (DSS-930) (keeping in mind this only may be attainable when crossing at Fs/12)
- maybe, the symmetric 4th-order with -40dB preshoot and ringing (Gaussian-centric) (keeping in mind this may only be attainable when crossing at Fs/18 - just an idea)
- for sure, the symmetric 2nd-order with no preshoot and ringing (pure Gaussian) (keeping in mind this may be attainable for any crossover frequency)
and some assymetric design perhaps, as curiosities.
No doubt they will replace the Linkwitz-Riley arrangements. Everywhere, when digital is at work.
Listening to the pure Gaussian crossover at 4kHz right now. Sounds beautiful, and it's good to know it's absolutely optimum in one way at least (but if I listen to the drivers in isolation, I can clearly hear a little bit of 'contamination' not that that worries me unduly).
Edit: and at last I can hear 'phasing' as I move 'off-axis', but it's no problem in practice.
Last edited:
Quite important is to ensure that we are speaking the same language. I went reviewing the graphs and I like them.
The graphs may deliver more info if you draw them slightly differently. Keep the impulse response as they are. Only modify the amplitude graphs. Graph the amplitudes using a vertical log scale, always the same, top +10 dB and bottom -50 dB. Graph the frequencies using a horizontal log scale, always the same, left 100 Hz and right 10 kHz.
Doing so you will better perceive the differences between the Gaussian ones (featuring asymmetric slopes but no preshoot and no ringing) and the Sinus Cardinal ones (featuring symmetric slopes but preshoot and ringing).
What are "order 4.00" and "Q 0.50"?
With the FIR length you are using, no doubt you'll get nice results, this including the drivers corrections.
Don't be afraid doing measurements in your living room. Make sure you have a soft floor (carpet), make sure you have chairs and sofas in the angles. Close the curtains, and your measurements will be far from ridiculous especially if you put the measuring mike at a distance of 0.5 meter instead of 1.0 meter.
Now it is time to confront theory with practice.
Could you download Spectra Lab 4.32? Do you understand the wiring of the two measuring channels? Is your measurement mike using the right Panasonic electret cartridge? John Conover: Using the Panasonic WM61A as a Measurement Microphone
Personally, I prefear adding a BC549 common emitter stage with a 4.5V supply (Re=220 ohm undecoupled, Rc=2.2K, automatic collector-base polarization using 220K or so) providing 20 dB of gain, and hooking it on the line input of the PC card.
I guess it will be a piece of cake for you to compute the unfiltered driver impulse responses from the Bode plots (gain and phase), then generate the linearization FIR. Need to add digital pre-filters with well known behavior for not overloading the driver when testing the linearization. The woofer won't appreciate being driven with a +15 dB boost above 15 kHz. You thus need a 4 kHz Butterworth lowpass pre-filter for the woofer. You need a 1 kHz Butterworth highpass pre-filter for the tweeter, as it won't survive being fed with a +40 dB boost at 100 Hz. Need to ensure that no digital saturation occurs. 2nd-order IIR BiQuads seem well suited for the pre-filters. You can design them easily using IIR_Lab.
and at last I can hear 'phasing' as I move 'off-axis', but it's no problem in practice.
Just to clarify what I mean by this: it may be my imagination (hearing what I expect to hear), but I think I can hear mild 'combing' as I move rapidly vertically in relation to the speaker when using any shallow crossover - say 2nd or 4th order. If it's real, I presume it is phase cancellation and addition of the same frequency components being produced by both drive units simultaneously and the relative path length changing. I can't hear it when I'm stationary, only when moving, and trying to induce the effect deliberately.
This is what I was talking about at the start of the thread, where I was disappointed if anything, that I could hear no change while dynamically changing the crossover steepness. However, I was using a linear ramp type of crossover, and even at the widest setting, it was something like the equivalent of a 16th-32nd order conventional filter. If the combing effect is not really anything to worry about in practice, then the need for a steep crossover boils down to avoiding unsuitable frequency components reaching each driver, presumably.
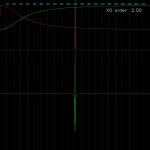
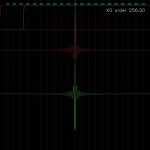
OK, here's something remarkable (I think). I've modified my active crossover program to allow me to switch instantaneously between extremes of crossover steepness while listening. I can go between 2nd order and 256th with a keypress. Just to recap: I'm using a two way speaker (Mission 702e) and I've set the crossover frequency to 3.5 kHz.
The result with music in a real room is virtually no audible difference whatsoever! I can't even hear any difference when moving in relation to the speakers. If I listen to woofers or tweeters only, then the effect is extreme, with the 256th order sounding appalling. However, the drivers combined results in almost perfect acoustic cancellation of the high order filtering artefacts. I really wouldn't have believed it was possible.
Here are the two screenshots showing the linear frequency responses and zoomed in impulse responses (apologies for the random-ish layout of the screen).
What I take away from this is that, in practice, crossover steepness within reasonable limits is not critical, but I'm happy to be contradicted...
Attachments
If you don't hear any difference there can be a few (additive) causes like 1) not using a pink noise as test tone, 2) a serious hearing impairment, 3) your woofer exhibits a perfectly linear amplitude curve, without any resonance above the crossover frequency, 4) a software bug. Remember that "seeing is believing". Have you done measurements using a mike and SpectraLab 4.32? Question 1 : do you hear a difference when inverting the tweeter phase (please add the corresponding software control)?. Question 2 : do you experiment using one speaker (mono), or two speakers (stereo)? One recommendation : when graphing the Bode Plot, make sure your software application uses the same settings as SpectraLab 4.32 (log amplitude axis, and log frequency axis).The result with music in a real room is virtually no audible difference whatsoever! I can't even hear any difference when moving in relation to the speakers.Here are the two screenshots showing the linear frequency responses and zoomed in impulse responses. What I take away from this is that, in practice, crossover steepness within reasonable limits is not critical, but I'm happy to be contradicted.
Last edited:
If you don't hear any difference there can be a few (additive) causes like 1) not using a pink noise as test tone, 2) a serious hearing impairment, 3) your woofer exhibits a perfectly linear amplitude curve, without any resonance above the crossover frequency, 4) a software bug. Remember that "seeing is believing". Have you done measurements using a mike and SpectraLab 4.32? Question 1 : do you hear a difference when inverting the tweeter phase (please add the corresponding software control)?. Question 2 : do you experiment using one speaker (mono), or two speakers (stereo)? One recommendation : when graphing the Bode Plot, make sure your software application uses the same settings as SpectraLab 4.32 (log amplitude axis, and log frequency axis).
Hi steph
With pink noise I hear a clear difference as the low pass filter order, and its complementary high pass, is increased (I can progressively do this in real time). But my post above concerns the effect with real music (in stereo), where it really is remarkable how gross effects on each individual driver cancel out acoustically when combined. I'm not suggesting I will listen to music at order 256, but I wouldn't feel too terrible about 16th order filters, for example. On the other hand, I like the idea of the pure Gaussian, too. It's just that I wouldn't like to bet anything that I could discern the difference between them on real music.
I will take up some of your suggestions for more rigorous testing and report back.
I hadn't been too bothered about the 'GUI' aspect, but I will obviously have to provide options for lin and log axes etc. I intend to provide sliders for cutoff frequency and filter order, and maybe a few preset buttons etc. But that's the fun part.
Earlier in this thread, Mark Clappers linked to this paper:
http://www.acoustics.hut.fi/~mak/PUB/JAES_V57_6_PG413.pdf
The authors conclude:
The experiments and analyses described show that the
perception of sound degradations due to crossover filters
is complicated. While magnitude and group delay errors
exhibit fairly good correlations to perceived degradations
in systems with classical crossovers, high-order FIR filters
behave differently and require an advanced approach
based on auditory (perceptual) modeling.
In this study we have demonstrated that simple auditory
modeling can qualitatively reveal how the ringing phenomenon
causes degradation in very high-order crossover
filters. It remains to be investigated whether a more advanced
auditory model can predict subjective test results
also quantitatively, possibly combining the magnitude,
group delay, and spreading type of degradations in a single
model. This remains a challenge to future research.
For digital crossover design we can draw the conclusion
that L–R filter orders up to about 8 should be safe in
most cases, whereas for FIR filters it is possible to go up
to about 600 without problems. Of course the safety limits
depend on many factors. For example, in the case of
coaxial loudspeakers the delay between driver elements
does not vary much with the listening angle, so higher
filter orders are possible. In general, going to the safety
limit of a filter order may not be well recommended.
We shall thus enter the weird area of cognitive amplification. There are lots of people disagreeing about cognitive amplification. Me too, some time ago. Until I built a system mainly basing on objective measurements relying on SpectraLab 4.32 acting as interactive development tool.With pink noise I hear a clear difference as the low pass filter order, and its complementary high pass, is increased (I can progressively do this in real time). But my post above concerns the effect with real music (in stereo), where it really is remarkable how gross effects on each individual driver cancel out acoustically when combined.
After some time playing with SpectraLab, I concentrated on two particular areas, where both my eyes and my ears could deliver useful information. First thing to do : send a pink noise, and both with your eyes (watch the SpectraLab Bode plot, gain and phase) and with your ears (hunting any audible annoying resonance or dip), determine the useful midbass bandwidth on-axis and off-axis, from a 0 degree to 45 degree angular shift.
Set the crossover frequency as the frequency where you visually see the midbass driver delivering the same spectrum from 0 degree to 45 degree off-axis.
Second thing to do is to determine if some simple equalization can get the midbass driver behaving like a gentle 4th-order Bessel lowpass, as preliminary target. Without bumps, dips and resonance. Pay attention to the phase curve. This is why Bessel is chosen, as preliminary target. If the phase curve looks random from 200 Hz to twice the planned crossover frequency, reject such midbass driver. Use another one. Or modify it, replacing the dust cover by a soft one, or replacing the dust cover by a phase plug (ogive in french).
Very important is to get the midbass driver exhibiting a stable, predictable, uncomplicated behavior, in gain and in phase, until twice the planned crossover frequency.
When you are done with this, you can drop the 4th-order Bessel preliminary target, and start thinking about designing a real crossover the way you want it, analog Linkwitz-Riley, or anything else including linear-phase digital FIR. Doing so, you need to implement the required midbass equalization, or preferably, operate the required fusion with the equalization function and the crossover function. Be warned that in the horizontal portion of the spectrum, your ears are more sensitive than any SpectraLab graphics. In the horizontal portion of the spectrum, you shall use your ears for the fine +/- 2dB tuning.
Select a tweeter able to handle the crossover frequency, and highpass filter it according the crossover strategy you want. You may want to equalize it. Same job as above.
Comes the question about your measuring mike : is it to be trusted above 12 kHz or not? You better use a Panasonic WM61A electret capsule.
If you don't obey such methodology, it is absolutely normal that you don't hear any difference between all your crossovers setups, while listening to music. All your setups fall below a certain qualitative threshold allowing the cognitive amplification to take place.
The day you will reach that threshold, you'll get a system inputting audio data to your brain, audio data that's formatted in a correct way for allowing the cognitive amplification to take place.
That day, you will find yourself having listened to music for a couple of minutes, with plenty of more-than-music images flooding your brain like "seeing" the singer smiling, like "seeing" the brass, etc ...
That day, listening to a singer, you will be able to tell the distance between the singer and the mike, and detect inconsistencies between the singer voice, and the accompanying music.
That day, reading the name of the sound engineer on the CD jacket, you'll know by advance if you are going to encounter those sorts of issues.
That day, you may start disliking some CDs that you used to love because of delivering a spectacular sound.
Such is the big misunderstanding about cognitive amplification.
Once you have such system installed at home, you realize day after day, week after week, that it puts you on such "good mood" quite often. Honestly, objectively, it doesn't sound better. But quite frequently, it delivers listening sessions allowing your brain to execute some pleasant auto-suggestive job.
Once you have such system installed at home, you ask yourself how possibly an audio system can deliver listening fatigue, while yours, day after day and week after week, delivers listening pleasure.
You shall reject all crossovers exhibiting a less than 3rd-order acoustic highpass for the tweeter. They don't isolate the tweeter properly from the bass content, as the unfiltered tweeter already exhibits a 2nd-order highpass. At high listening volumes, the tweeter may exceed the maximum Xmax. At medium listening volumes, the bass current flowing into the tweeter coil will cause a long-term magnetic flux modulation (thermal effect on the magnet). Even at low listening volumes, the bass current flowing into the tweeter coil may cause a short-term magnetic flux modulation (the instantaneous bass current).
However, you may find speakers doing very well, basing on a pseudo 1st-order crossover, analog. Like doing the crossover at 4 kHz when the tweeter has a natural highpass at 800 Hz or so. If you apply a compact MTM (d'Appolito) with correct time-alignment, their relative phase shifts effects get minimized. Doing the crossover at 4 KHz means that you need a midbass driver remining consistent at 8 kHz. Diameter won't exceed 10 cm. Such MTM is thus compact, and does very well if not operated at high listening volumes. Try building one and use it as reference, comparing it to more elaborate crossovers.
Last edited:
That's about what I'd expect, under the circumstances. The tweeter and the woofer on the Mission are physically aligned in the vertical axis (probably acoustically aligned, too, or nearly so) so the acoustic cancellation of the out-of-phase ringing should be nearly perfect for all reasonable horizontal angles. It would be interesting to see if you can hear differences as the vertical angle is varied (or perhaps lay the speakers on their sides and vary the horizontal angle).The result with music in a real room is virtually no audible difference whatsoever! I can't even hear any difference when moving in relation to the speakers. If I listen to woofers or tweeters only, then the effect is extreme, with the 256th order sounding appalling. However, the drivers combined results in almost perfect acoustic cancellation of the high order filtering artefacts. I really wouldn't have believed it was possible.
I would also be interested in your subjective impressions of the sonic differences between the subtractive-delay crossovers (whatever order you like) and classical crossovers like Linkwitz-Riley. (I have done this experiment myself, and I have my own opinions, but I won't contaminate your impression.)
Agree, with the caveat that things might change in situations where the drivers are not aligned.What I take away from this is that, in practice, crossover steepness within reasonable limits is not critical, but I'm happy to be contradicted...
Sorry for becoming off-topic. I just realized that Berchin 1999 publication combined to your WinXP-based FIR approach and barebones framework enable building a very high quality system, albeit limited to moderate listening levels. Can I suggest creating a dedicated thread on diyAudio? Here is the actual design I'm suggesting.However, you may find speakers doing very well, basing on a pseudo 1st-order crossover, analog. Like doing the crossover at 4 kHz when the tweeter has a natural highpass at 800 Hz or so. If you apply a compact MTM (d'Appolito) with correct time-alignment, their relative phase shifts effects get minimized. Doing the crossover at 4 KHz means that you need a midbass driver remining consistent at 8 kHz. Diameter won't exceed 10 cm. Such MTM is thus compact, and does very well if not operated at high listening volumes. Try building one and use it as reference, comparing it to more elaborate crossovers.
For the deep bass range, let us keep it simple. Let us buy two amplified subwoofers Yamaha YST-SW012 delivering 35 Hz to 120 Hz -3dB. One for the left channel, the other for the right channel. From pixmania.co.uk
The advantage of the Yamaha YST-SW012 is that they remain inexpensive, so you can buy two of them, one for the left channel, and one for the right channel. You end up with a reassuring, symmetric stereo setup.
The disadvantage of the Yamaha YST-SW012 is that they rely on bass-reflex which means that depending on their placement in your room, the bass reflex port may blend poorly with the built-in speaker and with the MTM satellite. The final result may thus be random.
A better bass range blend is possible when relying on more costly subwoofers behaving like single-point sound sources, like a closed box (requiring an extreme long Xmax driver and a very tight, perfectly closed box), a 4th-order dual chamber subwoofer (most of the time unable to go above 150 Hz), or a 8th-order triple chamber subwoofer (aka Bose patent - most of the time unable to go above 120 Hz).
So, anyway, measure the Gain and the Phase of such Yamaha subwoofer.
Design a FIR exactly complementing it, to be used as acoustic target for an inexpensive, compact MTM satellite. The beauty is that you have no choice anymore about the crossover highpass order, slope, etc. The ugly is that you end-up with a pseudo 1st-order highpass for the MTM satellite. It will thus only work at very low listening levels, and there will be massive relative phase shifts between the Yamaha subwoofer and the MTM satellite.
Refine the crossover for allowing the MTM satellite to become a pure Gaussian-derived highpass, 12db/octave as described by Berchin in 1999. This provides some minimal protection against the bass, for the MTM satellite.
Compute the lowpass FIR feeding the Yamaha subwoofer, for getting the Yamaha subwoofer acting as a pure Gaussian lowpass. Embed the required equalization function in the crossover, as the Yamaha subwoofer exhibits a natural lowpass transfer function. This is going to be a quite long FIR (low crossover frequency, say 150 Hz), but that's not an issue using a PC as DSP. If needed, the FFT then inverse FFT trick can be applied.
Compute the Gaussian-derived highpass FIR feeding the MTM satellite. The MTM box shall be a closed box. This way the MTM satellite natural highpass is a 12dB/octave highpass. Embed the required equalization function in the crossover.
The MTM satellite shall remain inexpensive, designed for moderate listening levels. This enables a pure Gaussian FIR approach (Berchin 1999) at something like 4 kHz, between the midbass and the tweeter.
What speaker drivers to use for the MTM satellite ?
Midbass:
Two 8 cm midbass FR88EX from toutlehautparleur.com or from madisoundspeakerstore.com
Extended frequency response.
Decent xMax.
Two drivers in a MTM arrangement shall be sufficient for moderate (domestic) listening levels.
Tweeter:
One 20mm tweeter DAYTON from ebay.de or from parts-express.com
Those are two variants of a same structure. The small sizes enable a very compact MTM arrangement, better emulating a point-source. Need to remember that at 4 KHz (the crossover frequency), the wavelenght is only 85 mm. This add to the requirement of having a very compact MTM layout.
The resulting quality will be quite rewarding, even relying on LM3886 ICs for the four power amplifiers in a stereo setup.
CopperTop, perhaps I missed the explanation in an earlier post, but exactly what do you mean by "2nd order" and "256th order" in a FIR context? Do you mean that "2nd order" is a true Gaussian (exp[-x^2]), and if so, does that mean that "256th order" is (exp[-x^256])? Or is it something else? It certainly doesn't look like "2nd order" is a 2-tap FIR filter.I can go between 2nd order and 256th with a keypress.
CopperTop, perhaps I missed the explanation in an earlier post, but exactly what do you mean by "2nd order" and "256th order" in a FIR context? Do you mean that "2nd order" is a true Gaussian (exp[-x^2]), and if so, does that mean that "256th order" is (exp[-x^256])? Or is it something else? It certainly doesn't look like "2nd order" is a 2-tap FIR filter.
Perhaps I'm making a fundamental error, but I'm keeping the FFT size the same and computing what I think is the frequency response for an nth order filter and filling in my FFT array with that (real values only for linear phase). I then do the inverse FFT to get the impulse response, and window it. I do the forward FFT again and this becomes my filter ready to convolve with the incoming audio. I also plot the frequency response after windowing as confirmation.
This allows me to change the response very easily in real time without worrying about glitches and discontinuities.
The formula I'm using is simply lifted from this (assuming I've filled in the '^'s correctly):
...low pass filter with amplitude response given as
____________
|LP| = 1/√((1-f^n)^2 + f^n/Q^2) (1)
where f is frequency normalized by the crossover frequency, f = ω/ωc. This expression yields an amplitude response with an nth order roll off and a response with magnitude
20 Log(Q) at f = 1.0. For n equal to 2 the amplitude given be Eq(1) is consistent with that of any standard 2nd order filter, Butterworth, Bessel or Linkwitz/Riley, for example. For n greater than 2 the response is only consistent with symmetric higher order filters. These include Butterworth filters (n even or odd, Q = 0.707) and Linkwitz/Riley filter (n even, Q = 0.5), but not higher order Bessel filters
The high pass filter frequency response is 1 - the LPF response which I'm assuming gives me the desired constant sum from both filters.
Now I may be barking up the wrong tree, but this method has the appeal of allowing me to adjust the 'order' continuously, and I can also adjust the Q in order to simulate the different types of filters mentioned in the text. It certainly looks convincing as I sweep through different values for order and cutoff frequency and observe the resulting impulse responses.
Okay; that results in a matched-delay-subtractive filter, but not a Gaussian-derived matched-delay-subtractive filter. The equation for the frequency response magnitude of a Gaussian lowpass filter is:The formula I'm using is simply lifted from this ...
exp{+[|f/fc|^2]*ln(1/2)},
where |f/fc| means "absolute value". (I hope that I didn't mess that up; I worked it quickly on some scrap paper.) The highpass filter will be 1 minus the lowpass filter.
For higher-order "Gaussian-like" filters of order "N", the lowpass filter is:
exp{+[|f/fc|^N]*ln(1/2)}. Again, the highpass filter will be 1 minus the lowpass filter. I believe that the corresponding highpass filter will have an "Nth-order" slope.
Last edited:
Okay; that results in a matched-delay-subtractive filter, but not a Gaussian-derived matched-delay-subtractive filter.
Excellent. Thanks for that. That gives me even more to play with.
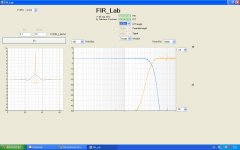
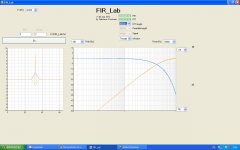
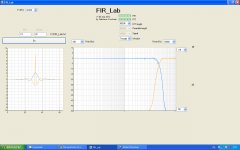
I just wrote FIR_Lab, a Visual Basic program enabling to play with complementary FIRs. See attached .zip file and screenshots. The program automatically writes the FIR coefficients in a FIR_Lab.txt file located on C:\ (rooth).
Attachments
OK, looking at the Gaussian alongside the 'standard' 2nd order filter I can see that it is clearly superior in terms of selectivity. And thanks gberchin for the formula for higher order Gaussian-derived filters.
This brings me to my somewhat hazy grasp of filters! I know that a particular filter order is related to "the slope" in terms of dB/octave. I also know (I think) that an Nth-order filter can only be realised with at least N filter taps in an FIR filter. I also have some inkling that it is related to the highest exponent in the frequency response expression. It may also have something to do with Laplace transforms and transfer functions but I've erased those horrible memories from my brain over the years. The filter order is also related to the number of delay elements in an IIR filter.
What may be confusing to people like me is that filters of the same cutoff frequency and order (and therefore apparently by definition the same slope in terms of dB/octave) are not all equal in terms of performance. In frequency response terms how does the filter's order affect the possibilities for what happens in the passband? Given an arbitrary frequency response (or transfer function), you could find an Nth order polynomial that fitted, but the term to the power of N might be very small. You might also find a <Nth order polynomial that fitted almost as well. Would this filter be usefully defined as Nth order, or something else? Presumably the definition depends on how accurately you implement the filter..?
And then there's the relationship between digital filters and analogue. I was tremendously excited when I found that I could create a filter with any frequency and phase response I wanted, even linear phase, using the FFT and windowing. Why, then, I thought, would anyone want to emulate analogue filters? I'm still wondering about that. People seem to stick with integer even values for the order, and they still talk about Butterworth, Bessel etc. What is the relationship between analogue filtering, and digital FIR filtering? Are analogue filter responses in some way fundamentally good and pure, and therefore it is natural that they are emulated digitally by most people, or are people simply sticking with what they know? That is, if digital FIR filters had been practical all along, would we still have come up with Butterworth, Bessel etc. before messing about with anything else?
I like the idea of the Gaussian filter. But to make a Gaussian-derived Nth order filter, you simply replace '2' with 'N'. It seems kind of arbitrary, somehow. Is it inevitable that the Gaussian-derived higher order filter will inherit a proportion of the desirable characteristics of the pure Gaussian?
Thanks!
Last edited:
I just wrote FIR_Lab, a Visual Basic program enabling to play with complementary FIRs. See attached .zip file and screenshots. The program automatically writes the FIR coefficients in a FIR_Lab.txt file located on C:\ (rooth).
I like it.
Is the slight 'fur' on the frequency response curves because you are defining the windowed impulse response first, then taking the FFT, rather than the way I've been doing it i.e. defining the frequency response then calculating the impulse response from that? Presumably my impulse responses also have tiny deviations from the ideal, but they don't show up so well.
(A whole bunch of filter questions omitted -- I'm in a rush and cannot give the answer the attention it's due at the moment.)
To be clear, only a Gaussian (exp[-x^2]) is a Gaussian. Higher-order filters of the same form (exp[-|x|^N]) are not Gaussian, and that is why I have been very careful to call them "Gaussian-like". They do not share the optimal characteristics of a true Gaussian.I like the idea of the Gaussian filter. But to make a Gaussian-derived Nth order filter, you simply replace '2' with 'N'. It seems kind of arbitrary, somehow. Is it inevitable that the Gaussian-derived higher order filter will inherit a proportion of the desirable characteristics of the pure Gaussian? Thanks!
I'll try to address the filter questions later.
Yes that's it. If you select the longest FFT (65536 samples) on FIR_Lab, the "fur" gets negligible. As I wrote the program in a hurry, some "fur" may be caused by boundary issues in the FFT buffer management. The longest the FFT, the more those boundary issues get diluted.Is the slight 'fur' on the frequency response curves because you are defining the windowed impulse response first, then taking the FFT, rather than the way I've been doing it i.e. defining the frequency response then calculating the impulse response from that? Presumably my impulse responses also have tiny deviations from the ideal, but they don't show up so well.
I intend to refine FIR_Lab, carefully managing the FFT buffer in function of the FIR length for guaranteeing there are no boundary discontinuities.
I intend to refine FIR_Lab, allowing combining up to three different impulse responses:
1- Sinc (width as parameter), eventually replaced by rectangular as bypass
2- Gauss (width as parameter), eventually replaced by rectangular as bypass
3- Windowing like rectangular, or triangular, etc ..
This way you can isolate and understand the spectral properties and effects of each of the 1-2-3 components.
I intend to refine FIR_Lab, allowing to vary the FIR length.
...three different impulse responses:
1- Sinc (width as parameter), eventually replaced by rectangular as bypass
2- Gauss (width as parameter), eventually replaced by rectangular as bypass
3- Windowing like rectangular, or triangular, etc ..
Does this mean that you are not adjusting the order as such? I'm thinking that varying the width adjusts the resulting filter's cutoff frequency, but doesn't change the order. Sinc is presumably the equivalent of a brick wall filter i.e. infinite order, and the pure Gaussian is 2nd order..? (but I may be misunderstanding how the impulse responses are generated)
In a previous post didn't you mention using iterative numerical processes to attempt to optimise a prototype filter in terms of e.g. overshoot and ringing? Are you not tempted to build something like that into your program? (I'd like to see it working).
I just wrote FIR_Lab, a Visual Basic program enabling to play with complementary FIRs. See attached .zip file and screenshots. The program automatically writes the FIR coefficients in a FIR_Lab.txt file located on C:\ (rooth).
Nice job Steph!
If you allow me to comment on that, I think that the 'fur' you and CuTop were talking about comes actually from the white noise sequence. Such a sequence of finite length can not be perfectly white. Actually, the longer it is, the 'whiter' it is as well. So in other words, there are spikes on your output signal because the spikes were originally present on your input signal.
If you're using a longer fft, then I suppose that you're also using a longer noise sequence with originally less spikes and that's why it looks smoother independently of the fft itself.
- Status
- Not open for further replies.
- Home
- Source & Line
- PC Based
- The importance of crossover steepness