OK, here you go, hot off of the mic.
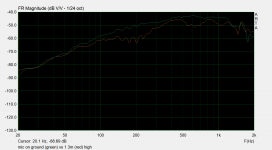
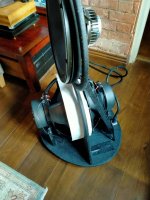
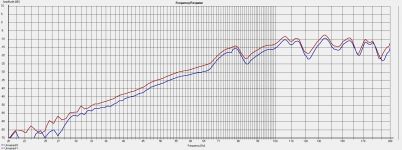
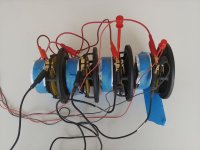
I should have taken a pic of my setup, so let me describe it instead. I used an open "frame" that is about 1.8m tall, 1.5m wide and consists of aluminum u-channel and some wood. Not 100% acoustically transparent but it's what I had on hand. It's left over from a 2019 nude dipole project shown here. I suspended two 15" woofers to hang freely using wire at their balance point. The drivers were arranged face to face. Using the frame the drivers could be separated by no more than a millimeter or two. So I added two 2 foot long bars to the top, and re-hung the drivers by them. I was able to move the drivers outward from the center point of the frame by sliding the hanging points along the bars. Hanging, the driver centers were at about 1m above the ground. I placed a mic at 2m distance at the same height as the driver center. I realized later I should have taken my own advice and placed the mic on the ground! I will show 1 measurement of the difference this made in the region around 200Hz.
There are a series of measurements. Each represents a separation of the drivers, moving one forward and one backwards equally with the mic remaining in the same position. This will have a slight effect on the relative SPL of the front and rear drivers as seen from the mic but I am not going to worry about it at this point. The max separation (as listed in the figure legends, but see below) is about 18 inches.
The legend shows a "separation distance". This was a quick measurement of the separation of the two mounting flanges, center to center. Because the flanges have some thickness, the e.g. "1 inch separation" of the flange centers is really with the face of the flanges only 1mm apart. But actually what might be more relevant is the separation of the acoustic centers, and they are about 2 inches back from the flange on this driver. So to get the separation between the face of the two flanges, subtract 1 inch from the legend value. To get the separation of acoustic centers, add 3 inches to the legend value.
I performed the measurements outdoors in an area I have used before for measurements, using ARTA. I used a long integration time out to 250msec, giving about 4Hz resolution. Unfortunately, on a few measurements a light breeze came up and this is likely the cause for the spread at 20Hz of the data. I averaged 5 measurements. Measurements were 128k points at 96kHz sample rate. I used a calibrated ECM8000 mic and a Focusrite Clarett 2Pre interface. SPL is arbitrary.
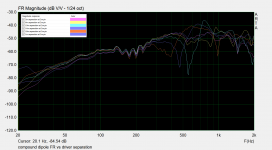
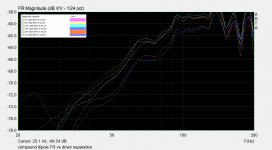
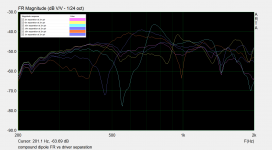
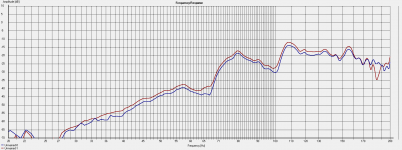
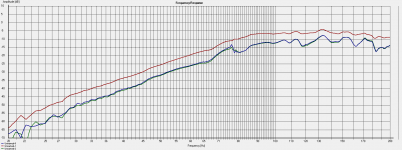
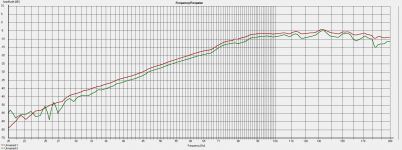
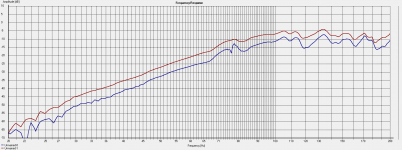
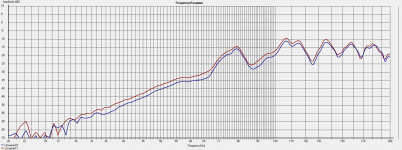
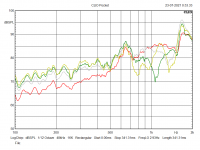
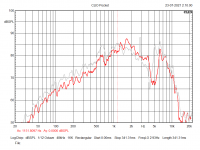
About the plots: Three figures present the same data, just over different frequency ranges and scales, for better readability. The 20-2kHz plot is the full data. There is also a zoom of the 20-200Hz region that shows the LF trend at 2dB per division. Next, the 200-2kHz region shows where a large null appeared in the data and moved lower in frequency with increasing driver spacing. Finally, the plot with two curves only is the same 1in dataset, showing the difference between the mic on the ground and on the stand at ~1m height.
I will comment on the data later after I clean up the test site and equipment.
I should have taken a pic of my setup, so let me describe it instead. I used an open "frame" that is about 1.8m tall, 1.5m wide and consists of aluminum u-channel and some wood. Not 100% acoustically transparent but it's what I had on hand. It's left over from a 2019 nude dipole project shown here. I suspended two 15" woofers to hang freely using wire at their balance point. The drivers were arranged face to face. Using the frame the drivers could be separated by no more than a millimeter or two. So I added two 2 foot long bars to the top, and re-hung the drivers by them. I was able to move the drivers outward from the center point of the frame by sliding the hanging points along the bars. Hanging, the driver centers were at about 1m above the ground. I placed a mic at 2m distance at the same height as the driver center. I realized later I should have taken my own advice and placed the mic on the ground! I will show 1 measurement of the difference this made in the region around 200Hz.
There are a series of measurements. Each represents a separation of the drivers, moving one forward and one backwards equally with the mic remaining in the same position. This will have a slight effect on the relative SPL of the front and rear drivers as seen from the mic but I am not going to worry about it at this point. The max separation (as listed in the figure legends, but see below) is about 18 inches.
The legend shows a "separation distance". This was a quick measurement of the separation of the two mounting flanges, center to center. Because the flanges have some thickness, the e.g. "1 inch separation" of the flange centers is really with the face of the flanges only 1mm apart. But actually what might be more relevant is the separation of the acoustic centers, and they are about 2 inches back from the flange on this driver. So to get the separation between the face of the two flanges, subtract 1 inch from the legend value. To get the separation of acoustic centers, add 3 inches to the legend value.
I performed the measurements outdoors in an area I have used before for measurements, using ARTA. I used a long integration time out to 250msec, giving about 4Hz resolution. Unfortunately, on a few measurements a light breeze came up and this is likely the cause for the spread at 20Hz of the data. I averaged 5 measurements. Measurements were 128k points at 96kHz sample rate. I used a calibrated ECM8000 mic and a Focusrite Clarett 2Pre interface. SPL is arbitrary.
About the plots: Three figures present the same data, just over different frequency ranges and scales, for better readability. The 20-2kHz plot is the full data. There is also a zoom of the 20-200Hz region that shows the LF trend at 2dB per division. Next, the 200-2kHz region shows where a large null appeared in the data and moved lower in frequency with increasing driver spacing. Finally, the plot with two curves only is the same 1in dataset, showing the difference between the mic on the ground and on the stand at ~1m height.
I will comment on the data later after I clean up the test site and equipment.
Attachments

Very interesting to compare your splendid tests and results with cowanaudio's, Charlie. A lot more cone area, and rather similar results. The question seems now to be just how much "gain" we are getting here, at what frequency - and by what mechanism.
Agreed!
This is so interesting - that's a lot of work - both you and Cowanaudio should be thanked for adding to this really interesting audio experiment.
It looks like I may have just been very lucky with my arbitrary 15cm spacers - but I might need to try some different sized ones to maximise the gain...
This is so interesting - that's a lot of work - both you and Cowanaudio should be thanked for adding to this really interesting audio experiment.
It looks like I may have just been very lucky with my arbitrary 15cm spacers - but I might need to try some different sized ones to maximise the gain...
I predict the toilet paper will rustle, not be sucked in and out. Eagerly awaiting your video!
Well sir!!!
I have just done the toilet paper experiment - and...........drum roll.......
You are 100% correct!!!
I am quite, quite wrong😀
So despite my brain having a really hard time getting around the concept of this 'open sided isobaric compound clamshell' thingie, and it seeming mad to me that this 'slug of air' between the drivers isn't doing a lot......
You are right - the tissue paper gently rustled only with a good going 40hz sinewave......
I hope this helps people explain this all more.
PS - it was so unexciting I didn't bother to video it - happy to post a video of non moving toilet paper if anyone is desperate😛
A picture of the exact measured situation would help.... 🙂
...and it seeming mad to me that this 'slug of air' between the drivers isn't doing a lot......
Well, it's being moved back and forth rather effectively, adding a bit of mass to the cones' mass. But interesting that it's behaving like a constrained slug...
As distance between the drivers increases you will get to a point where there is rarefication in front of driver A when it is traveling rearward. The air coming off the back of the driver will go straight around to the front, significantly reducing D. When the driver spacing is small the air from the back of driver A will head around to the back of driver B, a low pressure point. To me it appears this begins to stop happening when the spacing of the drivers is a bit less than their diameter.
thanks for this explanation, makes it clearer to me.
🙂 nice!Ok. Ok. For those who want to see my eminently scientific toilet roll experiment....
An excellent example of the scientific method gone completely bonkers! 😀😀Ok. Ok. For those who want to see my eminently scientific toilet roll experiment....

At least I can reuse the toilet roll, if I had been right it would have been ripped to pieces by the maelstrom air exiting the clamshell😛😛😛
Here are some thoughts about my measurements:
Although not the greatest quality, the measurements I made seem to show a couple of general features:
At LOW FREQUENCIES (150Hz and below): For very small to no separation between the woofers there is one level of SPL. Of course I also forgot to measure a single driver as a dipole, so let's just call this level 0dB. Looking at the plot that zooms into the frequency range of 20Hz-200Hz these are the lower two traces. These correspond to the "2in separation" (pink, top one in legend) and "1in separation" (purple, bottom one in legend). Then after the separation was increased to "6in separation" (the yellow curve) the SPL jumps up by about 3dB. Further increasing the separation may have added another dB or two, especially at LF.
AT HIGH FREQUENCIES (250Hz to 2kHz): In this region we can see the interplay between the driver separation and frequency causing interferences, since the sources are no longer "acoustically close" at higher frequency. This can be seen pretty well starting at 550Hz -the curves at about -50dB SPL level show a small dip of about 2-3dB. Overall, this dip deepens in the order blue (1in) purple (2in) and yellow(6in). Then the dip moves significantly lower in frequency and becomes much deeper and wider for the curves cyan (10in) purple (14in) and orange (18in). Some of these curves also have another dip feature at higher frequencies, 1kHz and up.
So at LF there seems to be two types of behavior - one level of output with small or no spacing between the drivers, and another higher level of output with at least some amount of driver spacing. As the spacing increases, some interference occurs at higher frequencies, causing a null to form. My guess is that the null with change frequency and possible shape as you move off axis similar to what is observed with a simple dipole. If you only need to use the compound dipole as a subwoofer up to some frequency on the order of 100-200Hz, then the spacing doesn't seem to be a concern and the drivers can actually be spaced quite far apart (e.g. 18 inches).
A widely spaced compound dipole might have the feature that there are two distinct acoustic centers, one at the front and one at the rear, despite the "dipole like" behavior overall. At this crossover frequency to the next higher band, this will help to tilt the axis "up" towards the listener a bit.
so now would this be scaleble?Ok. Ok. For those who want to see my eminently scientific toilet roll experiment....
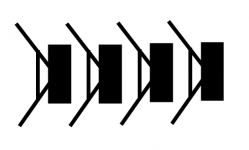
so what if your would do 3 or even 4 drivers?
(without toilet paper ofcourse 🙂 )
so something like this:
Attachments
Last edited by a moderator:
Can't see your image, sorry... I would guess that adding more drivers is doable (sticking to an even order would seem rational) but that the upper frequency limit would become successively lower. The whole contraption would become quite deep also, so it's a swings and roundabouts situation and would ultimately depend on the intended application... 🙂
Some measurements of the effect of an obstruction
The idea here is to try to find a way to show that the front clamshell driver is unlikely to be a strong enough acoustic obstruction to prevent the 6dB addition predicted by the Linkwitz model.
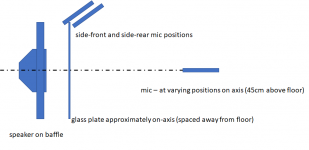
The best I could come up with today is a 14" driver on a ~ 2 foot wide baffle, with an obstruction in the form of a 2 foot square heavy glass plate, there's a sketch plan view in the first figure.
All plots are raw: no gating, no averaging, using Holm Impulse. Mostly it's clear that the upper curve is without the glass plate, the lower one with the plate - at least for the on axis cases. The glass plate, if present, is about 20cm in front of the front rim of the driver.
I will comment mainly on the response below 100Hz.
Starting with the mic 1.8m from the baffle (~1.6m from the glass), the first plot shows a relatively small effect, but not zero, even 3x the width of the obstruction away.
At 1.1m, the gap opens up a little, and a little more at 70cm to typically 3dB (<100Hz). At the closest distance of 30cm, the on-axis difference with or without the plate approaches 6dB.
The next plot compares the 30cm on-axis case with the mic barely behind the edge of the glass a couple of cm from the edge, so shaded from the speaker. This similar this comparison is shown in the lower two curves which are remarkably similar. Moving the front of mic about 4-5cm to sit on the speaker-side of the glass gives the highest curve.
Finally, removing the glass with the mic left in the side-front position, decreases the level. Perhaps that makes sense as the glass is reflecting. The sound that doesn't go behind has to go somewhere.
What's the point?
I expect that a heavy glass plate blocks low-frequency sound at least as effectively as the front clamshell driver. Even then, measuring at a distance of about 3 times the width of the plate shows a relatively small amount of residual shading.
I suspect that the Linkwitz model is a good approximation in the case of the clamshell arrangement (as built), at least when considering the sound a reasonable distance away.
To look into this further, I'd need to make a clamshell, probably a small one, to be able to measure all round. Not today, or tomorrow, perhaps later.
Ken
The idea here is to try to find a way to show that the front clamshell driver is unlikely to be a strong enough acoustic obstruction to prevent the 6dB addition predicted by the Linkwitz model.
The best I could come up with today is a 14" driver on a ~ 2 foot wide baffle, with an obstruction in the form of a 2 foot square heavy glass plate, there's a sketch plan view in the first figure.
All plots are raw: no gating, no averaging, using Holm Impulse. Mostly it's clear that the upper curve is without the glass plate, the lower one with the plate - at least for the on axis cases. The glass plate, if present, is about 20cm in front of the front rim of the driver.
I will comment mainly on the response below 100Hz.
Starting with the mic 1.8m from the baffle (~1.6m from the glass), the first plot shows a relatively small effect, but not zero, even 3x the width of the obstruction away.
At 1.1m, the gap opens up a little, and a little more at 70cm to typically 3dB (<100Hz). At the closest distance of 30cm, the on-axis difference with or without the plate approaches 6dB.
The next plot compares the 30cm on-axis case with the mic barely behind the edge of the glass a couple of cm from the edge, so shaded from the speaker. This similar this comparison is shown in the lower two curves which are remarkably similar. Moving the front of mic about 4-5cm to sit on the speaker-side of the glass gives the highest curve.
Finally, removing the glass with the mic left in the side-front position, decreases the level. Perhaps that makes sense as the glass is reflecting. The sound that doesn't go behind has to go somewhere.
What's the point?
I expect that a heavy glass plate blocks low-frequency sound at least as effectively as the front clamshell driver. Even then, measuring at a distance of about 3 times the width of the plate shows a relatively small amount of residual shading.
I suspect that the Linkwitz model is a good approximation in the case of the clamshell arrangement (as built), at least when considering the sound a reasonable distance away.
To look into this further, I'd need to make a clamshell, probably a small one, to be able to measure all round. Not today, or tomorrow, perhaps later.
Ken
Attachments
Last edited:
Another experiment. This time I measured 1,2,3 then 4 drivers, all with the same 90mm spacing with the front driver facing cone towards the mic, as seen below:

And the results. This time I included the dipole peak from these small drivers. No surprises here.

Note this plot is 5dB/
And the results. This time I included the dipole peak from these small drivers. No surprises here.
Note this plot is 5dB/
Attachments
Last edited:
There was a problem with the image, all should be good now.I can also not see it.
Edit seems to hang... weird
Charlie's plots in post #361 clearly showed a change in the dipole peak frequency that was not evident in my plots. This change in the dipole peak confirms my thoughts on the operation of these compound driver dipoles. I did another experiment with one and two drivers, in a 50mm spaced clamshell.

This shows the change in dipole peak frequency after adding the second driver from 1600Hz to 1200Hz. With the small diameter drivers I am using things quickly fall apart as the drivers are moved further apart, obscuring important detail.
This shows the change in dipole peak frequency after adding the second driver from 1600Hz to 1200Hz. With the small diameter drivers I am using things quickly fall apart as the drivers are moved further apart, obscuring important detail.
Attachments
Last edited:
Bravo cowanaudio! (And bushmeister and Charlie Laub of course.)
These experiments just get more and more interesting. It seems that the addition of the second driver emulates a U-section baffle of roughly the depth of the driver spacing, in some way (as SL was suggesting). But also that adding further drivers merely increases the gain, without affecting the dipole peak frequency. Weird!
Or am I jumping to wrong conclusions here?
- Home
- Loudspeakers
- Multi-Way
- The 'Circles of Doom’... Open baffleless full range speakers