Yes frq is still flat despite the ripple in IR/SR, as can be seen in below distortion plots, but other figures get worse.
That's exactly what I meant, anything taking influence of the signal can ruin the measurement and it's really easy to blame the wrong part of the system (speaker) for the bad measurement result. I don't claim to have the absolute insight of what it actually is but it rings a few bells which might indicate the problem isn't just the drivers, instead maybe the chain introduces some things aswell.
Edit: Sry, probably typed too long. The system becomes quite complex with the filters, probably gating, timing/distances or even the measuring system itself. If something doesn't add up to what you'd expect, it's really worth checking the system or in other words, the complete chain. In the worst case you only confirm the bad measurements but in the best case you learn a lot about the measuring or the drivers or the complete system.
Last edited:
what is the modification for R2604.
Hi, sir, what is the objective on the modification of this R2604? how to do that?
thanks...
I've been intrigued by the Synergy concept for some years but have some resistance against using compression drivers. The very high sensitivity makes them noisy with my amplifiers. But primarily I've gotten really nice results with the ScanSpeak R2604 in a waveguide which makes me want to try it.
/Anton
Hi, sir, what is the objective on the modification of this R2604? how to do that?
thanks...
Sample rate corrected!
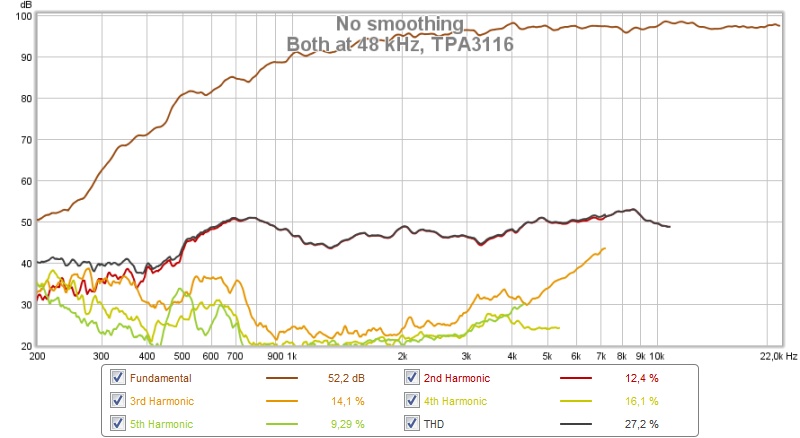
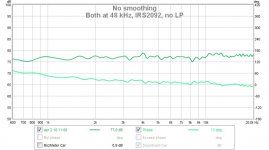
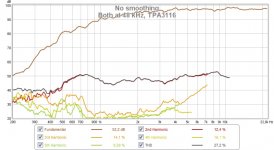
The sample rate in REW was 48 kHz and 44.1 for the soundcard. Now with both at 48 kHz, 97 dB (with the TPA3116):
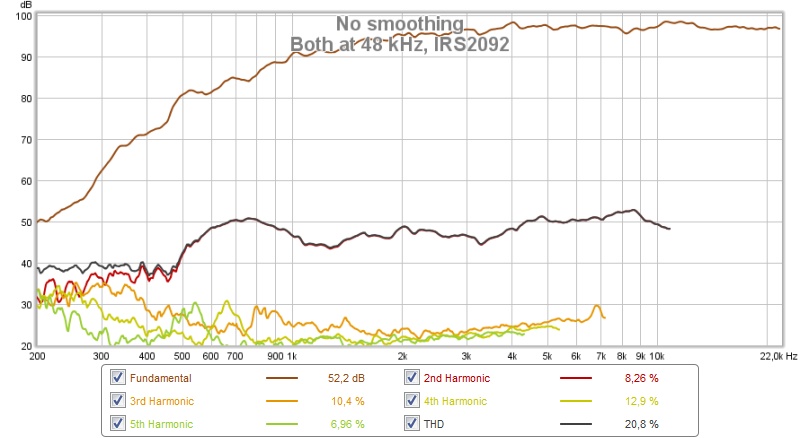
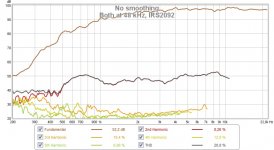
And here with a 300 wpc amp based on the IRS2092:
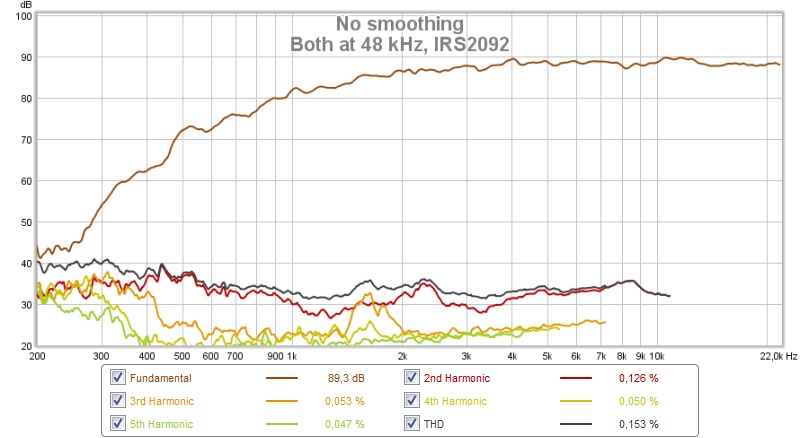
and at 89 dB:
Impulse response:
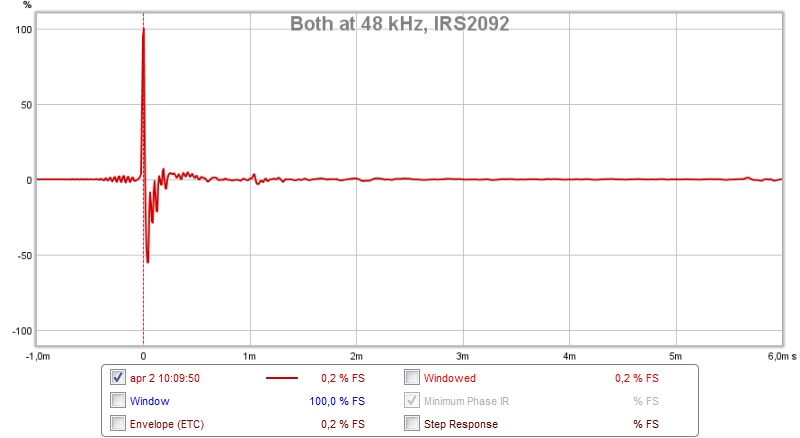
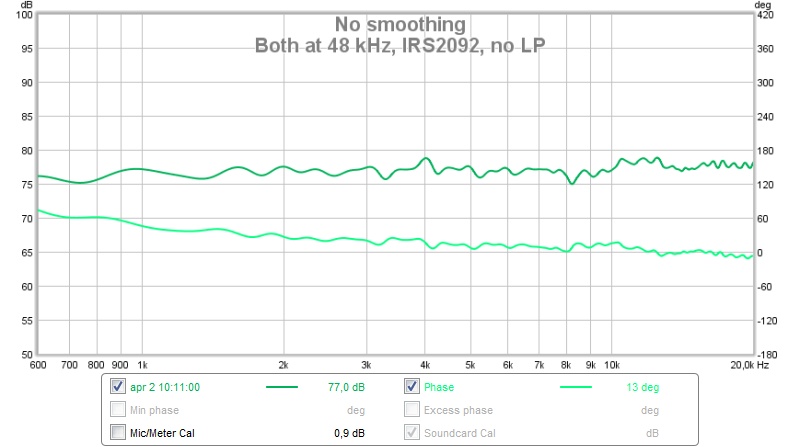
And with no LP:
And impulse response:

Still pre-ringing, but better distortion and flatter frequency response above 20 kHz.
/Anton
The sample rate in REW was 48 kHz and 44.1 for the soundcard. Now with both at 48 kHz, 97 dB (with the TPA3116):
And here with a 300 wpc amp based on the IRS2092:
and at 89 dB:
Impulse response:
And with no LP:
And impulse response:
Still pre-ringing, but better distortion and flatter frequency response above 20 kHz.
/Anton
Attachments

Last edited:
Nice to see the cleaner distortion plots, you'll have to thank ICG for that 😉.
Did it clean up the bottom end of an early waterfall plot as well? I did see some sample rate mismatch "like" disturbance there. But that could also be driver related.
The remaining pré-ringing could come from the D/A stage but this exercise did show the degradation of the signal with a mismatch in sample rate. I'd recommend running a loop back of the signal chain without the speaker and mic to see how far you can clean it up.
As you have plans to use different equipment it's probably OK to let this be as is.
The IR represents mostly high frequency. This ringing can be above 20 KHz. A loop back shows you where it is. I could hear a difference between Asio and Wasapi on my speakers. After adjusting my Asio buffer settings with loop back confirmation that difference went away. Signal chain does matter to a degree. Wasapi still gives a little advantage (in plots) but I need the Asio chain for running more than 2 channels.
Yeah, thanks to you, ICG and BYRTT!Nice to see the cleaner distortion plots, you'll have to thank ICG for that 😉.
Did it clean up the bottom end of an early waterfall plot as well? I did see some sample rate mismatch "like" disturbance there. But that could also be driver related.
The remaining pré-ringing could come from the D/A stage but this exercise did show the degradation of the signal with a mismatch in sample rate. I'd recommend running a loop back of the signal chain without the speaker and mic to see how far you can clean it up.
As you have plans to use different equipment it's probably OK to let this be as is.
The IR represents mostly high frequency. This ringing can be above 20 KHz. A loop back shows you where it is. I could hear a difference between Asio and Wasapi on my speakers. After adjusting my Asio buffer settings with loop back confirmation that difference went away. Signal chain does matter to a degree. Wasapi still gives a little advantage (in plots) but I need the Asio chain for running more than 2 channels.
I can't see any difference in the CSD except that the level is higher above 10 kHz which causes the peaks to rise slightly:
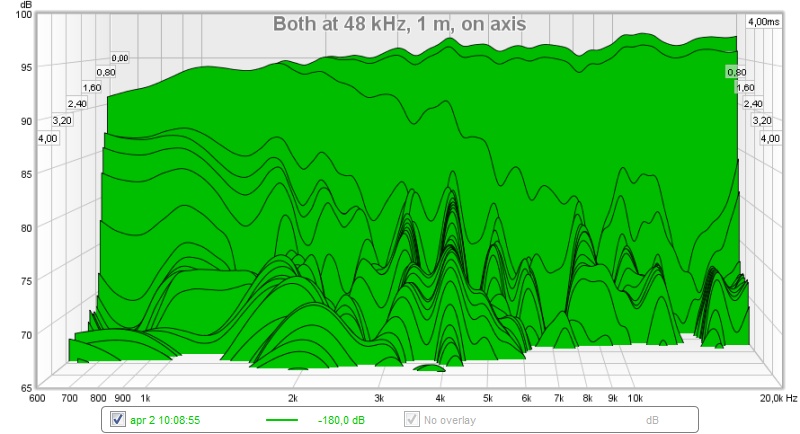
This is with mismatch in sample rate:
I was using the old PEQ settings for these new measurements, which causes the frequency response to be a little jagged. When the horn is a little more finished I'll EQ it flat for 15 deg off axis.
/Anton
Attachments

I'm not sure I follow... The modification I'm doing on the R2604 is removing the faceplate to fasten it to a horn instead. The objective is to control directivity which is desirable to reduce room reflections. My living room is asymmetric, which makes directivity something very positive. A positive side effect is that the sensitivity for low frequencies is increased which lowers the possible crossover frequency.Hi, sir, what is the objective on the modification of this R2604? how to do that?
thanks...
/Anton
Yeah, thanks to you, ICG and BYRTT!
I can't see any difference in the CSD except that the level is higher above 10 kHz which causes the peaks to rise slightly:
This is with mismatch in sample rate:
I was using the old PEQ settings for these new measurements, which causes the frequency response to be a little jagged. When the horn is a little more finished I'll EQ it flat for 15 deg off axis.
/Anton
Try and EQ with a frequency dependent window sometime. Preferably exporting the original measurement with minimum phase ticked in REW and re-importing. The FDW of REW is a bit too smoothed to my taste but you can always give it a try. It will prevent you from over correcting. In REW you can even have the waterfall plot or IR visible in the bottom part of the EQ screen.
Won't hurt to try 🙂.
Experiment with capacitor
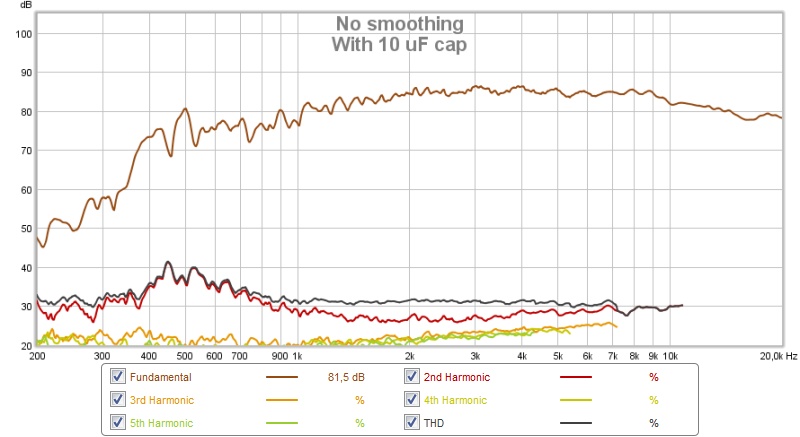
I did a little experiment inspired by kees52 in the Trynergy thread where I added a 10 uF WIMA MKP capacitor:

in series with the R2604.
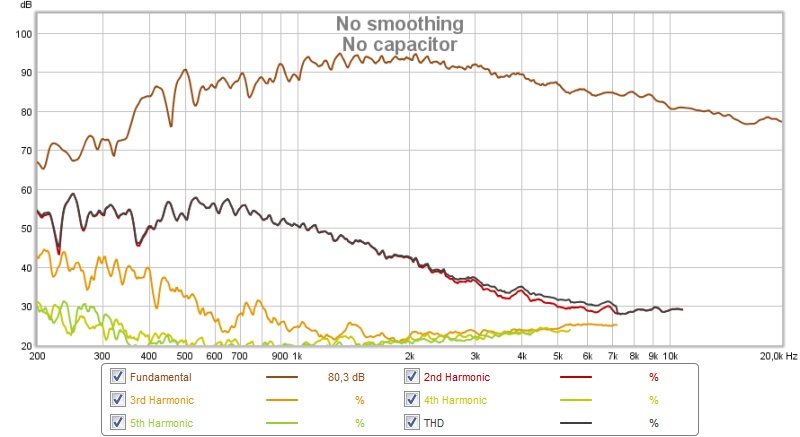
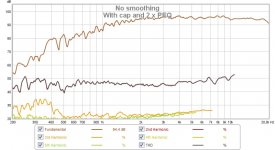
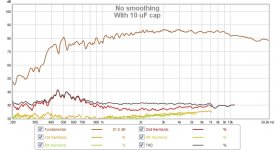
All measurements at 1 m, 15 deg off axis using my IRS2092 amp. First without cap:
With 10 uF cap:
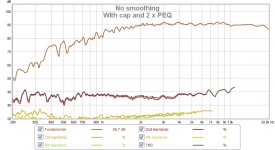
Quite good, let's try adding a little PEQ to remove hump at 500 Hz and lift slightly at 16 kHz:
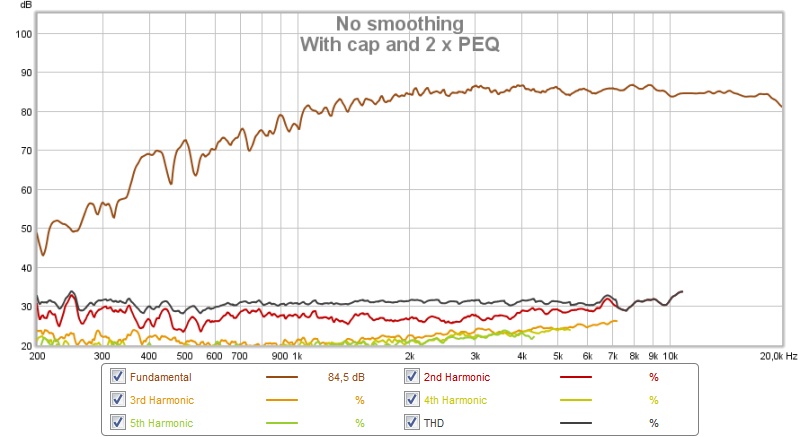
Excellent, close to a 1200 Hz Bessel actually.
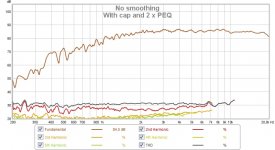
Let's turn up the volume:
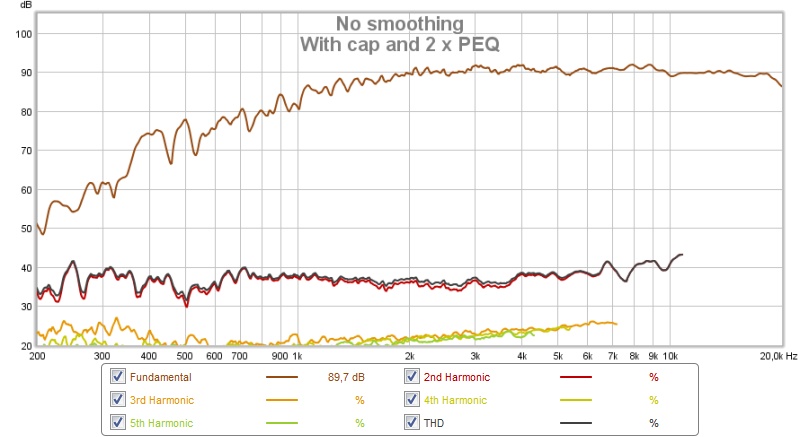
more:
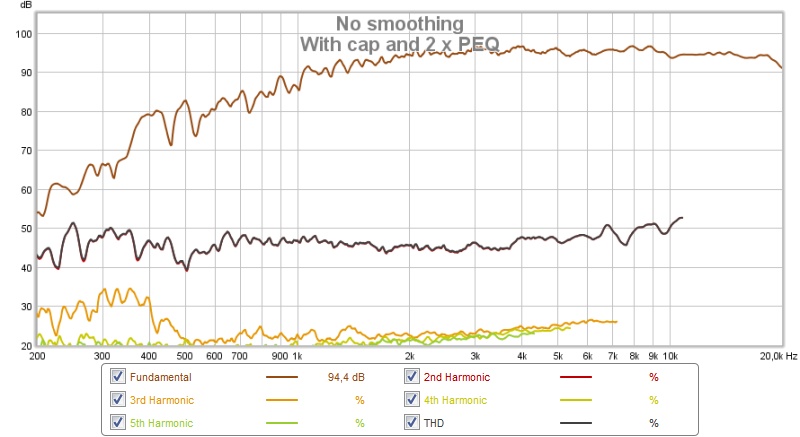
more:
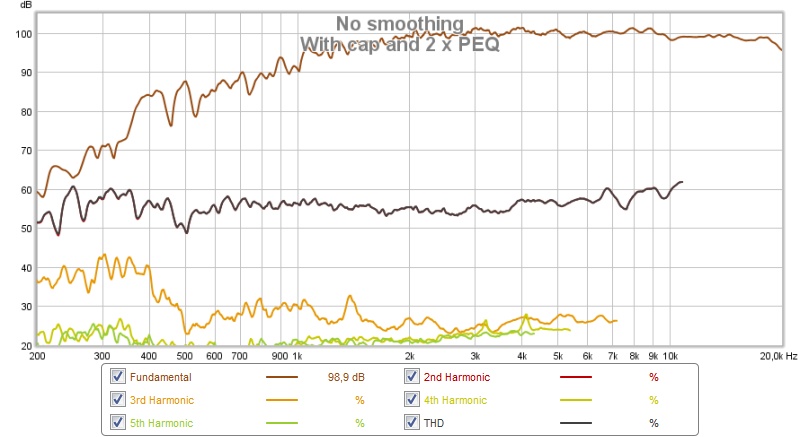
Interesting result with only 1 cap and practically only PEQ outside the passband (16 kHz PEQ could easily be skipped and 500 Hz PEQ was only to control excursion/distortion).
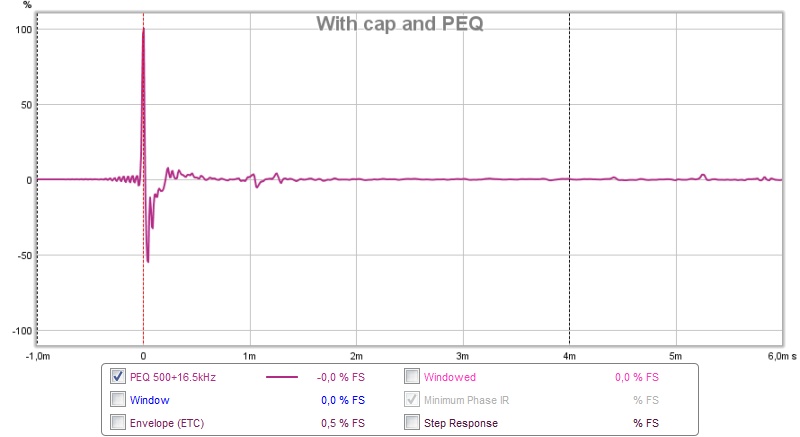
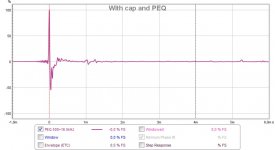
Impulse response with cap and PEQ:
/Anton
I did a little experiment inspired by kees52 in the Trynergy thread where I added a 10 uF WIMA MKP capacitor:
in series with the R2604.
All measurements at 1 m, 15 deg off axis using my IRS2092 amp. First without cap:
With 10 uF cap:
Quite good, let's try adding a little PEQ to remove hump at 500 Hz and lift slightly at 16 kHz:
Excellent, close to a 1200 Hz Bessel actually.
Let's turn up the volume:
more:
more:
Interesting result with only 1 cap and practically only PEQ outside the passband (16 kHz PEQ could easily be skipped and 500 Hz PEQ was only to control excursion/distortion).
Impulse response with cap and PEQ:
/Anton
Attachments
-
 IMG_20160404_115716.jpg105.7 KB · Views: 578
 -
 cap+PEQ 100 dB.jpg85.1 KB · Views: 2,470
 -
 cap+PEQ 95 dB.jpg83 KB · Views: 583
 -
 cap+PEQ 90 dB.jpg82.2 KB · Views: 2,469
 -
 cap+PEQ.jpg84.6 KB · Views: 694
 -
 with cap.jpg83.4 KB · Views: 581
 -
 no cap.jpg85.5 KB · Views: 2,057
 -
 cap+PEQ impulse.jpg52.6 KB · Views: 571
Last edited:
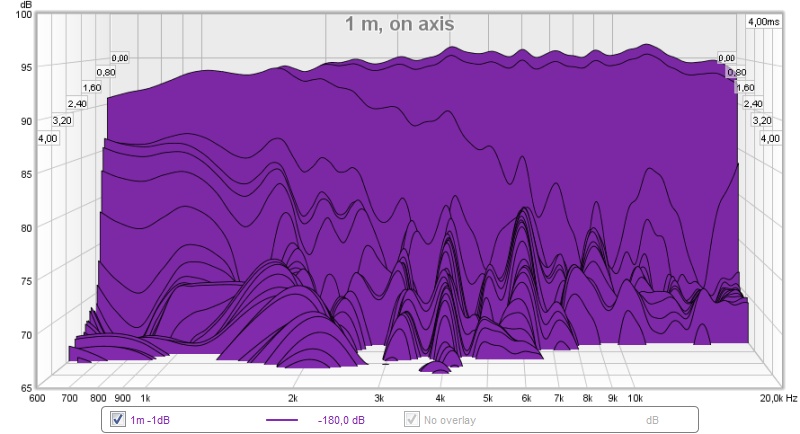
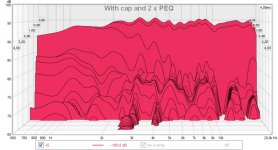
Oh, and here is the CSD for the 95 dB measurement:

Compared to an earlier CSD:
Slightly better behavior below 2 kHz.
Oh, and these measurements are done indoors, shouldn't affect anything as I've gated the measurement before first reflection.
/Anton
Compared to an earlier CSD:
Slightly better behavior below 2 kHz.
Oh, and these measurements are done indoors, shouldn't affect anything as I've gated the measurement before first reflection.
/Anton
Attachments
Last edited:
Not bad at all! The distortion plots look very good. Any change in phase with the introduction of the cap? Will be interesting to see how adding mids will handle the hand off to the tweeter.
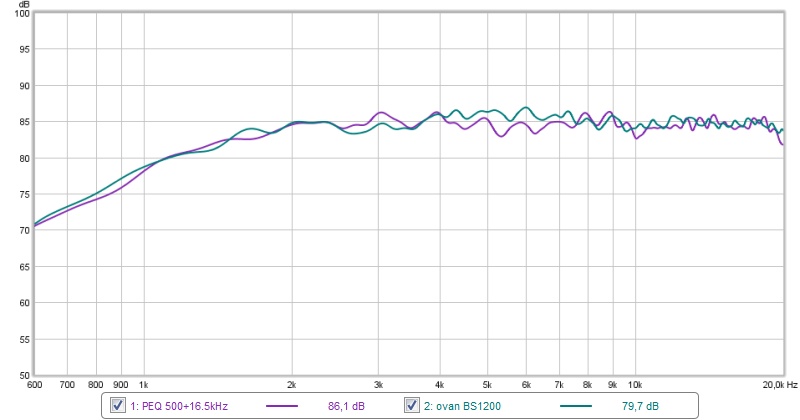
Here's a comparison of cap+2 x PEQ (purple) and EQd flat+LP Bessel 1200 Hz (green):Not bad at all! The distortion plots look very good. Any change in phase with the introduction of the cap? Will be interesting to see how adding mids will handle the hand off to the tweeter.
And phase:
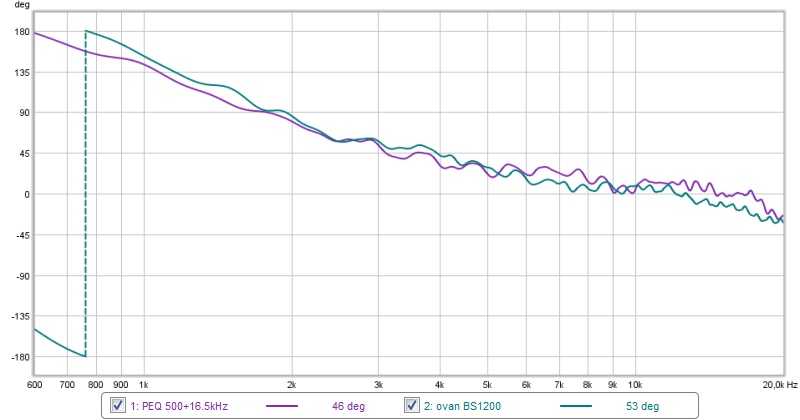
Quite similar, slightly less phase change with the cap.
/Anton
Attachments

Good to see it's behaving as expected. Close enough I'd say. A clean way to level out the tweeter/horn with minimum amount of processing. On to the next step? 😀
Nice. I assume you are aiming for Bessel 2nd order to use in Harsch XO? That's very low distortion. Well done.
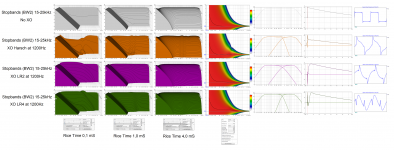
Great results with capacitor, that waterfall is a bit clearer below 2kHz is probably because at very low frq not seen in frq plots capacitor setup has a little bit more extension also indicated by phase trace direction in post 112 phase plot, ringing tail in that frq area coursed by slope cut off will go away later when midwoofers extend bandwidth even lower.
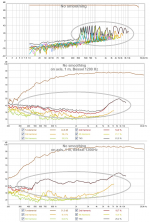
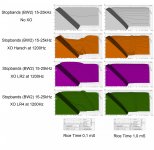
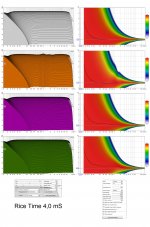
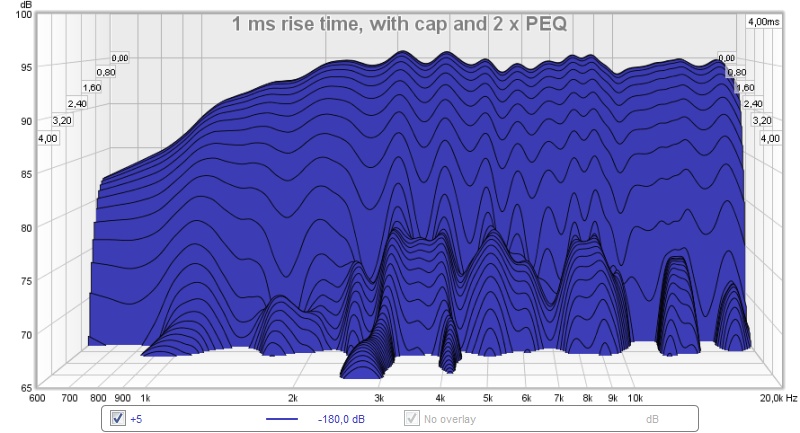
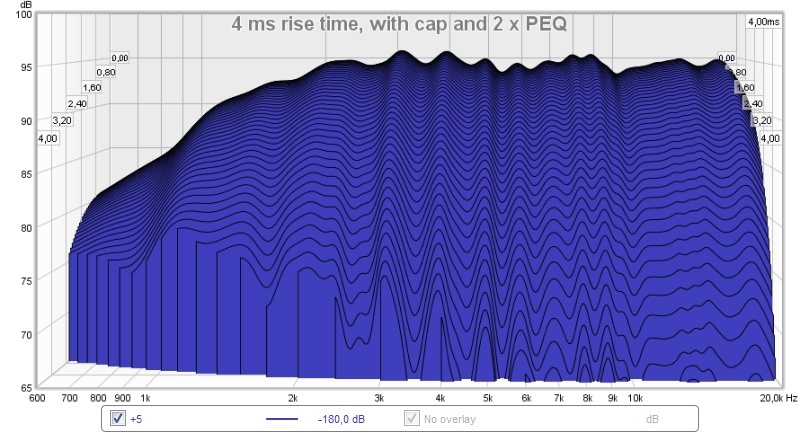
Mayby below minimum phase system examples is interesting data related this thread, files size did grow so to see full resolution had to split up therefor picture 1 is same as 2/3/4.
Mayby below minimum phase system examples is interesting data related this thread, files size did grow so to see full resolution had to split up therefor picture 1 is same as 2/3/4.
Attachments

Yep! I'm glueing the last part of the horn now and will then try to make first bandpass holes.Good to see it's behaving as expected. Close enough I'd say. A clean way to level out the tweeter/horn with minimum amount of processing. On to the next step? 😀
Thanks!
Very nice work Onni! I havenot been following for a while but love the great progress.
Yep, that's the plan. I'll post some raw measurement files later if anyone wants to experiment. I'm guessing that the Harsch XO is a good starting point, but even better might be possible.
Nice. I assume you are aiming for Bessel 2nd order to use in Harsch XO? That's very low distortion. Well done.
Indeed interesting, always nice to have you on board for these kinds of data.Great results with capacitor, that waterfall is a bit clearer below 2kHz is probably because at very low frq not seen in frq plots capacitor setup has a little bit more extension also indicated by phase trace direction in post 112 phase plot, ringing tail in that frq area coursed by slope cut off will go away later when midwoofers extend bandwidth even lower.
Mayby below minimum phase system examples is interesting data related this thread, files size did grow so to see full resolution had to split up therefor picture 1 is same as 2/3/4.
/Anton

😀 excellent data all over in this pre stage continue that road and R2604 will go out of stock worldwide.
If it does, maybe the Viva XT is still a good alternative 🙂: http://www.diyaudio.com/forums/multi-way/156906-scan-speak-r2604-vs-vifa-xt25.html
- Home
- Loudspeakers
- Multi-Way
- Synergy attempt without compression driver