Hi Andrea
Thank you for your fast response.
The length of the straight starts at the rear of the baffle, right?
A last question about the 90 degree bend. It has only one parameter for the area. In my case, the input are is much larger than the output area. Should I use the input or the output size?
Grazie sincero,
Andreas
Yes, the straight segment starts at the rear of the front baffle.
I would go with the input size and then put the right value of S_0 in the first vertical tapered segment.
If there is a lot of difference between input and output size you can also directly switch from straight to tapered and set the lenght of the first segment equal to the distance from front to rear panel.
Hi Andreas
I think both will work for the simulation but in the end I have to test this in real. I guess the volume behind the driver needs a lot of stuffing. 🙂
BTW, since calculating such an enclosure can be annoying, I created an Excel template.
I hope this helps other as well 😉
I think both will work for the simulation but in the end I have to test this in real. I guess the volume behind the driver needs a lot of stuffing. 🙂
BTW, since calculating such an enclosure can be annoying, I created an Excel template.
I hope this helps other as well 😉
Attachments
Hi Andrea,
Thank you for your input on modelling multiple drive units. I have now built a model of the Jenzen Illuminator, referred to earlier; it aligns very well with the measurements on the website, even to the suck out at around 2 kHz if the polarities of the mid and treble drive units are the same!
At the moment I have three separate drive unit models that I combine at a sound output level, the issue I am wrestling with now is how to use a single amplifier for all three drive units to derive an impedance curve. When I do this I get an error message stating that the voltage sources for two of the three speaker drive units are paralleled making an over defined circuit matrix. It adds that you will need to correct the circuit or add some series resistance. When I add some resistance, either small or large, to the voltage sources the sound output changes to a rather random looking output.
Do you have any suggestions on how to overcome this?
I am really impressed with the model which has ignited my desire to get into LTSpice in a far bigger way.
Thanks again for making the model available and kind regards
Steve
Hi Andrea,
Thank you for your input on modelling multiple drive units. I have now built a model of the Jenzen Illuminator, referred to earlier; it aligns very well with the measurements on the website, even to the suck out at around 2 kHz if the polarities of the mid and treble drive units are the same!
At the moment I have three separate drive unit models that I combine at a sound output level, the issue I am wrestling with now is how to use a single amplifier for all three drive units to derive an impedance curve. When I do this I get an error message stating that the voltage sources for two of the three speaker drive units are paralleled making an over defined circuit matrix. It adds that you will need to correct the circuit or add some series resistance. When I add some resistance, either small or large, to the voltage sources the sound output changes to a rather random looking output.
Do you have any suggestions on how to overcome this?
I am really impressed with the model which has ignited my desire to get into LTSpice in a far bigger way.
Thanks again for making the model available and kind regards
Steve
Hi steve,
currently you can use a maximum of 2 speakers in SpicyTL, if you try to insert more speakers you will get an error message.
Andrea
Hey
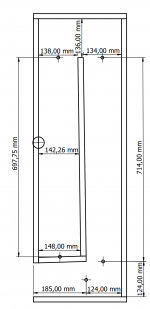
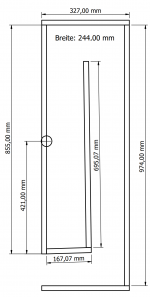
I build a speaker case for the Tang Band W8-1808. For my first one, the result sounds superb for my ears. Agile, everytime on the point but never tensed. A perfect speaker for my KT88 tube amp. 😀
The simulation was helpful. But in the end, every damping material is different and it took a lot time to find the best setup. I started with the calculation of a low tunes 1/3 line and used my improved excel sheet to calculate the details for the construction.
I've used 30 and 40mm basotec foam and black PUR foam with the pyramid structure.
The speaker has only an impendance correction zobel network (8 Ohm / 4,7µF) but no FR corection. I'm using a miniDSP to mitigate some serious acoustic challenges in my living room. And the miniDSP can do the FR linearization better than any passive parts. Only a few carefull adjustments are required with the PEQ.
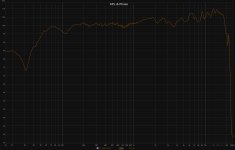
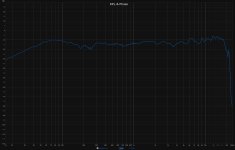
I've added the nearfield measurements from the end of the line and from the speaker center. I combined it with RWE to the full response.
I build a speaker case for the Tang Band W8-1808. For my first one, the result sounds superb for my ears. Agile, everytime on the point but never tensed. A perfect speaker for my KT88 tube amp. 😀
The simulation was helpful. But in the end, every damping material is different and it took a lot time to find the best setup. I started with the calculation of a low tunes 1/3 line and used my improved excel sheet to calculate the details for the construction.
I've used 30 and 40mm basotec foam and black PUR foam with the pyramid structure.
The speaker has only an impendance correction zobel network (8 Ohm / 4,7µF) but no FR corection. I'm using a miniDSP to mitigate some serious acoustic challenges in my living room. And the miniDSP can do the FR linearization better than any passive parts. Only a few carefull adjustments are required with the PEQ.
I've added the nearfield measurements from the end of the line and from the speaker center. I combined it with RWE to the full response.
Attachments
-
TML calc 2-bend V3.zip12.5 KB · Views: 186
-
 W8-1808 TML Speaker Nahfeld.jpg430.2 KB · Views: 298
 -
 W8-1808 TML Line Ende Nahfeld.jpg438.4 KB · Views: 269
 -
 W8-1808 TML Kombiniert.jpg577.8 KB · Views: 366
 -
 TML02.png80 KB · Views: 343
 -
 TML01.png75 KB · Views: 362
 -
 W8-1808 TML inside.jpg311.8 KB · Views: 338
 -
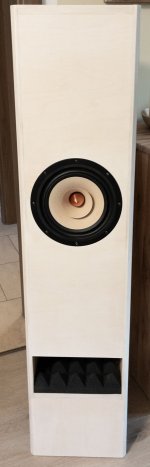 W8-1808 TML front.jpg107.8 KB · Views: 323
SpicyTL 1.6 is now available for download:
SpicyTL-english – Transmission Line Speakers
Up to 4 identical speakers can now be simulated in the same project.
The new "Ang" parameter in "Test Point" block allows you to define more quickly the radiation angle (default value: 2 pi steradians).
A general revision of the model allows even more precise simulations to be obtained.
Tip: in SpicyTL it is very easy to add a crossover filter to the simulation. Creating the filter within an amplifier block allows you to quickly switch between configuration with or without a crossover. I created the "Amplifier XO" block as an example.
Have fun 🙂
Andrea Rubino
That's excellent news, since the last post I have been busy building a model of the transmission line speakers I already have, then comparing them with measurements. To combine the three drive units I ran them as separate speakers then used the plot function to join them together and generate the necessary information on sound levels, impedance, phase etc. I also built the crossovers into the model, altogether they give a deep insight into what is happening and compare very well with the measurements.
The initial measurements highlighted that the mid woofer drive units were slightly different to the manufacturers data. Once the Thiele Small parameters had been updated in the model, alignment between the theory and the measurements was very good indeed. The other fascinating insight is how the crossover components affect the model, when you look into component tolerances and include the ESR of capacitors etc, it is fascinating to see by how much the sound output changes, certainly it will be audible. The other eye opener was building plots looking at currents and power levels, this demonstrated even more clearly what was happening and where improvements were potentially available.
Where I found the model particularly useful was in understanding what was happening at the lower frequency levels, this was hinted at in the measurements and could be seen far more clearly on the model. I am now at the stage of designing a new crossover to improve what is happening below around 400Hz, this entails modifying both the crossover components and the stuffing levels in the Transmission Line. Given my other commitments I suspect this will happen in the New Year. In the meantime I will look into the update and when I have modified the speakers let you know how it all went.
Hi Andrea,Hi everyone,
SpicyTL is online and available for download.
SpicyTL is a simulation model, based on the electrical circuit theory, which predicts the electro-acoustic behavior of transmission line loudspeaker systems. It is the evolution of the AIRDAMP model, whose development (and the principles that allow its operation) is illustrated in the article Progettare una linea di trasmissione utilizzando SPICE (Designing a Transmission Line with SPICE), published in issues 408, 409 and 410 (April, May and June 2019) of AUDIOreview. Compared to the latter, SpicyTL has a modular structure composed of several acoustic blocks and can also simulate tapered and expanding TL's.
The model, particularly suitable to design a TL damped with polyurethane foam, allows to simulate frequency response, phase response, group delay, electrical impedance, speaker cone excursion and air velocity at the TL output.
Operating instruction and download at the following address:
SpicyTL-english – Transmission Line Speakers
An in-depth look at the software, and its use for designing the Ikigai monitors, can be found in the article Progettiamo una linea di trasmissione con SpicyTL (Designing a Transmission Line with SpicyTL) on the 427th issue (January 2021) of AUDIOreview.
Kind regards,
Andrea
I've been trying to adjust the upper extent of frequencies displayed on the graph, and it just seems to keep resetting to 1KHz, is there a way to edit the frequency range plotted?
Many thanks,
Elliott Dyson
Hi Elliot,Hi Andrea,
I've been trying to adjust the upper extent of frequencies displayed on the graph, and it just seems to keep resetting to 1KHz, is there a way to edit the frequency range plotted?
Many thanks,
Elliott Dyson
you can edit the frequency range in the "Analysis Directives" in the main sheet:
.ac dec 100 10 1000
where 10 is the start frequency and 1000 is the stop frequency.
Having said that, remember that SpicyTL is only able to simulate TL behavior at low frequencies and in general it is not recommended to go beyond 1000 Hz.
Thank you so much! I'm currently working on a series on youtube on using your program, I've done a video that's a bit of an overview, but I want to do it with better quality and split it into parts. I think being able to change the upper bound of the graph is crucial for certain applications so I wanted to know how to do it so I could share that. Thank you!Hi Elliot,
you can edit the frequency range in the "Analysis Directives" in the main sheet:
.ac dec 100 10 1000
where 10 is the start frequency and 1000 is the stop frequency.
Having said that, remember that SpicyTL is only able to simulate TL behavior at low frequencies and in general it is not recommended to go beyond 1000 Hz.
interesting, post a link if you like 🙂Thank you so much! I'm currently working on a series on youtube on using your program, I've done a video that's a bit of an overview, but I want to do it with better quality and split it into parts. I think being able to change the upper bound of the graph is crucial for certain applications so I wanted to know how to do it so I could share that. Thank you!
Hi Andrea,
Brilliant simulator!
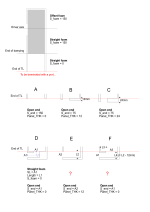
I am modeling a TABAQ for ScanSpeak 10F/8414G10. I see that the open end/port configuration affects the overall output drastically in this MLTL design, so I'd like to model it correctly. However, I am not quite sure about how to model front-facing ports. Would you mind commenting on the following options? I will probably need to use option F in the attached drawing, but I also show others in order to understand SpicyTL better.
In the attached drawing, I show (1) the TL enclosure, (2) three straight open-end options A, B, C, and (3) three front-facing open-end options D, E, F.
The cross-section of the TL is a straight 150cm2 and the panel thickness is 12mm.
I think I got the straight ones A, B, C correct.
I attempted modeling option D as shown. The port has a constant cross-sectional area of A1. Is it OK?
For options E and F, how would you model the section between "End of TL" and "Open end"?
I get pretty good results (attached) with modelling option F as follows:
Straight foam (for the 18cm2, 3cm long port under L3)
SL = 18cm2 (port cross section area)
Length = 0.03m (Length of L3 port shelf)
S_foam =0
Open end
S_end = 18cm2
Panel_THK = 0
But I think this is ignoring the volume under the area A3 (which is 150cm2 minus the area occupied by the port shelf L3).
Thanks a lot.
Brilliant simulator!
I am modeling a TABAQ for ScanSpeak 10F/8414G10. I see that the open end/port configuration affects the overall output drastically in this MLTL design, so I'd like to model it correctly. However, I am not quite sure about how to model front-facing ports. Would you mind commenting on the following options? I will probably need to use option F in the attached drawing, but I also show others in order to understand SpicyTL better.
In the attached drawing, I show (1) the TL enclosure, (2) three straight open-end options A, B, C, and (3) three front-facing open-end options D, E, F.
The cross-section of the TL is a straight 150cm2 and the panel thickness is 12mm.
I think I got the straight ones A, B, C correct.
I attempted modeling option D as shown. The port has a constant cross-sectional area of A1. Is it OK?
For options E and F, how would you model the section between "End of TL" and "Open end"?
I get pretty good results (attached) with modelling option F as follows:
Straight foam (for the 18cm2, 3cm long port under L3)
SL = 18cm2 (port cross section area)
Length = 0.03m (Length of L3 port shelf)
S_foam =0
Open end
S_end = 18cm2
Panel_THK = 0
But I think this is ignoring the volume under the area A3 (which is 150cm2 minus the area occupied by the port shelf L3).
Thanks a lot.
Attachments
TABAQ is a straight line and the last part has a smaller cross section. You can in fact put the cabinet on some feet letting the last part pointing down.
In my TABAQ the last part is made like a fold, slottet port if you like. There is no need to simulate the bend.
In my TABAQ the last part is made like a fold, slottet port if you like. There is no need to simulate the bend.
Attachments
Hi Bjohannesen,
Thanks for your comment. I studied your TABAQ papers in detail 🙂 Let me also thank you at this opportunity for sharing them.
I built the speaker now from foam core board as a prototype before committing to wood, and the bass is indeed surprising.
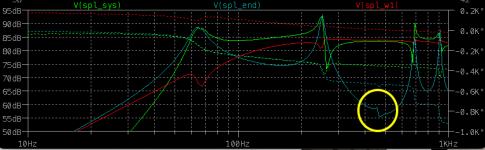
The reason I wanted to simulate the port is the wiggle(?) the port introduces in the midrange (shown with the yellow circle in the attachment). Bob Brines fixes that wiggle by altering the driver offset by a few millimetres. Since he was bothered about the wiggle enough to move the driver around, I wondered if altering the port geometry instead of the driver offset would help.
But after simulating and building the foam core speakers, I too realised that that's a small detail to worry about at the simulation stage.
Cheers.
Thanks for your comment. I studied your TABAQ papers in detail 🙂 Let me also thank you at this opportunity for sharing them.
I built the speaker now from foam core board as a prototype before committing to wood, and the bass is indeed surprising.
The reason I wanted to simulate the port is the wiggle(?) the port introduces in the midrange (shown with the yellow circle in the attachment). Bob Brines fixes that wiggle by altering the driver offset by a few millimetres. Since he was bothered about the wiggle enough to move the driver around, I wondered if altering the port geometry instead of the driver offset would help.
But after simulating and building the foam core speakers, I too realised that that's a small detail to worry about at the simulation stage.
Cheers.
Attachments
Hi leehan
Did you measure the wiggle with stuffing? Anyway, I doe not think it is auditable at all.
Hi
Bjørn
PS I often get the comment "where is the sub"
Did you measure the wiggle with stuffing? Anyway, I doe not think it is auditable at all.
Hi
Bjørn
PS I often get the comment "where is the sub"
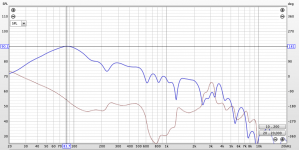
I did measure it (attached). The wiggle is not there. Measurement is at the mouth of the port. Stuffing is 17kg/m3 Knauf glasswool leftover from a house renovation (it's much nicer to work with than rockwool).
The port output peak frequency is much higher than modeled, ~84Hz vs 65Hz (the screenshot I've sent in my previous post is not for the speakers I built). I thought the foam core cabinet or the port might be leaking. The values are consistent across both speakers though. I also did an impedance measurement of the speakers with DATS, they were identical as well. So I think this may be something inherent in a foam core build. Foam core build has other issues for me as well, it's too transparent for mids even with two layers (10mm thickness in total). But I consider this proof of concept as successful, I just wanted to see the bass performance.
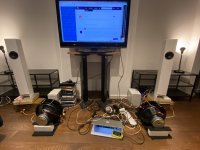
With respect to subwoofers, I can see that. I prefer the bass from these TABAQs to the dipole woofers I have in development (well, probably not anymore 😉). TABAQ's bass sounds more integrated with the full rangers. I'm really excited about the wooden cabinets that I'll build which may perform down to mid-60 Hz as simulated. The foam cores and the dipole woofers are in the second attachment (my wife is away at the moment, as you can tell 🙂).
The port output peak frequency is much higher than modeled, ~84Hz vs 65Hz (the screenshot I've sent in my previous post is not for the speakers I built). I thought the foam core cabinet or the port might be leaking. The values are consistent across both speakers though. I also did an impedance measurement of the speakers with DATS, they were identical as well. So I think this may be something inherent in a foam core build. Foam core build has other issues for me as well, it's too transparent for mids even with two layers (10mm thickness in total). But I consider this proof of concept as successful, I just wanted to see the bass performance.
With respect to subwoofers, I can see that. I prefer the bass from these TABAQs to the dipole woofers I have in development (well, probably not anymore 😉). TABAQ's bass sounds more integrated with the full rangers. I'm really excited about the wooden cabinets that I'll build which may perform down to mid-60 Hz as simulated. The foam cores and the dipole woofers are in the second attachment (my wife is away at the moment, as you can tell 🙂).
Attachments
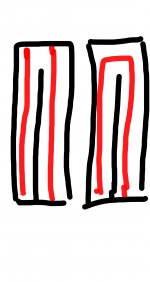
Sorry for the rubbish drawing. I've seen tl sketches measuring both ways but which is correct? As an example would a 1 metre tall box with just one bend like the drawing be a 2 metre line like the drawing on the left? I would you take the measurements through the centre and add the horizontal
measurement like the drawing on the right?
measurement like the drawing on the right?
Attachments

It's a good approximation, but to get best accuracy you'll have to use this for determining corner bends.
Thank you I will read the link.It's a good approximation, but to get best accuracy you'll have to use this for determining corner bends.
- Home
- Loudspeakers
- Subwoofers
- SpicyTL - Transmission Line Simulation Model