
![WP_20140908_007[1].jpg](/community/data/attachments/406/406280-1df45b6a85d7cc6ddf3ff3e4033d13eb.jpg?hash=HfRbaoXXzG)
![WP_20140908_008[1].jpg](/community/data/attachments/406/406291-5377d0287180c12062b5fb9856d1e9ff.jpg?hash=U3fQKHGAwS)
what's the purpouse of the switch
The purpose of the switch is stated on the v.4 schematic, which is an attachment to post #1 in this thread. It is also mentioned in the Quasimodo design note, see page 22.
Attachments
I suggest you snap a series of scope photos at different measured values of Rs, just like the color overlay plots in post #1 of this thread. This will help you find the Rs which just barely flattens out the first waveform "trough" like the red trace (see yellow arrow).
From your first photo, it seems that Lsec might be in the neighborhood of 1200 uH, so zeta=1 critical damping would be expected to occur somewhere in the vicinity Rs = 170 ohms or thereabouts. Assuming your Cx really was 10nF, and so forth.
From your first photo, it seems that Lsec might be in the neighborhood of 1200 uH, so zeta=1 critical damping would be expected to occur somewhere in the vicinity Rs = 170 ohms or thereabouts. Assuming your Cx really was 10nF, and so forth.
Attachments
![WP_20140910_001[1].jpg](/community/data/attachments/409/409037-21f0297909ad9bc350fa4fde3a976bd7.jpg?hash=IfApeQmtm8)
![WP_20140910_002[1].jpg](/community/data/attachments/409/409047-9db45f759471f8ff9a21513d29296d46.jpg?hash=nbRfdZRx-P)
![WP_20140910_003[1].jpg](/community/data/attachments/409/409068-3f053ba81d8a10f6662cde324837e730.jpg?hash=PwU7qB2KEP)
![WP_20140910_004[1].jpg](/community/data/attachments/409/409081-a2e607482cd51dba7ce5e7c311b0d810.jpg?hash=ouYHSCzVHb)
![WP_20140910_005[1].jpg](/community/data/attachments/409/409092-415cac62b45bfa933cb515f50ddce4bc.jpg?hash=QVysYrRb-p)
![WP_20140910_006[1].jpg](/community/data/attachments/409/409105-a35b13541254584724dbe33090d0fd2a.jpg?hash=o1sTVBJUWE)
Looking your pics I guess is more appropriate 100R, right?
Or have I to change the scope set?
Or have I to change the scope set?
Last edited:
Hi,
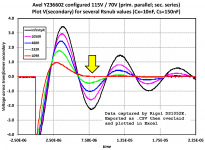
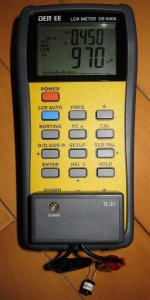
I got a LCR meter lately, out of curiosity I compared it's measurement of an inductor with the Quasimodo jig I have built. The inductor has a specified value of 1000uH, and the LCR meter measured it to be 970uH, which seems quite OK.
Thanks and regards.
I got a LCR meter lately, out of curiosity I compared it's measurement of an inductor with the Quasimodo jig I have built. The inductor has a specified value of 1000uH, and the LCR meter measured it to be 970uH, which seems quite OK.
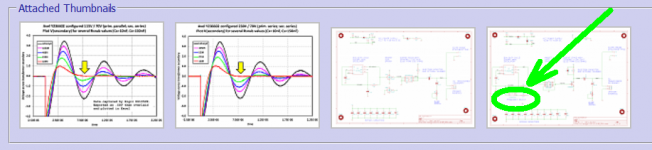
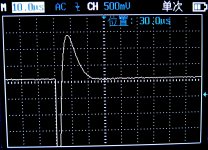
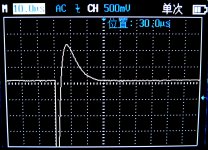
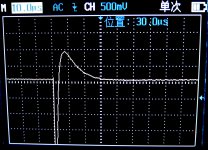
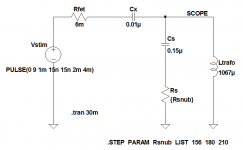
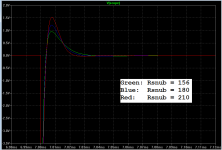
- If I refer to post #257, when zeta=1, L=4Rs^2Cx, or Rs=sqrt(L/4Cx). With Cx=0.01uF and L=970uH, Rs should be 156ohm.
- When I set Rs=156R, I get the attached graph Damping_156R.jpg
- Graphs Damping_180R.jpg and Damping_210R.jpg refer to the case when Rs equals 180R and 210R respectively
- Graph No_damping.jpg refer to the measurement when R is open circuit, to give an idea of the ringing frequency
Thanks and regards.
Attachments
Hi Cwtim01, congratulations on your measurements. Your pictures illustrate one reason why it's a very good idea to aim for (zeta = 1.00). Even if you miss the target by 35%, either high or low, the resulting RLC circuit is still very well damped with very little to no oscillatory ringing. Your pictures span a range of (210 / 156) = 1.35X. Since zeta is proportional to (1/Rsnub), your pictures span a range of 1.35X in zeta as well. Yet they are all very well behaved, compared to the unsnubbed case in your first scope photo. None of those pictures would be a "wrong choice".
If I were you, I would be just a little bit concerned about the measurements from your inductance meter. If its uppermost readout is saying the inductor's quality factor "Q" is 0.45, that is highly suspicious. The method of Logarithmic Decrements (QM design note appendix B), applied to your first scope photo, calculates Q is about 31, including losses in both the inductor and the CX capacitor. So the inductor's Q is at least 31. Perhaps your inductance meter does not make its measurements at 51.7 kilohertz (the oscillatory frequency of your undamped circuit), and perhaps that induces errors in the measured value of L and/or Q.
In any case, I recommend you horse around with different values of Rsnub in both real-life Quasimodo hardware, and in SPICE simulation. Check whether your real-world measured results, coincide with simulated results. In this case, I think they're rather close. That ought to give you confidence that it's not a life-or-death decision, whether to choose Rsnub=156 or Rsnub=210 or somewhere in between. They all provide excellent damping.
Attachments
Merlin, the waveshape I would seek is somewhere between the photos of post #371 and #372. I would also connect Quasimodo to a laboratory DC power supply, and set the supply voltage above 15 volts, so I could get a much taller waveform that fills up the vertical height of the oscilloscope screen. Similar to the way the waveform fills up the vertical height of the oscilloscope screen in the picture of post #366.
did you short the other windings as the instructions say?
Yes primary windings sorted, double secondary paralleled.
Merlin, the waveshape I would seek is somewhere between the photos of post #371 and #372. I would also connect Quasimodo to a laboratory DC power supply, and set the supply voltage above 15 volts, so I could get a much taller waveform that fills up the vertical height of the oscilloscope screen. Similar to the way the waveform fills up the vertical height of the oscilloscope screen in the picture of post #366.
Mark tomorrow I will use bench PSU to supply the Quasimodo with 15VDC.
... congratulations on your measurements...
Thanks Mark for your insightful explanations, now I understand the Quasimodo idea better.
For the LCR Q reading of 0.45, it was measured at a frequency of 100Hz, I got a Q of 29.4 at 10kHz and 74.4 at 100kHz (it doesn't support measurement at 50kHz). I hope these numbers look more reasonable, these D and Q figures are really new concept to me and I need learn what they are. I got the meter quite cheap from e-Bay, and one of the reason to compare it to the Quasimodo is to find out if it's measurements are useful.
Attachments
- Home
- Amplifiers
- Power Supplies
- Simple, no-math transformer snubber using Quasimodo test-jig