I do hope you realize FIR filters don't have to have initial delay. A FIR filter does not have to be linear phase. It's an option. 🙂 An option that made them popular. It's not a requirement for FIR filters. It depends on what you (want) do with them.
You could use a long FIR filter and set a LR24 crossover with it and have it perform without initial delay and it would have the normal group delay of the LR24 crossover. Just saying...
Such a long FIR filter would not have any of the problems described in that paper and still be a long FIR filter. Just to demonstrate that "what you do with it" is more important than the method of filtering used.
I agree on all that🙂
The picture shoved a linear phase, low freq FIR filter starting filtering at 0 ms. I would like to see that filter🙂 I think he forgot to include the FIRlength/2 delay?
I agree on all that🙂
The picture shoved a linear phase, low freq FIR filter starting filtering at 0 ms. I would like to see that filter🙂 I think he forgot to include the FIRlength/2 delay?
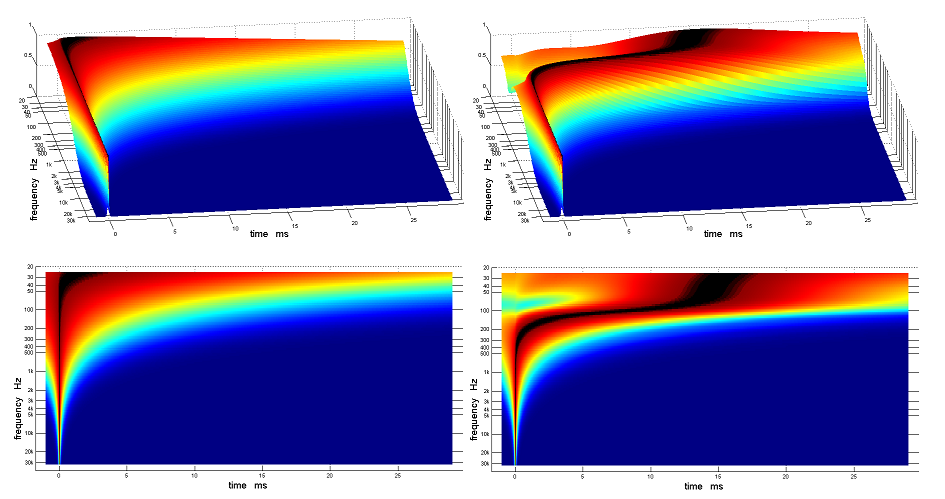
That is just the way APL TDA shows the plot, 0 is where the peak occurs, the timescale is relevant to the time from the peak only and is not representative of any latency or otherwise in the filter used. Similar to how many programs place the peak of the impulse at 1ms when exported.
@Sax512: I think it is interesting to see how ringing interacts when combined with a time shift. The finnish paper show that there can be very small changes in frequensy response, 0.1 dB, and still artifacts can be heard. So I still believe the time response is the reason.
(The time response do not look as an dirac at all, asymetric, huge sidelobes, not uniformly falling sidelobes etc., So we are not talking small ripples here)
OK, but again, it is not a problem of FIR filter. It is a problem of time alignment of more than 1 driver.
Also, the sinc function has a lot of ripples, decaying in amplitude as 1/t. Not 'small' ripples, but still, ideally, you would want to see them.
I see a lot of people ditching FIR filters because of the ripples in the impulse response.
I just wanted to say that those are NOT a problem in and of itself.
Agree.
Then the negative aspects of sharp FIR filters are often under communicated.
That is just the way APL TDA shows the plot, 0 is where the peak occurs, the timescale is relevant to the time from the peak only and is not representative of any latency or otherwise in the filter used. Similar to how many programs place the peak of the impulse at 1ms when exported.
Then I think the program downplays the importance of low or high latency in many applications. IMHO.
Then I think the program downplays the importance of low or high latency in many applications. IMHO.
It does nothing of the sort as it is designed as a loudspeaker measurement program. It is up to the user to interpret the data.
The program is very good at showing visually the time distortion caused by phase in IIR filters which is what I think Byrtt was getting at with the image.
The point you make about the latency of filters is valid but not fair to have a go at the program when it is doing exactly what is was designed to do.
Ok, I would prefer to have information on initial latency in the filter, but was not aware it was an speaker measurement program so the absolute time reference is partly lost. It looks like a very good presentation of time-frequency measurements. I'm impressed.
I still think it is a bit unfair of BRYTT to neglect latency in FIR filter and show phasedelay in IIR filter.
I still think it is a bit unfair of BRYTT to neglect latency in FIR filter and show phasedelay in IIR filter.
Last edited:
Ok, I would prefer to have information on initial latency in the filter, but was not aware it was an speaker measurement program so the absolute time reference is partly lost. It looks like a very good presentation of time-frequency measurements. I'm impressed.
I still think it is a bit unfair of BRYTT to neglect latency in FIR filter and show phasedelay in IIR filter.
Hi, They are different animals IMO, latency is a simple overall delay, akin to listening distance, independent of frequency. Phase delay varies with frequency.
@wesayso, thx for helping clarify. I am completely in tune with vertical off-axis combing issues in multiways. Overcoming them is the real benefit to steep filters IMO. That's where FIR and linear phase filters help so much. Steep IIR are well known for their phase rotation, and going unstable computationally.
I know combing issues are audible, I can hear and measure them. Pre-ringing is quite debatable IMO. For now, I'll use steep filters to solve a verifiable issue.
@sax512, I agree. I don't think audibility of time offset has anything to do with audibility of pre-ringing.
I'm not so sure peering into filtered impulse responses means anything. I don't fully understand what you're saying, but i think you are hitting at this too.
The only pre-ringing in impulse responses that I work to remove, is when the response is taken from a full range system.
Last edited:
Ok, I would prefer to have information on initial latency in the filter, but was not aware it was an speaker measurement program so the absolute time reference is partly lost. It looks like a very good presentation of time-frequency measurements. I'm impressed.
I still think it is a bit unfair of BRYTT to neglect latency in FIR filter and show phasedelay in IIR filter.
Point was to show when going steep filters as they do in that paper things can quickly accelerate distortion wise not only for FIR filters but also IIR, that FIR filters if they asked also to filter/repair in time domain present a overall system delay think should be well known.
torgeirs,
Not only FIR filters can distort going steeper slopes also IIR makes their signature that we in past were forced to live with 🙂
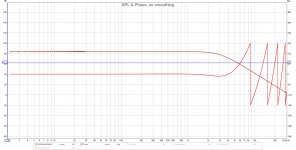
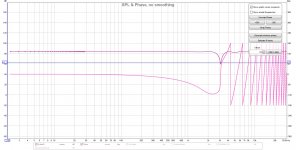
Subwoofer filter LR 8th order at 80Hz verse linear phase inside a 20Hz-20kHz IIR pass band.
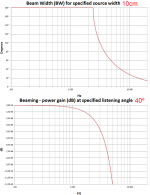
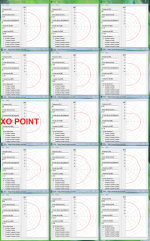
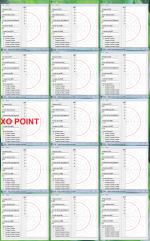
Taking care of in design spacing distance to improve inter driver distances when moving off axis think should make also steep FIR filters work, mark100 mention coxial and wesayso have mentioned Synergy which will bring spacing very close but also as in above 80Hz example there should be possibility real life to get driver spacing within 1/8 wavelength (53cm). A midwoofer with 10cm piston and subwoofer with 26cm piston will at and around 80Hz have same polars as seen in first couple pictures below and going steep filter 96dB/oct and short spacing 1/8 wavelength (picture four) verse 12dB/oct 1/4 wavelength (picture three) actually show excellent polar point source integration as seen in Xdir visuals.
Attachments

@sax512, I agree. I don't think audibility of time offset has anything to do with audibility of pre-ringing.
I'm not so sure peering into filtered impulse responses means anything. I don't fully understand what you're saying, but i think you are hitting at this too.
The only pre-ringing in impulse responses that I work to remove, is when the response is taken from a full range system.
I never talked about audibility of time offset vs pre-ringing. I guess I'm losing you here. But anyway..
My point is that, especially with a full range system, an output that looks like this:
Sinc Function -- from Wolfram MathWorld
is completely fine (actually, you could only wish it looked like that), if it is the output of a linear phase brickwall filter excited with an impulse (Dirac delta).
The fact is, there is no such thing in real life as a Dirac delta, nor there is a linear phase brickwall filter.
But if there were, then the sinc function above is what you would measure at the output of your filter. You can't see it from that picture, but there are infinite ripples pre and post peak (it is symmetric).
I guess I don't understand why you want to remove the ripples before the peak. It might not be instinctive to understand, but I assure you (and someone else with a mathematical background could back me up) that those ripples are not there by mistake or some kind of bad FIR design result.
Last edited:
I never talked about audibility of time offset vs pre-ringing. I guess I'm losing you here. But anyway..
My point is that, especially with a full range system, an output that looks like this:
Sinc Function -- from Wolfram MathWorld
is completely fine (actually, you could only wish it looked like that), if it is the output of a linear phase brickwall filter excited with an impulse (Dirac delta).
The fact is, there is no such thing in real life as a Dirac delta, nor there is a linear phase brickwall filter.
But if there were, then the sinc function above is what you would measure at the output of your filter. You can't see it from that picture, but there are infinite ripples pre and post peak (it is symmetric).
I guess I don't understand why you want to remove the ripples before the peak. It might not be instinctive to understand, but I assure you (and someone else with a mathematical background could back me up) that those ripples are not there by mistake or some kind of bad FIR design result.
Yes, the I agree part was concerning the math behind impulse responses.
Everything past that was just my new ramblings, sorry for any association that didn't apply.
When I say I want to remove ripples, I mean I try to achieve as close to a "perfect impulse" as possible, diminishing ripples both pre and post.
Frankly, I've found that simply getting magnitude and phase as flat as possible is the best way I've found to achieve that.
I'm beginning to think all the various plots we look at are all telling us the same thing, just from different approaches. Get one set right, you get em all right. I mean, they all come from the same data right? There I go rambling again....
Interesting BRYTT, I have some difficulties seeing the details of the the last picture.
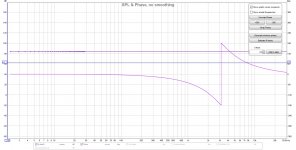
@POS or others: I tried to import a 24 db LR FIR filter from RePhase to REW via the enclosed zipped wavefile. The strange thing is the phase response in REW. It does not correspond to theory and RePhase graphics.
Do only I get that result?
@POS or others: I tried to import a 24 db LR FIR filter from RePhase to REW via the enclosed zipped wavefile. The strange thing is the phase response in REW. It does not correspond to theory and RePhase graphics.
Do only I get that result?
Attachments
Last edited:
Try compare third pictures beaming below and above XO point to the excellent polar that last picture show and conclude that steep slope can perform excellent if spacing of drivers is low enough.
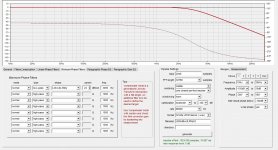
Regarding your 24dB LR FIR filter imported to REW try hit "Estimate IR Delay" and phase will now show right turned 180º around 3kHz point. That said you created it on "Minimum-Phase Filters" tab so its a normal IIR filter, go to "Linear-Phase Filters" tab to create as FIR filter.
Regarding your 24dB LR FIR filter imported to REW try hit "Estimate IR Delay" and phase will now show right turned 180º around 3kHz point. That said you created it on "Minimum-Phase Filters" tab so its a normal IIR filter, go to "Linear-Phase Filters" tab to create as FIR filter.
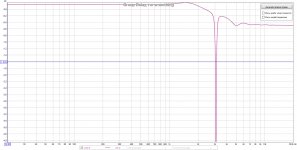
Yes the intention was to make a FIR Minimum phase filter, to look at the group delay and maybe experiment a little with time shifts between summed filters.
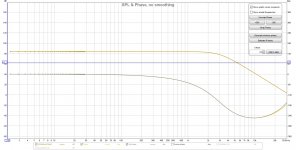
After following your steps I could sum LP and HP to get the normal response (no time delay).
After following your steps I could sum LP and HP to get the normal response (no time delay).
Attachments
Yes, the I agree part was concerning the math behind impulse responses.
Everything past that was just my new ramblings, sorry for any association that didn't apply.
When I say I want to remove ripples, I mean I try to achieve as close to a "perfect impulse" as possible, diminishing ripples both pre and post.
Frankly, I've found that simply getting magnitude and phase as flat as possible is the best way I've found to achieve that.
I'm beginning to think all the various plots we look at are all telling us the same thing, just from different approaches. Get one set right, you get em all right. I mean, they all come from the same data right? There I go rambling again....
You've got it. It's all the same data, just presented different and to be able to read every plot from that data will make it all become much clearer.
Cleaning up an impulse will clean up all related graphs. Just know the impulse representation is a rendering of what's happening. Useful as is, just use the other presentation forms and graphs to confirm its behaviour.
All of the plots can tell you something slightly different. Learning to read them is time well spend i.m.h.o.
One could create a Dirac pulse in RePhase and read it with REW and see what the perfect response looks like. Make use of the filtered IR tab and use the filters to see what it looks like if you apply such a filter. With a filter applied, look at the IR representation. It will look different from the total IR you're used to.
Compare to your own measurements to learn where and how it deviates from that ideal Dirac pulse.
Realise a measurement at short distance can be different from a measurement further out. Look at individual driver to mic distances and see how these changes affect the measurement at the listening distance.
Another even more useful exercise might be to make two IR's (with the crossovers you use 'or plan to use' in real life) in Rephase, based on a theoretical ideal, generate the IR and read them into REW and sum them. You'll need to include time alignment for them to add up just right.
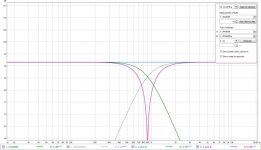
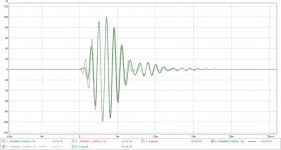
A Linkwitz Riley example I've posted somewhere before:
Seen here are the sum (flat line) the separate drivers (green and grey) and one driver inverted (big dip). A virtual exercise in REW with the crossed over IR's created in RePhase.
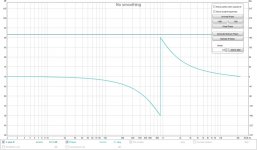
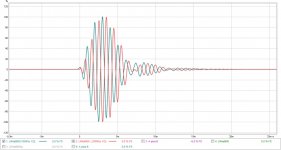
If I filter the separate drivers at 1000 Hz (the real crossover is at 900 Hz in this example) on the filtered IR tab I get this:
I used the overlay function to show both drivers at once, filtered on the filtered IR tab at 1000 Hz 1/3 octave and move back to the IR tab to see it's shape there.
Summed FR and phase plot of the crossover I wanted to create here:
Perfect sum at 900 Hz, one driver (IR delayed on the IR tab) delayed to make them sum like this (summing them on the SPL tab).
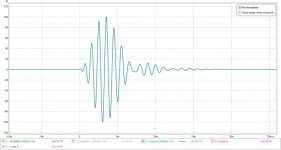
Looking at that same filtered IR's at 1000 Hz will look quite different if I don't time-align the drivers:
See how the drivers don't align with each other? In other words they will not sum perfectly at the crossover.
We all know the theory, I hope I'm not offending anyone here. It could help to play with these theoretical examples of the (almost) perfect version of what we want to create. See how it should look and why it sums like it does. Looking at all the different plots and tabs in REW and their relation to each other.
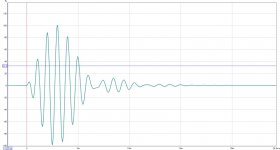
This first example, the one with the two drivers that line up at 1000 Hz:
(looking at a point very close to the crossover point at 900 Hz) add up ideally and when I filter that one at 1000 Hz (still using 1/3 octave) it looks like an almost ideal response:
This is how these drivers should add up.
Compared to a pure Dirac pulse filtered at 1000 Hz (1/3 octave):
Almost the same result.
All these examples are of a normal IIR Linkwitz Riley crossover (at 900 Hz) virtually created in RePhase and summed in REW. Still this might be a useful exercise for some to get a grip on these graphs within REW.
I hope this helps. If it isn't helping you, just ignore it. 🙂 Many more tabs to look at though this will probably do to get started.
Last minute edit: I see some have already started, I typed all of this already so I'll just post it...
Attachments
The frequency response of the filter is the Fourier transform of the filter impulse response. The mathematical impulse response. Not, for example, the ones from the article that mark100 posted, which may lead you to believe there are more than one impulse responses.
So yes, it's all the same info. The impulse response is a time domain description of the filter behavior, the filter spectrum (with phase) is a frequency description of the same behavior.
A word of advice, if I may. I think it is counter productive to just start from an impulse response, especially if measured with methods like those in that article, and remove pre and post ripples at will.
A word of advice, if I may. I think it is counter productive to just start from an impulse response, especially if measured with methods like those in that article, and remove pre and post ripples at will.
I agree. The engineering way to do it, is to use different windows for a given FIR length. Quite some math and experimenting has gone into making those windows. RePhase gives us quite a choise of windows lucily🙂
@wesayso: Thank you for the tutorial.
Just thinking aloud: It would be nice to have a program that showed what happen when inserting time delay between filters. Say between 0 to 1 ms in n steps. That covers most cases of of axis timing difference eg. 0 to 34 cm difference between drivers/filters. Maybe the first 0.3 ms is most important.
As shown, REW can do it typing each delay, but it is a little tedious.
Glad to be of help...
It would be interesting, though this (possible) distance variation made me concentrate on designs that have an advantage there. Like a Synergy concept or my own line arrays.
At least a test like this will show that if you design and measure a multi way setup up close, it may have differences in response at listening distances. Not to mention the off axis (vertical off axis giving the most variations) changes.
- Home
- Design & Build
- Software Tools
- rePhase, a loudspeaker phase linearization, EQ and FIR filtering tool