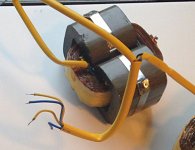
Here's a picture of an ESL63 transformer that I found on the Internet.
It's hard to see, but it looks almost as if the core is monolithic with small chips broken from the upper left edge.
So when someone is in the position to take a look, it would be very helpful to confirm whether it is steel or ceramics.
Hans
It's hard to see, but it looks almost as if the core is monolithic with small chips broken from the upper left edge.
So when someone is in the position to take a look, it would be very helpful to confirm whether it is steel or ceramics.
Hans
Attachments
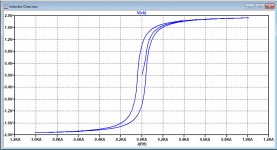
The very best I can get with acceptable silicon steel transformer core values is 3.7% distortion over the speaker terminals with 1R in series and 6Volt rms @ 10Hz applied, giving 15.3% distortion on the secondary.
This is with HC=39, Bs=2.0, Br=1.0, A=1.3m, Lp=0.16 and N=49.
See image. Vertical B axis in Tesla, Hor axis H in A/m.
With 6 Volt pk instead of rms, I get resp 1.4% at the speaker terminals and 5.6% secondary.
So what did the Danish testers apply, a 6Volt pk or a 6Volt rms ?
@ESL 63, maybe you could check the original Danish text in the article if the mention anything about rms or peak ?
Hans
Attachments
Hi Hans,
I had a quick look at the text. Nothing conclusive other than it states that the measurement was made using a generator and voltages 1 to 3 Volt in series with 600 ohm. I would assume that means rms.
Mogens
I had a quick look at the text. Nothing conclusive other than it states that the measurement was made using a generator and voltages 1 to 3 Volt in series with 600 ohm. I would assume that means rms.
Mogens
The text also says that the impedance, in the limited range of current, is very non-linear due to saturation in the transformer.
The text also says that the impedance, in the limited range of current, is very non-linear due to saturation in the transformer.
Hi Mogens,
Of course it was you who provided the article.
Sorry for confusing you with ESL 63.
When nothing is mentioned about rms or peak, I will have to assume it was 6 Volt peak. That corresponds with their measurement. There’s no way I can get 1.4% with 6Volt rms.
That’s wy I will do the other measurements from the magazine with V peak and report the results.
Hans
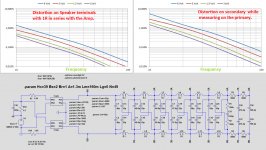
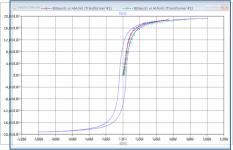
This is what I got with 1R in series with the Amp while measuring on the Speaker terminals.
Voltages as shown are peak voltages of resp 1, 1.5, 3 and 6 Volt pk.
The 6 Volt line is spot on with the 6 Volt Danish test that Mogens provided.
While measuring on the Speaker terminals, I also measured the distortion on the secondary side of the transformers, see upper right part of the image. This distortion appears to be some 10 to 12dB higher as on the speaker terminals.
The schematic diagram that was used for testing is already updated with the capacities that Demian has measured.
Hans
Attachments
I can also read danish... In the diagram shoving distortion, they state 3 Vrms. Page 5.
"Frequency response 2m distance in lab (i guess anechoing chamber) without gating. The distortion curves is attenuated 50dB. Soundpressure (@2meter) was 87dB, 3Vrms on speaker terminals. and they state that distortion is remarkable low."
As we all know and love.
Page 6.
Intermod. Forvaengning= Intermodulation distortion
"30 on the top curve, 50 Hz on lower curve together with a sweep.The high distortion comes from dopplerdistortion from unlinearity in step up transformers"
This tells us that 30Hz is giving approx 15dB higher distortion than 50 Hz.
Thank you for reading.I can also read danish... In the diagram shoving distortion, they state 3 Vrms. Page 5.
But you refer to picture 4 or 5, while I was talking about picture 6.
See below.
Hans
Attachments
...This is with HC=39, Bs=2.0, Br=1.0, A=1.3m, Lp=0.16 and N=49. See image. Vertical B axis in Tesla, Hor axis H in A/m.
With 6 Volt pk instead of rms, I get resp 1.4% at the speaker terminals and 5.6% secondary.
So what did the Danish testers apply, a 6Volt pk or a 6Volt rms ?
I took the tabulated V & I data from my 20Hz measurements and calculated resulting B-H data points.
Overlaying your simulation on top of my measured data...matches much better than I expected.
It is odd that several of the figures specifically call out Vrms, but the distortion plot you are trying to match just says V.
I would still think it is a Vrms value, but could be wrong.
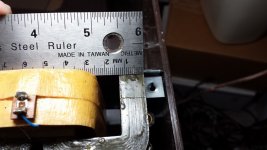
Attached is a pic I took to show core dimensions, which also clearly shows the steel laminations....when someone is in the position to take a look, it would be very helpful to confirm whether it is steel or ceramics.
Attachments

Last edited:
I took the tabulated V & I data from my 20Hz measurements and calculated resulting B-H data points.
Overlaying your simulation on top of my measured data...matches much better than I expected.
It is odd that several of the figures specifically call out Vrms, but the distortion plot you are trying to match just says V.
I would still think it is a Vrms value, but could be wrong.
Attached is a pic I took to show core dimensions, which also clearly shows the steel laminations.
Steve,
It's almost hard to believe that we are so close with our BH curves.
In your image the vertical axis goes from -20 to +20, while mine goes from -2.0 Tesla to +2.0 Tesla.
Your +20 probably also mean Bs = 2 Tesla, because I don't think that silicon steel exists with a Bs that is higher than 2.0, do you agree ?
Also great to see that many things are now covered like:
Silicon steel, LP, A and N.
I'm eagerly waiting for the VNA measurements from Demian with his Bode 100.
Hans
My B calculations were in units of Gauss (1T = 10000 Gauss).Steve,
It's almost hard to believe that we are so close with our BH curves.
In your image the vertical axis goes from -20 to +20, while mine goes from -2.0 Tesla to +2.0 Tesla.
Your +20 probably also mean Bs = 2 Tesla, because I don't think that silicon steel exists with a Bs that is higher than 2.0, do you agree ?
Also great to see that many things are now covered like:
Silicon steel, LP, A and N.
I'm eagerly waiting for the VNA measurements from Demian with his Bode 100.
Hans
Appologies for the mixed units...and not including them in the plot.(I added them to the legend)
During lunch I plotted up measurements from the other transformer.
The curve is stretched a bit to the side which is usually indicative of a small airgap.
Attachments
It is odd that several of the figures specifically call out Vrms, but the distortion plot you are trying to match just says V.
I would still think it is a Vrms value, but could be wrong.
.
There is more a bit weird with this image than just V.
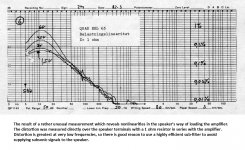
Below 10Hz distortion is going down while there is no reason for that, so I assume their amp has a rumble filter of some sort starting at 20 Hz.
In that case the distortion at 10hz without rumble filter will be higher as shown, so at the end their voltages could be rms voltages.
The other thing that I don’t get is that the first part of the 6 Volt curve from 10 Hz up to 50 Hz goes down with 12dB/oct which is to be expected with a second order LC system.
But then from 50 Hz and upwards in frequency, all distortion curves are coming together and continue to go down with 6dB/oct.
What could be the cause of that, in my sims all distortion curves have a permanent slope of 12dB/oct. Could it be that this is the distortion from the amp itself ?
Hans
It certainly could be the case that distortion from the amp is contaminating the measurement.Could it be that this was the distortion from the amp itself ?
For an example of this, see distortion curves I posted for my ESL transformer at 20Vrms.
You can see that the majority of the distortion is coming from the amplifier.
See Attachment #3 (red curve is distortion at amplifier output, yellow curve is distortion at transformer secondary)
About to take the ESL plunge
I recently acquired a Hypex N-core amplifer module to address this problem.
So nice to have such a uniformly low distortion floor when trying to test linearity of other parts of the signal chain.
Pict 6 is most likely RMS. Based upon that the other measurements is that. and that thats the standard way to do it.
I have a dipole subwoofer as a stand for ESL 63.
2x 15" speakers with extra bucking magnets, not very far from the ESL 63 base ... all those inductors and the two transformers just 15cm or 6" from the magnets.
Thats not good.
Can you simulate a static permanent magnetic field trough the transformer core?
The vector sum of x y and z I measured is 20 Gauss (0.002Tesla) on top of the subwoofer.
How many does not have their Quads on top of a permanent magnet?
Is it a problem? I wonde what kind of forces it is on the Inductor coils, and what if you palce a steel plate on the bottom of the QUADs.... then you will interfear heavily on the delay line indutors (he bottom plate is aluminium, not by coincidence i guess) So best place to shield the field must be as close to the permanent magnets on the subwoofer.
Mark Rehorst's Tech Topics: Quad ESL-63 Speakers
Mark Rehorst has done some spice modeling.
Thanks for the link.
The current model has more accurate diaphragm capacitances and delay line coils.
His coils are exactly the same as a single 2.25H coil.
In my model I also included ser and par resistances and a par capacitance.
Future measurements will make these values even more accurate.
Hans
I have a dipole subwoofer as a stand for ESL 63.
2x 15" speakers with extra bucking magnets, not very far from the ESL 63 base ... all those inductors and the two transformers just 15cm or 6" from the magnets.
Thats not good.
Can you simulate a static permanent magnetic field trough the transformer core?
The vector sum of x y and z I measured is 20 Gauss (0.002Tesla) on top of the subwoofer.
How many does not have their Quads on top of a permanent magnet?
Is it a problem? I wonde what kind of forces it is on the Inductor coils, and what if you palce a steel plate on the bottom of the QUADs.... then you will interfear heavily on the delay line indutors (he bottom plate is aluminium, not by coincidence i guess) So best place to shield the field must be as close to the permanent magnets on the subwoofer.
I gave your posting some thoughts, but I think the problem is of academic proportion with respect to the transformers.
Given the fact that the induced flux in the transformer moves between +/- 2 Tesla, my feeling is that a shift of 2e-4 Tesla can do very little harm, apart from the further weakening of this 2e-4 T by the Alu bottom plate and cage around the transformer.
I have currently too little info on the flux magnitudes in the delay line coils to give my opinion on that, but intuitively I would say that there can't be a problem here either.
Hans
- Home
- Loudspeakers
- Planars & Exotics
- QUAD 63 (and later) Delay Line Inductors