That's very odd. The force on the diaphragm should simply be the field strength caused by the voltage between the stators times the charge on the diaphragm, and that charge is supposed to be proportional to the polarizing voltage.
This is assuming that without audio signal, the diaphragm is nicely centred between the stators. If it gets closer to one of the stators with increasing polarizing voltage, the charge increases more than proportionally with the polarizing voltage - but then the sound pressure level should increase more rather than less than proportionally, as long as the diaphragm doesn't stick to the stator.
It also assumes that there is no leakage current high enough to disturb the voltage across the diaphragm. If there is significant leakage, it will probably get worse with increasing voltage and limit the sound pressure increase.
The only remaining uncertainity is the 600Vrms.
When this would be substantially higher, the VDR will keep the Bias at 5.3KV, but the distance to the Bias when applying 140V mains will become smaller.
I’ll try to find out with a sim what voltage will be needed to get a 1.7dB lower Bias voltage at 140V input voltage.
Hans
When this would be substantially higher, the VDR will keep the Bias at 5.3KV, but the distance to the Bias when applying 140V mains will become smaller.
I’ll try to find out with a sim what voltage will be needed to get a 1.7dB lower Bias voltage at 140V input voltage.
Hans
A programmable VDR in LTSpice gave me the possibility to simulate the clamping function.
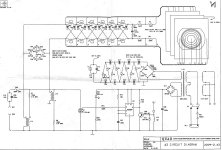
Using the circuit diagram in the first attachment, I copied all resistors, 56K, 189K and 2*220K.
Obvious as a first conclusion is, that to get the specified 5.25KV with the given resistor values, the VDR has to clamp at 750V DC, so the S10K460 that was found on the internet can't be correct here because it clamps at 610V DC.
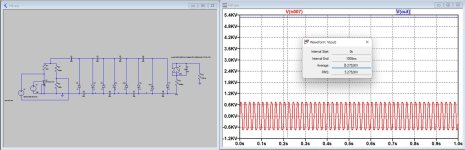
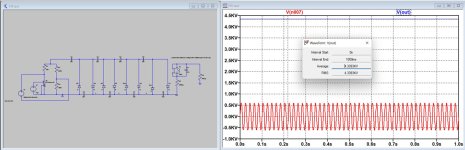
Now to get the 1.7dB difference that I measured in sound production between 225Vrms and 140Vrms mains input, the transformer has to produce 990V peak or 700Vrms,
When dropping the mains voltage to 140Vrms, the transformer will produce 616Vpeak or 435Vrms and the Bias voltage becomes 4.34KV.
20*log(5,275/4.339) = 1.7dB.
See both images below.
This simulation will hopefully be very close to the real thing.
As a clamping device, the VDR is indirectly acting as a voltage regulator, preventing the Bias to exceed 5.3KV.
In this setup, the Bias stays constant at 5,27KV down from 990Vpeak to 750V peak transformer voltage, translating into (750/990)*225V = 170Vrms mains.
From thereon, the Bias voltage will drop directly proportional to lowering the mains voltage.
This corresponds perfectly to the above results, because 20*log(170/140) is also 1.7dB.
Hans
Using the circuit diagram in the first attachment, I copied all resistors, 56K, 189K and 2*220K.
Obvious as a first conclusion is, that to get the specified 5.25KV with the given resistor values, the VDR has to clamp at 750V DC, so the S10K460 that was found on the internet can't be correct here because it clamps at 610V DC.
Now to get the 1.7dB difference that I measured in sound production between 225Vrms and 140Vrms mains input, the transformer has to produce 990V peak or 700Vrms,
When dropping the mains voltage to 140Vrms, the transformer will produce 616Vpeak or 435Vrms and the Bias voltage becomes 4.34KV.
20*log(5,275/4.339) = 1.7dB.
See both images below.
This simulation will hopefully be very close to the real thing.
As a clamping device, the VDR is indirectly acting as a voltage regulator, preventing the Bias to exceed 5.3KV.
In this setup, the Bias stays constant at 5,27KV down from 990Vpeak to 750V peak transformer voltage, translating into (750/990)*225V = 170Vrms mains.
From thereon, the Bias voltage will drop directly proportional to lowering the mains voltage.
This corresponds perfectly to the above results, because 20*log(170/140) is also 1.7dB.
Hans
Attachments
@jan.didden
Because with your questions you startet this discussion, could you measure the AC voltage on the transformer that’s feeding the bias circuitry ?
According to the simulation it should be 700Vrms, but it would be nice if you could confirm this.
That will be the final prove that the LTSpice model is correct, at least assuming that you have the same bias schematic as in the attachment of the previous posting.
Hans
Jan, thank you.
Have you any idea what the layout is in your case ?
Does it have the 56K, 180K and the 2*220K like in my sim ?
There are at least 4 different versions with resp 1 and 2 VDR's
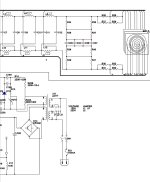
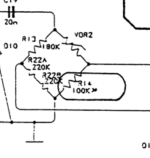
In the current Chinese Quad models the 56K isn't specified but it is only shown as R13 , and the 180K is relaced by a 220K (which btw makes only a very small difference), see attachment.
The VDR while simulating this version will still have to clamp at +/-750 Volt, but with the 640Volt that you measured, the loss in bias voltage when going to 140Vrms mains will now be 2.5dB.
For the older versions with 2*180K and 2* VDR, the VDR clamping voltage will have to be +/-670Volt to get the 5.25KV Bias.
When going to 140Vrms mains, the Bias voltage will drop 1.45dB when starting with 640Vrms from the transformer.
So we can go in all directions, but all have in common that the leakage resistance is 40GOhm and the ripple om the 5,25KV is below 1.5V peak to peak.
Hans
Have you any idea what the layout is in your case ?
Does it have the 56K, 180K and the 2*220K like in my sim ?
There are at least 4 different versions with resp 1 and 2 VDR's
In the current Chinese Quad models the 56K isn't specified but it is only shown as R13 , and the 180K is relaced by a 220K (which btw makes only a very small difference), see attachment.
The VDR while simulating this version will still have to clamp at +/-750 Volt, but with the 640Volt that you measured, the loss in bias voltage when going to 140Vrms mains will now be 2.5dB.
For the older versions with 2*180K and 2* VDR, the VDR clamping voltage will have to be +/-670Volt to get the 5.25KV Bias.
When going to 140Vrms mains, the Bias voltage will drop 1.45dB when starting with 640Vrms from the transformer.
So we can go in all directions, but all have in common that the leakage resistance is 40GOhm and the ripple om the 5,25KV is below 1.5V peak to peak.
Hans
Attachments
Last edited:
Hi,
According to the ER repair guide the transformer should deliver ~690 VAC and it should result in a voltage out of the "bridge" of ~460 VAC.
I seem to remember measuring something like that,
Mogens
According to the ER repair guide the transformer should deliver ~690 VAC and it should result in a voltage out of the "bridge" of ~460 VAC.
I seem to remember measuring something like that,
Mogens
Assuming that you are referring to the latest model with 1 VDR as in #566, your 690Vrms comes close to my previously estimated 700Vrms.
Using a Multimeter with 1MOhm resistance, the 460Vrms that you specify with 690Vrms trafo output becomes in my model 458Vrms.
So we are really getting somewhere !
Hans
Using a Multimeter with 1MOhm resistance, the 460Vrms that you specify with 690Vrms trafo output becomes in my model 458Vrms.
So we are really getting somewhere !
Hans

I've had at least 4 pairs ESL 63 / 989 going through my hands, they all seem different.
The one I have in my hands right now has two VDRs and 220k in one arm and 210k in the other.
One VDR seems to have been replaced with a modern disc-type S10.
The other looks like a large resistor with a black and blue color ring on a light beige body.
It is an older board with a small vertical sub-board with the neon and the R-C parts.
Edit: I also understand that later models ESL 63 had lower bias voltages than the early models, but I have no details.
Maybe ESLPlus can shine some light?
Jan
Last edited:
Hi Hans,
As far as I understand from the guide, the ~460 VAC should apply with both types of supplies. I can't remember which one I measured. I do have both types of supplies around here.
Mogens
As far as I understand from the guide, the ~460 VAC should apply with both types of supplies. I can't remember which one I measured. I do have both types of supplies around here.
Mogens
Hi Mogens,
That seems very logical, since this voltage is directly related to the 5.25KV Bias voltage.
It is to be expected that All ESL63's and beyond have the same Bias voltage, because this relates to the maximum output power.
A lower Bias would mean less power, and that's not the case over the years to my knowledge.
Hans
I don't know about the power but I do know that the bias voltage has been adjusted over the years.
Maybe they also adjusted other parameters to keep the same efficiency?
Jan
Maybe they also adjusted other parameters to keep the same efficiency?
Jan
The panels are still the same over the years as it seems.
Marcel described their working nicely.
Less bias, less force and less SPL.
Hans
Marcel described their working nicely.
Less bias, less force and less SPL.
Hans
The force on the diaphragm should simply be the field strength caused by the voltage between the stators times the charge on the diaphragm, and that charge is supposed to be proportional to the polarizing voltage.
I don't know, maybe the allowed power has gone down.
I only know, on good authority, that the bias has gone down on newer units to below 5kV.
My current pair is lower still, and plays fine.
Jan
I only know, on good authority, that the bias has gone down on newer units to below 5kV.
My current pair is lower still, and plays fine.
Jan
For those wanting to experiment with the Bias voltage, the two models are put together in one .asc file.
The left one based on the latest generation Bias generators with one VDR and the version on the right represents the first version, still having two VDR's.
Difference is also that the later version has a VDR that clamps at 745V and the oldest one with 2 VDRs clamping at 669V.
Because of that the Quad transformers produce resp. 690Vrms and 640Vrms.

This image displays the Vrms from the transformer versus the generated Bias voltage for the most recent version in blue and the oldest version in red, confirming that the older version can be driven with a 50Volt lower transformer voltage.
When the 5.25KV bias voltage has been lowered for recent versions as Jan mentioned, R13 here being 56K in the sim file, has to be lowered, that's all.
Hans

The left one based on the latest generation Bias generators with one VDR and the version on the right represents the first version, still having two VDR's.
Difference is also that the later version has a VDR that clamps at 745V and the oldest one with 2 VDRs clamping at 669V.
Because of that the Quad transformers produce resp. 690Vrms and 640Vrms.
This image displays the Vrms from the transformer versus the generated Bias voltage for the most recent version in blue and the oldest version in red, confirming that the older version can be driven with a 50Volt lower transformer voltage.
When the 5.25KV bias voltage has been lowered for recent versions as Jan mentioned, R13 here being 56K in the sim file, has to be lowered, that's all.
Hans
Attachments
As was stated earlier, there are a couple bias circuits in the ESL63's. the early ones have two VDR's and a pair of 180K resistors to form the bridge:

In practice I have often seen resistors in parallel with one of the 180K resistors to balance two supplies (this is associated with the M12525 rectifier board of which there are several variants). I'm not sure if that was done at the factory or later at a service center. But it's not uncommon.
Later in the 63' production life, the circuit was changed to the single VDR you see up to today. I have two schematics for this era the first is drawing 22-2.63 and shows this:

Then I have 2209-4.63 which shows something drawn differently with a different VDR bias resistor (sorry for the quality), and there is a "selected on test" for the 100K resistor:

So maybe my memory is faulty and the EHT's I see with the piggyback resistors are these newer ones
The 2905 service manual has a VDR resistor of 100K as well:

For the 2912 service manual, they show this:

You have to go digging through the parts list to find out that R13 is 56K.
I am colorblind and as such don't notice the resistor values as readily as others. But I can say that that VDR resistor does play a role in bias level and overall speaker efficiency. I have dialed a set of quads into matching within a fraction of a dB by tailoring that resistor slightly. Here's an example. Quads with the single resistor VDR front end to the EHT have had 56K, 80K and 100K vdr resistors installed at various times in the life of this speaker design. So I use 80K as my baseline and I can adjust the speaker output by varying the resistor slightly. My rebuilds are typically very well matched, here's an example of two speakers measured at the same spot in my shop after a rebuild (no windowing etc):

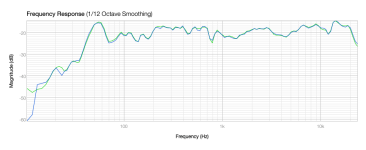
But I have had speakers with mismatched EHT's that I have matched up. In general I use spares and get a matched set, but this is an example for folks who might not have spares. Here's the original speaker pair response:

The one speaker is pretty consistently off by about 1 dB. In order to bring them both into agreement, we will use some data collected on R13's effect on overall speaker efficiency. Here's my model based on variations of R13 and measuring the speaker output and collecting data in the midrange:

When using that data and tailoring R13 in these speakers, I get this result:

I don't think I had my positioning perfect as you can see some differences in the upper octaves where the speaker is more beamy.
Zooming into the lower frequencies where placement should matter less, we can see the level of agreement that can be dialed in if desired:

Keep in mind my plots have no windowing and are thus contaminated by my room effects, but I can also see details in the lower frequencies that are important to me. so don't treat these plots as actual speaker responses, they are a rebuild tool.
Sheldon
In practice I have often seen resistors in parallel with one of the 180K resistors to balance two supplies (this is associated with the M12525 rectifier board of which there are several variants). I'm not sure if that was done at the factory or later at a service center. But it's not uncommon.
Later in the 63' production life, the circuit was changed to the single VDR you see up to today. I have two schematics for this era the first is drawing 22-2.63 and shows this:
Then I have 2209-4.63 which shows something drawn differently with a different VDR bias resistor (sorry for the quality), and there is a "selected on test" for the 100K resistor:
So maybe my memory is faulty and the EHT's I see with the piggyback resistors are these newer ones
The 2905 service manual has a VDR resistor of 100K as well:
For the 2912 service manual, they show this:
You have to go digging through the parts list to find out that R13 is 56K.
I am colorblind and as such don't notice the resistor values as readily as others. But I can say that that VDR resistor does play a role in bias level and overall speaker efficiency. I have dialed a set of quads into matching within a fraction of a dB by tailoring that resistor slightly. Here's an example. Quads with the single resistor VDR front end to the EHT have had 56K, 80K and 100K vdr resistors installed at various times in the life of this speaker design. So I use 80K as my baseline and I can adjust the speaker output by varying the resistor slightly. My rebuilds are typically very well matched, here's an example of two speakers measured at the same spot in my shop after a rebuild (no windowing etc):
But I have had speakers with mismatched EHT's that I have matched up. In general I use spares and get a matched set, but this is an example for folks who might not have spares. Here's the original speaker pair response:
The one speaker is pretty consistently off by about 1 dB. In order to bring them both into agreement, we will use some data collected on R13's effect on overall speaker efficiency. Here's my model based on variations of R13 and measuring the speaker output and collecting data in the midrange:
When using that data and tailoring R13 in these speakers, I get this result:
I don't think I had my positioning perfect as you can see some differences in the upper octaves where the speaker is more beamy.
Zooming into the lower frequencies where placement should matter less, we can see the level of agreement that can be dialed in if desired:
Keep in mind my plots have no windowing and are thus contaminated by my room effects, but I can also see details in the lower frequencies that are important to me. so don't treat these plots as actual speaker responses, they are a rebuild tool.
Sheldon
Attachments

Sheldon, thanks for that comprehensive overview.
I wonder what QUAD was trying to achieve with all those changes.
Do you per chance have an idea of the actual HV bias value with each different configuration?
How much does the bias have to change for a 1dB sensitivity change, is it a linear law (1dB being ~12%)?
Jan
I wonder what QUAD was trying to achieve with all those changes.
Do you per chance have an idea of the actual HV bias value with each different configuration?
How much does the bias have to change for a 1dB sensitivity change, is it a linear law (1dB being ~12%)?
Jan
FWIW, with 230V AC mains, I measured 4.14kV using a HV probe with 100MOhm input resistance.....
When dropping the mains voltage to 140Vrms, the transformer will produce 616Vpeak or 435Vrms and the Bias voltage becomes 4.34KV.
20*log(5,275/4.339) = 1.7dB.
....
Hans
- Home
- Loudspeakers
- Planars & Exotics
- QUAD 63 (and later) Delay Line Inductors