@1audio,
Thanks again for taking the time and effort to post the Bode100 data.
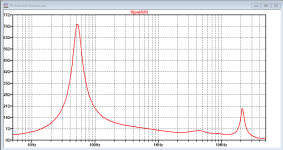
The 2nd order parasitic behavior out to 1Mhz is something I had never seen before. Quite interesting 🙂
Thanks again for taking the time and effort to post the Bode100 data.
The 2nd order parasitic behavior out to 1Mhz is something I had never seen before. Quite interesting 🙂
I would not be too confident of the numbers above 50 KHz since there are many possible parasitics that could sneak in. The transformer was still in the speaker and I disconnected the secondary and one primary lead. I was trying to be careful with both systems but did not do extensive calibrations since the whole setup was balancing against a stepstool threatening to collapse at any time.
Also the actual current/flux in the transformer would be much different with the Praxis measurement than the Bode measurement.
I don't want to touch that speaker again until its owner gets the replacement panels and I can finish it. I'll be happy to remake some measurements then.
Also the actual current/flux in the transformer would be much different with the Praxis measurement than the Bode measurement.
I don't want to touch that speaker again until its owner gets the replacement panels and I can finish it. I'll be happy to remake some measurements then.
Using the primary inductance value from 10Hz to back calculate value for winding capacitance(C1) from resonance frequency is problematic. Unfortunately, the primary inductance isn’t constant because the BH curves are a function of frequency(for Freq > 100Hz), and for any given BH curve the permeability is a function of applied current which falls for increasing frequency because of the inductance. Looking at the data the value of L1 looks to have fallen by factor of two by 1kHz.
I will post a summary of my conclusions later today on the 1st order parasitics. I have never investigated 2nd order parasitic in much detail as they don’t generally affect the response in the audio band. But, I have a few papers on the subject I will need to read up on. Attached is one of the proposed models that is supposed to better define the impedance behavior of the distributed capacitance and leakage inductance.
O.K. So long story short, what you are saying is that calculating C1 with L1 is unreliable because of the changing value of L1 versus frequency and just using LSf is more reliable.
Given 107uF * N^2 = 1.54H for LSf and a resonance at 22.7kHz gives a value for C1 of 32pF.
This means that the resonance peak at 1.3kHz is caused by a value of L1 of 32.6mH instead of the 65mH that I used.
That makes sense, I can live with this explanation.
I have adjusted my model accordingly with L1 to 32.6mH, LSf to 1.54 and C1 to 32pF.
Both peaks at 1.3kHz and at 22.7kHz are there again, and by adding 110pF to the secondary, it matches Demians measurement with 100pF, but this might well be a tolerance issue of his used cap.
Hans
P.S. the lower resonance peak with the added 110pF should be at 550Hz, but is here a bit too high in frequency. When adjusting L1 to 41mH@550Hz, it matches Demian's graphs in both resonance peaks perfectly.
Attachments

Last edited:
With resp. the corrected leakage inductance and the secondary capacity in Demian's transformer, the differences in FR between the two transformers from Steve and Demian are almost vanished, at least when looking at the signals at the 8 ESL panels, despite all other differences between the two transformers.
But I'm still struggling with CW.
On one hand it could help to solve the problem how to get a peak around 20Khz in the impedance curve.
On the other hand it can have a substantial influence on the HF response of the secondary and both goals don't neatly line up, but at least we should think of values in the order of 100pF.
Then we have the CW of ca 1nF that Demian measured, that is miles away from the two above goals.
Hans
Ok, thanks for explanation. I will hold off attempting to evaluate the second-order parasitics that affect the impedance and response above 50Khz until you can take more controlled measurements on an isolated transformer. Alternatively, I can investigate on a similar transformer. I recently learned that there is Bode type software for my Picoscope that should give me the ability to measure up to 1Mhz.I would not be too confident of the numbers above 50 KHz since there are many possible parasitics that could sneak in. The transformer was still in the speaker and I disconnected the secondary and one primary lead.
That makes perfect senseP.S. the lower resonance peak with the added 110pF should be at 550Hz, but is here a bit too high in frequency. When adjusting L1 to 41mH@550Hz, it matches Demian's graphs in both resonance peaks perfectly.

Another check for the 100pF case is the series resonance frequency between leakage inductance and (C1=32pF + 100pF).
Adding the 100pF moves the series resonance from ~23kHz to ~11.4kHz with good match between model and measurements.
This reminded me, I had posted a simple spreadsheet for plotting transformer/ESL impedance and response some years ago that people might find useful.
ESL electronics 101 for the electronics challenged
If you shift the majority of the leakage inductance to the secondary side as I had suggested previously this should solve both issues. Based on geometry, I would estimate only 10% to 15% of the leakage inductance should be lumped on the primary side. Unfortunately, there is no simple way to measure this, although I am wondering if the impedance measurements up to 1Mhz may also provide guidance.…I'm still struggling with CW.
On one hand it could help to solve the problem how to get a peak around 20Khz in the impedance curve.
On the other hand it can have a substantial influence on the HF response of the secondary and both goals don't neatly line up…
Oh, I also just noticed you have the shunt resistance representing core losses on the wrong side of the primary leakage inductance in you LTspice model. The placement change should only have a small influence though.
The 1nF measurement is representative of the capacitance between the primary and the first layer of the secondary assuming uniform voltage along the windings. Taking into account the voltage gradient along the winding, the capacitive load at the first layer of the secondary would be 1/3nF. See layer to layer capacitance calcs attached to Post#28 However, since the secondary has many layers(roughly 36) and the layer closest to the primary is grounded, the effective capacitive load on the whole secondary is (1/3nF) / 36^2 or < 1pF. In other words, it is not a primary capacitive load seen by the secondary winding. This is usually the case for ESL step-up transformers, unless they are hooked up incorrectly with the outer layer of the secondary grounded instead of the inner layer.Then we have the CW of ca 1nF that Demian measured, that is miles away from the two above goals.
Ok, thanks for explanation. I will hold off attempting to evaluate the second-order parasitics that affect the impedance and response above 50Khz until you can take more controlled measurements on an isolated transformer. Alternatively, I can investigate on a similar transformer. I recently learned that there is Bode type software for my Picoscope that should give me the ability to measure up to 1Mhz.
That software works perfectly, that’s what I had used when I would have had a transformer at my disposal.
Hans
You probably missed my graph in #183, the one at the right, because that's exactly how I got the 110pF, by matching the second resonance peak with Demian's graph in #179.That makes perfect sense
Another check for the 100pF case is the series resonance frequency between leakage inductance and (C1=32pF + 100pF).
Adding the 100pF moves the series resonance from ~23kHz to ~11.4kHz with good match between model and measurements.
Hans
As long as no CW is added, it makes no difference where the leakage inductance is placed, however because of the specific placement in my model it differs quite a lot when a CW is placed.If you shift the majority of the leakage inductance to the secondary side as I had suggested previously this should solve both issues. Based on geometry, I would estimate only 10% to 15% of the leakage inductance should be lumped on the primary side. Unfortunately, there is no simple way to measure this, although I am wondering if the impedance measurements up to 1Mhz may also provide guidance.
Using Demian's transformer as an example, with a primary leakage inductance of 17uF (=16%), a secondary of 1.3H (=84%) and a CW of 70pF, I got this impedance curve in the image below.
From your explanation I understand that the measured 1nF can be discarded.
So it seems that we are getting closer and closer to the final model.
Oh, I also just noticed you have the shunt resistance representing core losses on the wrong side of the primary leakage inductance in you LTspice model. The placement change should only have a small influence though.
No measurable difference can be detected when placing the 445R before or after the primary leakage inductance.
Hans
Attachments
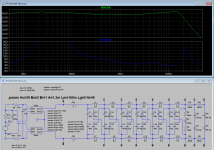
I just encountered a nasty problem.
At the point where the 1R65 resistors on the primary side are contacting the transformers, a 1.5uF cap is placed between them, which I completely overlooked until now.
This Low Pass filter has a serious effect on the FR at the secondary side of the transformer.
Even the slightest CW only worsens the restricted FR problem.
So further experimenting is needed to compensate for this.
Hans
I just encountered a nasty problem.
At the point where the 1R65 resistors on the primary side are contacting the transformers, a 1.5uF cap is placed between them, which I completely overlooked until now.
This Low Pass filter has a serious effect on the FR at the secondary side of the transformer.
Even the slightest CW only worsens the restricted FR problem.
So further experimenting is needed to compensate for this.
Hans
Yes, it's been there since the earliest of the 63's, and is still there today.
http://quadesl.com/modernRefs/63schemEarly.jpg
Yes, it's been there since the earliest of the 63's, and is still there today.
http://quadesl.com/modernRefs/63schemEarly.jpg
True, but so far nobody noticed.
Hans
True, but so far nobody noticed.
Hans
Including me, sorry about that.
Sheldon
I did see the graph, but misunderstood your text concerning matching of series resonance. 😱You probably missed my graph in #183, the one at the right, because that's exactly how I got the 110pF, by matching the second resonance peak with Demian's graph in #179.
Nasty problem? Or maybe mystery solved.I just encountered a nasty problem. At the point where the 1R65 resistors on the primary side are contacting the transformers, a 1.5uF cap is placed between them, which I completely overlooked until now. This Low Pass filter has a serious effect on the FR at the secondary side of the transformer. Even the slightest CW only worsens the restricted FR problem.
So further experimenting is needed to compensate for this.

Add the 1.5uF cap and set Cw to a very low value seems to provide reasonable match for measured impedance and response. I know I was skeptical about how such a large value of Cw was needed to match the impedance peak just above 20kHz when there didn't seem to be a physical reason for it. This is a more satisfying answer, relegating Cw back to the 2nd order parameter list. What do you think?
Attachments
I did see the graph, but misunderstood your text concerning matching of series resonance. 😱
Nasty problem? Or maybe mystery solved.
Add the 1.5uF cap and set Cw to a very low value seems to provide reasonable match for measured impedance and response. I know I was skeptical about how such a large value of Cw was needed to match the impedance peak just above 20kHz when there didn't seem to be a physical reason for it. This is a more satisfying answer, relegating Cw back to the 2nd order parameter list. What do you think?
Steve,
Thank you for this contribution and it looks promising.
Unfortunately Demian's transformer responds differently.
So I need a bit more time to capture both under the same conditions.
And what I don't like so much is a FR that is down 4-6dB at 20kHz.
Cw still seems to be necessary, and almost directly when Cw is applied, it comes very precise how the leakage inductance is divided over primary and secondary.
Hans
When playing again with the files, I noticed that in Demian's model I had added 1.5nF instead of the 1.5uF in Steve's model.
That caused the differences that I saw, what a silly error.
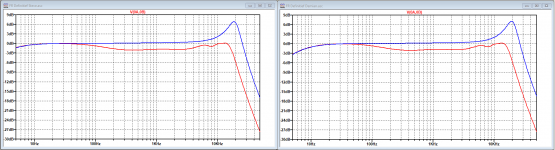
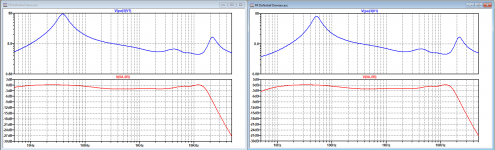
I went the whole way back to Steve's recording in #19, showing the secondary response without and with different delay line loads when loaded with a 2.7Meg//5pF differential probe, see first image below.
To replicate that as accurate as possible, I had to add a serial resistance of 50k to the secondary Csf to limit the peak to somewhere between 7 and 7.5dB, see second image below.
But as it turned out later with the complete model, this 50K resistor has hardly any influence and could just as well be left.
Now with everything in place I made the third simulation of the full model, Primary Impedance curve and FR directly on the secondary.
As can be seen, the difference between both transformers from Steve to the left and Demian to the right is just the FR below 10Hz, that's it.
And yes Steve was right, the 1.5uF did not create a problem, but completely solved the 20kHz impedance mystery peak.
No Cw isn't playing a role anymore and I think we can call it a day with the final LTSpice models added below
Hans
That caused the differences that I saw, what a silly error.
I went the whole way back to Steve's recording in #19, showing the secondary response without and with different delay line loads when loaded with a 2.7Meg//5pF differential probe, see first image below.
To replicate that as accurate as possible, I had to add a serial resistance of 50k to the secondary Csf to limit the peak to somewhere between 7 and 7.5dB, see second image below.
But as it turned out later with the complete model, this 50K resistor has hardly any influence and could just as well be left.
Now with everything in place I made the third simulation of the full model, Primary Impedance curve and FR directly on the secondary.
As can be seen, the difference between both transformers from Steve to the left and Demian to the right is just the FR below 10Hz, that's it.
And yes Steve was right, the 1.5uF did not create a problem, but completely solved the 20kHz impedance mystery peak.
No Cw isn't playing a role anymore and I think we can call it a day with the final LTSpice models added below
Hans
Attachments
Would this suggest that the input network is necessary for the proper function of the speaker, I have seen people advocate removing it. I would also be interested to know what difference adding the 2 extra panels as in the 2905, Quad kept the resistors at the end of the line the same value which looked odd to me.
Stuart
Stuart
The extra added panels in the 6 panel models requires a modifikation of the resistors R6 and R8 from 360k Ohms to 720k Ohms.
I have elaborated with those and R5 R7 to decrease the higher frequency content of the outermost ring. This ring is "beaming" higher frequencies and makes the speaker a little bit to much directive for my taste.
I have promised to put up all my measurements and it´s in my backlogg.
Stuart you are right, after Walkers huge efforts creating the best speaker in the world, QUAD seems to have halted the deveopment.. :-(
Would this suggest that the input network is necessary for the proper function of the speaker, I have seen people advocate removing it,
Stuart
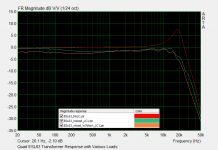
The only visible effect of the 1.5uF at the input network is the impedance peak slightly above 20kHz.
On the FR it has hardly any visible effect.
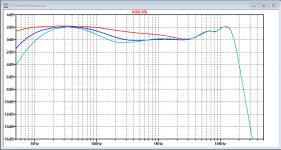
However, there is often discussion about the 1R5 // 220uF at the input.
Philips had this resistor shortened in their Studio Monitor, but some do the opposite and increase the value to 3R // 220uF.
This has definitely effect on the FR as can be seen in the Image below, resp. from top to bottom, shortened (red), 1R5 (blue) and 3R (Cyan).
Hans
Attachments
Would this suggest that the input network is necessary for the proper function of the speaker, I have seen people advocate removing it. I would also be interested to know what difference adding the 2 extra panels as in the 2905, Quad kept the resistors at the end of the line the same value which looked odd to me.
Stuart
For the record, I've NEVER advocated removing the input network. It makes a measurable difference, and now you can see that the model also confirms it.
Quad not changing the delay lines for the extra two panels is classic Quad these days. It appears that they have zero engineering people working on the guts of the speaker. The panels are identical, the clamp circuit is identical, the HV power supply is identical and the input and delay lines are identical to the latest ESL-63 design. The only change they made was to ad a weird transistor circuit to drive the LED logo on the front.
In fact the resistor for the power LED is running at its power limit, and for a LOT of years (until the 2805 mid production I believe) they had a 16V filter cap in the low voltage power supply, and that supply runs at or slightly above 16v in the USA.
It would be very interesting to see how two extra bass panels changes the speaker response.
Sheldon
- Home
- Loudspeakers
- Planars & Exotics
- QUAD 63 (and later) Delay Line Inductors