Attached are the impedance plots. This time the file is in the zip.
For distortion I was measuring the transformer with nothing attached except the 1 Ohm current sense resistor. The measurement is the distortion across the transformer. I confirmed there is typically 20 dB less distortion at the amp output.
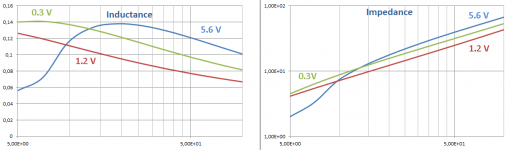
Here are the Inductances belonging to your recent impedance curves.
I have the strong feeling that 1.2 V and 0.3 V are switched ??
But the results are interesting, showing how inductance is a function of both frequency and level, just as Steve also showed us.
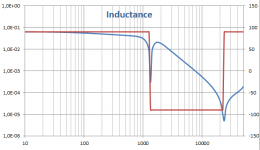
What I don't understand, is that in your previous Bode100 measurements, see second image below, inductance was stable from 10Hz to 100Hz with between 100mV and 330mV on the transformer.
This is in the same level of magnitude as your current 0.3 Volt.
Somehow this seems conflicting ??
So my question: how did you measure the inductance, with a resistance in series, if so what was the value of this resistance and was it with an unloaded transformer ?
Hans
Attachments
The measurements may have been swapped. There were made directly across the primary using a 1 Ohm resistor in series comparing the voltage across the resistor to the voltage across the DUT. I confirmed the setup with some reference resistors. The secondary was unloaded. The Bode doesn't have enough power to drive this hard. I could set it up with a power amp.
At 5VRMS the transformer core starts buzzing at 15 Hz. At these low frequencies the transformer is really 1/2 Ohm so 4V is 3A with a significant phase angle making the amp less happy as well.
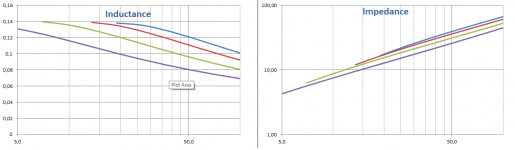
A fresh set of measurements are attached. I think these hold up better. At lower frequencies (5 Hz) there is an odd increase and then decrease but at 20 Hz and above the trends do make sense.
At 5VRMS the transformer core starts buzzing at 15 Hz. At these low frequencies the transformer is really 1/2 Ohm so 4V is 3A with a significant phase angle making the amp less happy as well.
A fresh set of measurements are attached. I think these hold up better. At lower frequencies (5 Hz) there is an odd increase and then decrease but at 20 Hz and above the trends do make sense.
Attachments
When simulating your transformer with 1 Ohm in series, the current that's flowing at 5Hz@4V is no longer a 4 V rms signal because of saturation effects, see first image below.The measurements may have been swapped. There were made directly across the primary using a 1 Ohm resistor in series comparing the voltage across the resistor to the voltage across the DUT. I confirmed the setup with some reference resistors. The secondary was unloaded. The Bode doesn't have enough power to drive this hard. I could set it up with a power amp.
At 5VRMS the transformer core starts buzzing at 15 Hz. At these low frequencies the transformer is really 1/2 Ohm so 4V is 3A with a significant phase angle making the amp less happy as well.
A fresh set of measurements are attached. I think these hold up better. At lower frequencies (5 Hz) there is an odd increase and then decrease but at 20 Hz and above the trends do make sense.
Because of that an impedance measurement gives wrong results.
That's why I have only calculated the inductance for those cases where the distortion is equal or lower than 10%.
That results in the second image below, now all curves ending at 0.14H.
At 100 Hz, when going down, you see resp. 4V, 2V, 1.25V and 0.6V.
But it still does not answer the question why your Bode100 indicated a stable 0.63H from 10Hz to 100Hz.
Hans


Still thinking loud:
a small resistance like 1 Ohm, enables high amount of current flowing into the transformer, almost 4Amp at 4Vrms.
When using a large resistor this is prevented, thereby acting as a "distortion reducer" and giving a more reliable outcome.
with the Bode100 in shunt, series resistance was 25R, thereby limiting the current to 40mA@1V
With Praxis a 200R resistor was used while steering with 5.6V rms, limiting the current to 28mA.
But it is just part of the explanation that you should prevent the core from going into saturation while measuring inductance, but it doesn't still explain why the Bode100 gave a nice flat inductance from 10Hz to 100Hz and the 1R series resistance does not.
But the above also applies to Steve's graph IMO showing inductances at 20Hz and 60Hz versus applied voltage.
I don't know the value of the series resistance used, but everything right from 60Hz@13V and from 20Hz@4V indicates that the core is going into saturation and the the inductance measurement becomes crippled and the outcome invalid.
Hans
Last edited:
Was the secondary open or shorted? I guess that is important as well...
With the secondary shorted, inductance is only 100uH.
So this is all with the secondary open.
Hans
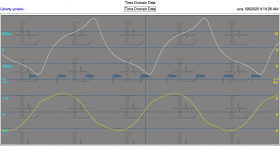
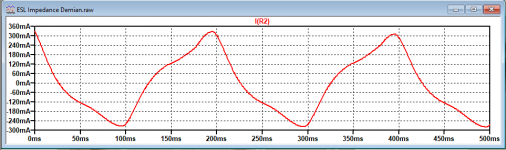
Clearly saturating. Here is the waveform with 2V at 50 Hz. There are also rolloffs I have not checked or corrected at 5 Hz. The lower trace is the resistor, the upper across the transformer primary with secondary open. It would be challenging to get a correct inductance from this.
Attachments
If you have a large resistor in series with the transformer you are using a much smaller drive at the transformer. For low level stuff that's fine. It won't show what is happening at higher drive. Given the acoustic output of a Quad 63 drops a lot starting at around 50 Hz or higher the 5 Hz response is not an issue (but its wise to keep the LF out of the speaker) still for modeling the transformer this will help describe the magnetic circuit limitations.
If you have a large resistor in series with the transformer you are using a much smaller drive at the transformer. For low level stuff that's fine. It won't show what is happening at higher drive. Given the acoustic output of a Quad 63 drops a lot starting at around 50 Hz or higher the 5 Hz response is not an issue (but its wise to keep the LF out of the speaker) still for modeling the transformer this will help describe the magnetic circuit limitations.
I think that the magnetic limitations are relatively well under control.
See image below when I sim a 2V 5Hz signal trough a 1 Ohm resistor.
It has exactly the same shape as yours.
Hans
Attachments
Demian,
It's safe to conclude that your primary inductance is 140mH, as opposed to Steve's transformer with 250mH.
So let's keep it there. I will complete the model of your transformer, just as I did for Steve's version.
I will show the results this week.
Many thanks for all the time you invested.
Hans
It's safe to conclude that your primary inductance is 140mH, as opposed to Steve's transformer with 250mH.
So let's keep it there. I will complete the model of your transformer, just as I did for Steve's version.
I will show the results this week.
Many thanks for all the time you invested.
Hans
Because of the nice weather with a bit of delay, here are the results of the two transformers that were measured resp. by Steve and by Demian.
I modelled the transformers to give results that were as close as possible to the various measurements.
All parameters between the two are different, but the biggest difference was that Steve's transformer had a primary induction of 250mH, while Demian's was 140mH.
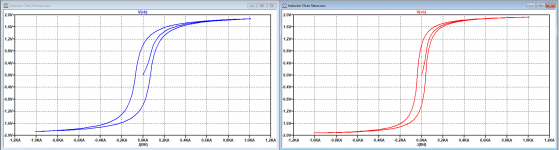
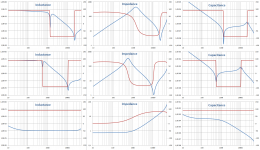
In the images below, you see resp.:
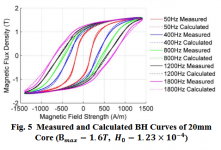
1) the B/H curves Demian left and Steve to the right
2) the impedance curves with both versions, again Demian to the left and Steve to the right.
Demian's version stays nicely above 4 Ohm between 10kHz and 20khz like the real ESL63, while Steve's version almost goes to 2.5Ohm
3) The FR response curves for all individual elements, again Demian to the left.
Steve's version has a bit of a bump around 12kHz that the other one does not have. The other thing that's noticeable is that Steve's version has a FR that goes almost to 40kHz, that differs from the real ESL63.
4) The .asc models and the Trafo sub module that has been used.
I would like to thank Steve and Demian for doing all the hard work and making their results public.
One last remark is that Demian's transformer version produces less distortion at LF and comes closest of the two versions to the real ESL63.
Hans
I modelled the transformers to give results that were as close as possible to the various measurements.
All parameters between the two are different, but the biggest difference was that Steve's transformer had a primary induction of 250mH, while Demian's was 140mH.
In the images below, you see resp.:
1) the B/H curves Demian left and Steve to the right
2) the impedance curves with both versions, again Demian to the left and Steve to the right.
Demian's version stays nicely above 4 Ohm between 10kHz and 20khz like the real ESL63, while Steve's version almost goes to 2.5Ohm
3) The FR response curves for all individual elements, again Demian to the left.
Steve's version has a bit of a bump around 12kHz that the other one does not have. The other thing that's noticeable is that Steve's version has a FR that goes almost to 40kHz, that differs from the real ESL63.
4) The .asc models and the Trafo sub module that has been used.
I would like to thank Steve and Demian for doing all the hard work and making their results public.
One last remark is that Demian's transformer version produces less distortion at LF and comes closest of the two versions to the real ESL63.
Hans
Attachments
Thanks so much for sharing your work.
I can't tell for sure, but looking at your posted images you might be double-dipping on the leakage inductance from 1audio's measurements. I will let you know what I think once I can get the *.asc files to open up.
Currently when I try to open your circuits with LTspice, it only partially loads as it is looking for the transformer symbol file. I think it would be called "Trafo.asy" in the ..\LTspiceXVII\lib\sym\ folder.
Thanks so much for sharing your work.
I can't tell for sure, but looking at your posted images you might be double-dipping on the leakage inductance from 1audio's measurements. I will let you know what I think once I can get the *.asc files to open up.
Currently when I try to open your circuits with LTspice, it only partially loads as it is looking for the transformer symbol file. I think it would be called "Trafo.asy" in the ..\LTspiceXVII\lib\sym\ folder.
Yes, but .asy files can't be dowloaded.
Very easy to make, but here is a zipped version.
Hans
Attachments
Concerning Leakage Inductance: Any impedance measurement made with shorted windings (primary with shorted secondary, or secondary with shorted primary) only tells you what the total leakage inductance is, not what proportion would manifest on the primary or secondary side. All of the measurements that 1audio made with Praxis or with Bode 100, indicate that the total leakage inductance reflected to the primary is about 107μH, or about 1.54 H when reflected to the secondary. In the model posted, both primary and secondary leakage inductances(LPf and LSf) are defined as these measured values. You should only use one or the other. In reality it will be a split, with the vast majority going to the secondary side on a high-ratio transformer like this.
Once you correct the leakage inductance, you will also need to adjust Csp up by a factor of 2 to match resonance frequency in the measurement. This will result in the two models matching more closely.
Concerning Cw: When using Cw as a single lumped capacitance rather than a distribution of an array of smaller capacitors all along the winding layers, I have found impedance and frequency response to match best when all of the leakage inductance is defined on the secondary side(LSf) and primary side(LPf) is set to zero. I don’t know if this is always the case, but with high-step up ratio transformers used for ESLs it seems to provide the best fit. The posted models split the leakage inductance evenly, and you can see two results that don’t fit measurements; an additional frequency peak above 20kHz, and impedance begins to rise with increasing frequency above the last resonance. IN this case, leaving ~10% of the leakage inductance on the primary might be closer to reality.
Concerning Primary Inductance and distortion: You adjusted the core parameters to match the lower primary inductance measured by 1audio. Note that this could also be achieved with addition of a very small air gap on the order of 10μm with the core parameters unchanged. You will also find this reduces the distortion.
All things considered, still amazes me that these Spice models match reality as well as they do.
Last edited:
Steve,Concerning Leakage Inductance: Any impedance measurement made with shorted windings (primary with shorted secondary, or secondary with shorted primary) only tells you what the total leakage inductance is, not what proportion would manifest on the primary or secondary side. All of the measurements that 1audio made with Praxis or with Bode 100, indicate that the total leakage inductance reflected to the primary is about 107μH, or about 1.54 H when reflected to the secondary. In the model posted, both primary and secondary leakage inductances(LPf and LSf) are defined as these measured values. You should only use one or the other. In reality it will be a split, with the vast majority going to the secondary side on a high-ratio transformer like this.
Once you correct the leakage inductance, you will also need to adjust Csp up by a factor of 2 to match resonance frequency in the measurement. This will result in the two models matching more closely.
Concerning Cw: When using Cw as a single lumped capacitance rather than a distribution of an array of smaller capacitors all along the winding layers, I have found impedance and frequency response to match best when all of the leakage inductance is defined on the secondary side(LSf) and primary side(LPf) is set to zero. I don’t know if this is always the case, but with high-step up ratio transformers used for ESLs it seems to provide the best fit. The posted models split the leakage inductance evenly, and you can see two results that don’t fit measurements; an additional frequency peak above 20kHz, and impedance begins to rise with increasing frequency above the last resonance. IN this case, leaving ~10% of the leakage inductance on the primary might be closer to reality.
Concerning Primary Inductance and distortion: You adjusted the core parameters to match the lower primary inductance measured by 1audio. Note that this could also be achieved with addition of a very small air gap on the order of 10μm with the core parameters unchanged. You will also find this reduces the distortion.
All things considered, still amazes me that these Spice models match reality as well as they do.
Thank you for looking at my models.
Concerning leakage inductancte:
I have split them 50/50 between primary and secondary.
In your case, the 1.48H secondary was split in 0.74H secondary and 0.74/N^2=49.5uH primary.
I did the same in Demian's case.
To prove that this was correct, I published this image below a number of postings ago to show the conformity between measurement and simulation, and yes these values are twice as high as in your case, but the resonances fit perfectly between both graphs and gives me no other choice.
Concerning Cw.
This value is purely base on trial and error to get a peak of approx. 18 Ohm at Hf and was not based on Demian's measurement of ca 1nF.
Obviously both Cw's are cancelled in some way in the ESL63, leaving the small value that I inserted. Since the ESL has this peak at Hf, this was the only way to achieve this.
I you play a bit with my models, you will notice how sensitive this is and that you don't have that many options to get this peak.
Concerning primary inductance:
I took the inductance at the point where distortion was still acceptable when increasing the applied voltage.
In your case this wasa 250mH, and in Demian's case it was 140mH.
And yes you are right, the lower inductance could very well be caused by a small airgap.
Hans
Attachments

…I published this image below a number of postings ago to show the conformity between measurement and simulation, and yes these values are twice as high as in your case, but the resonances fit perfectly between both graphs and gives me no other choice.
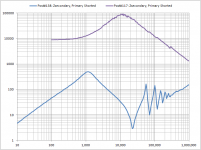
To verify measurement vs simulation of leakage inductance values, you need to use the shorted secondary configuration.
Compare simulation with measurements shown in lower left plot of first attachment in Post#142 (re-attached below for convenience)
Attachments
To verify measurement vs simulation of leakage inductance values, you need to use the shorted secondary configuration.
Compare simulation with measurements shown in lower left plot of first attachment in Post#142 (re-attached below for convenience)
Steve,
Maybe we can solve the problem together, because I can't come to any other conclusions as before.
Looking at the graph in my last posting #176, I see two resonance peaks, one at 1.3Khz and one at 22.7Khz.
Now this is what I did:
The first peak is caused by C1 and L2 or C1*N^2 and L1, in both cases resulting in 16pF according to C1=1/([2Pi*f]^2*L2)
The second peak is caused by primary and secondary leakage induction, or when everything is translated all to the secondary by LSf and C1.
Now according to LSf = 1/([2Pi*f]^2*C1) = 3.07H
Again having divided this 3.07H over primary and secondary gave me 1.54H and 107uH.
Hans
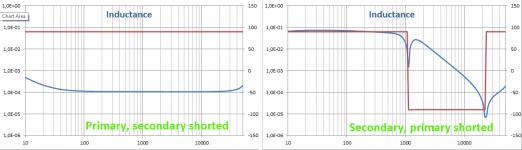
Just to show how difficult it is to convert the measurements into figures,
look again the first image below that was also in posting #142.
With the secondary shorted, a leakage inductance of 107uH is measured.
When measuring from the other side with the primary shorted, a leakage inductance of (107uH)*N^2 = 1.54H would be expected, but instead of that only 70mH is measured, a factor 22 too low !
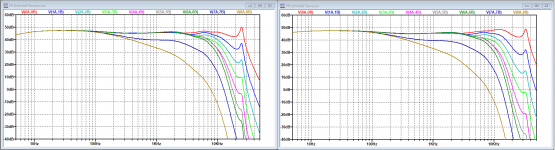
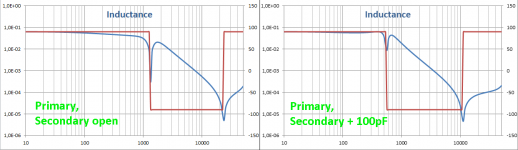
There was also a measurement from the primary side with the secondary open and a second one with 100pF added to the secondary, see second image.
To replicate that graph in a simulation, I could only get that with 68pF added instead of 100pF, but that's already quite a bit closer, only 1.5 times off instead of 22 times.
But it demonstrates the difficulty to get your fingers behind the numbers, because obviously all kind of parasitic effects are interfering with the results.
Hans
look again the first image below that was also in posting #142.
With the secondary shorted, a leakage inductance of 107uH is measured.
When measuring from the other side with the primary shorted, a leakage inductance of (107uH)*N^2 = 1.54H would be expected, but instead of that only 70mH is measured, a factor 22 too low !
There was also a measurement from the primary side with the secondary open and a second one with 100pF added to the secondary, see second image.
To replicate that graph in a simulation, I could only get that with 68pF added instead of 100pF, but that's already quite a bit closer, only 1.5 times off instead of 22 times.
But it demonstrates the difficulty to get your fingers behind the numbers, because obviously all kind of parasitic effects are interfering with the results.
Hans
Attachments

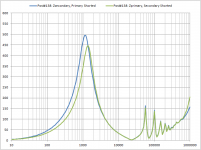
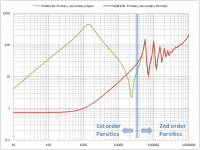
Unfortunately it looks like the measurement from Post#138 labeled “Quad transformer secondary primary shorted” is not a measurement of the configuration described. The impedance values are 2 orders of magnitude too low. Compare with the measurement from Post#117. Also, if you overlay with the measurement from Post#138 labeled ”Quad Transformer Primary Impedance secondary Open (shunt)” it appears to be a good match for that measurement configuration, although taken at a different drive level as you can see the primary inductance is slightly lower. (See attachments #1, #2)
Using the primary inductance value from 10Hz to back calculate value for winding capacitance(C1) from resonance frequency is problematic. Unfortunately, the primary inductance isn’t constant because the BH curves are a function of frequency(for Freq > 100Hz), and for any given BH curve the permeability is a function of applied current which falls for increasing frequency because of the inductance. Looking at the data the value of L1 looks to have fallen by factor of two by 1kHz.
For step-up transformers the 1st order parastics (leakage inductance and winding capacitance) are best determined from a secondary impedance measurement with primary shorted as shown by golfnut in Post#123, or using a combination of 2 primary impedance measurements made with secondary open and shorted as shown in Post#137. My preference is for the latter because the lower impedances involved are much less critical of resistive/capacitive load from the measurement system probes. But if you can quantify the measurement system load, golfnut's method is a straight forward curve fit and uses only a single measurement.
I am still going thru all of the data 1audio posted, cross-referencing and comparing similar measurements configuration. But so far I do not see anything that doesn’t point to a total leakage inductance of ~1.54H. Even the direct bridge measurements in Post#124 and the Praxis Mrk2 & 3 data from Post#130
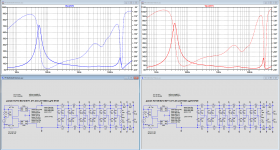
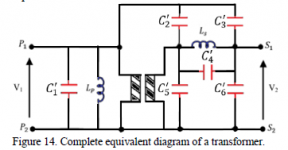
I will post a summary of my conclusions later today on the 1st order parasitics. I have never investigated 2nd order parasitic in much detail as they don’t generally affect the response in the audio band. But, I have a few papers on the subject I will need to read up on. Attached is one of the proposed models that is supposed to better define the impedance behavior of the distributed capacitance and leakage inductance.
Now this is what I did:
The first peak is caused by C1 and L2 or C1*N^2 and L1, in both cases resulting in 16pF according to C1=1/([2Pi*f]^2*L2)
Using the primary inductance value from 10Hz to back calculate value for winding capacitance(C1) from resonance frequency is problematic. Unfortunately, the primary inductance isn’t constant because the BH curves are a function of frequency(for Freq > 100Hz), and for any given BH curve the permeability is a function of applied current which falls for increasing frequency because of the inductance. Looking at the data the value of L1 looks to have fallen by factor of two by 1kHz.
For step-up transformers the 1st order parastics (leakage inductance and winding capacitance) are best determined from a secondary impedance measurement with primary shorted as shown by golfnut in Post#123, or using a combination of 2 primary impedance measurements made with secondary open and shorted as shown in Post#137. My preference is for the latter because the lower impedances involved are much less critical of resistive/capacitive load from the measurement system probes. But if you can quantify the measurement system load, golfnut's method is a straight forward curve fit and uses only a single measurement.
I am still going thru all of the data 1audio posted, cross-referencing and comparing similar measurements configuration. But so far I do not see anything that doesn’t point to a total leakage inductance of ~1.54H. Even the direct bridge measurements in Post#124 and the Praxis Mrk2 & 3 data from Post#130
I will post a summary of my conclusions later today on the 1st order parasitics. I have never investigated 2nd order parasitic in much detail as they don’t generally affect the response in the audio band. But, I have a few papers on the subject I will need to read up on. Attached is one of the proposed models that is supposed to better define the impedance behavior of the distributed capacitance and leakage inductance.
Attachments
- Home
- Loudspeakers
- Planars & Exotics
- QUAD 63 (and later) Delay Line Inductors