One more set of numbers-Turns ratio measurement
Secondary- 10.0321V 2400 Kz (approx 10,000 turns)
Primary .080075V (approx 40 turns)
3 turns added .005850 (3 turns)
Unless some more info is needed I'll be reassembling the bottom of this speaker and moving it back into temp storage tomorrow.
That will be it.
Thank you so much for all your effort.
Hans
I have the first results from Demian's measurements with his Bode 100.
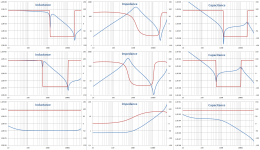
In the first image, the primary side is connected to the Bode in shunt mode (Rsource=25R), with resp. from top to bottom
Secondary open
Secondary loaded with 100pF
Secondary shorted
The second image has the secondary side connected to the bode in series mode (Rsource=100R), with resp from top to bottom
Primary open
Primary shorted
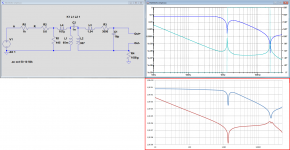
The next step was to extract all parameters from these images.
What I have achieved is a combo of reading the measurements and transferring the data to LTSpice to check the results.
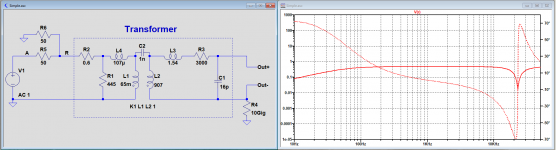
In the thirs image below you see the conformity of what's been measured against the simulation using all the extracted data, Inductance as well as Capacitance.
From the measurements came a transfer ratio of 120 = sqrt(907/0.063)
Hans
In the first image, the primary side is connected to the Bode in shunt mode (Rsource=25R), with resp. from top to bottom
Secondary open
Secondary loaded with 100pF
Secondary shorted
The second image has the secondary side connected to the bode in series mode (Rsource=100R), with resp from top to bottom
Primary open
Primary shorted
The next step was to extract all parameters from these images.
What I have achieved is a combo of reading the measurements and transferring the data to LTSpice to check the results.
In the thirs image below you see the conformity of what's been measured against the simulation using all the extracted data, Inductance as well as Capacitance.
From the measurements came a transfer ratio of 120 = sqrt(907/0.063)
Hans
Attachments

Because the inductance is dependant on the applied level, as Steve has shown, I placed the just created model in LTSpice in the same shunt setup as Demian used with his Bode 100.
Result can be seen in the first image below.
At 20Hz level is 150mV with 63mH and at 60Hz it is 340mV with 59mH.
Inserting these points into Steve's graph, shows that the differences aren't too big.
But it also shows that measurements in future with higher levels should be welcome.
Hans
Result can be seen in the first image below.
At 20Hz level is 150mV with 63mH and at 60Hz it is 340mV with 59mH.
Inserting these points into Steve's graph, shows that the differences aren't too big.
But it also shows that measurements in future with higher levels should be welcome.
Hans
Attachments

I don't have the incremental inductance bridge anymore (the perfect tool for L vs. Drive) but I can measure distortion vs. level at a low frequency (no load up to maybe 1 KV out) if that will help, and I could do a stepped plot for low frequencies vs impedance at level.
I don't have the incremental inductance bridge anymore (the perfect tool for L vs. Drive) but I can measure distortion vs. level at a low frequency (no load up to maybe 1 KV out) if that will help, and I could do a stepped plot for low frequencies vs impedance at level.
If still possible, could you measure the primary DC resistance.
From your Bode I got 0.6R@10Hz, but my ESL's just like Steve's measure 0.35R@DC.
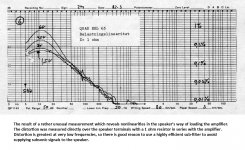
I have planned to redo the Danish test in the image below, because I have the feeling that their Amp was also to blame for part of the distortion.
You could do the same, so we can compare results.
Hans
Attachments
Primary DCR 0.435 Ohm
I managed to fry my poweramp before getting the distortion numbers. I did see something close to -60 dB H2 with approx 1V in. At 6V my amp became unstable.
As soon as I figure out what fried and if I can fix it I will get more data.
I managed to fry my poweramp before getting the distortion numbers. I did see something close to -60 dB H2 with approx 1V in. At 6V my amp became unstable.
As soon as I figure out what fried and if I can fix it I will get more data.
Primary DCR 0.435 Ohm
I managed to fry my poweramp before getting the distortion numbers. I did see something close to -60 dB H2 with approx 1V in. At 6V my amp became unstable.
As soon as I figure out what fried and if I can fix it I will get more data.
Sorry to hear that you roasted your amp.
I will do my test tomorrow.
Hans
Amp is repaired (needed an LM12CLK) and I needed to add an output fuse (after 30 years!). A quick duplicate measurement to the one you posted shows significant distortion on the transformer primary at low frequencies which should be no surprise.
Attached are impedance plots at different levels, both graphic and as a table. On my test resistor there was no change with level so I'm reasonably confident in these numbers but there still may be some gremlins. The change in impedance with level may map to a change in distortion with level.
I'll post the distortion plots tomorrow.
I'll post the distortion plots tomorrow.
Attachments
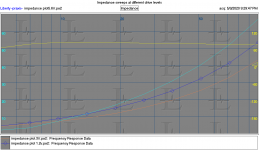
Attached are impedance plots at different levels, both graphic and as a table. On my test resistor there was no change with level so I'm reasonably confident in these numbers but there still may be some gremlins. The change in impedance with level may map to a change in distortion with level.
I'll post the distortion plots tomorrow.
The Zip file is Empty 😀
Hans
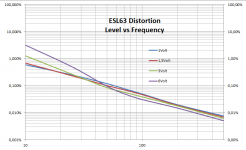
Here are the measured distortion figures of my ESL 63, measured the same way as in the Danish test in the first image below.
I have the impression that their system had a rumble filter, because in my system the distortion keeps going on below 10Hz.
The main cause why the distortion increases below 50Hz with 6Volt applied, is that H2 starts to take over the dominant distortion level from H3.
From 50Hz to 500Hz, the largest distortion component is the 3rd harmonic.
Both graphs are quite similar, except the distortion at 10Hz@6Volt where my system shows 3% versus their test at 1%, most likely caused by the attenuation of their rumble filter.
Hans
Attachments

It is surprising that distortion, when measuring this way, is only dependent on frequency and not at all level dependent.
I think to have built a reasonable replacement circuit, but when simulating in the same set up as I just measured, results do not correspond.
Most notably is that the measured curves are having a slope of 20dB/dec while with LTSpice I get 40dB/dec slopes that are also level dependent.
No idea what is causing this difference.
Hans
Attachments
Hans
I suggest checking the harmonics that your model produces. If your model is symmetric then it will only produce odd harmonics. The third order harmonic will fall at 40 dB/dec whereas second order will fall at 20 dB/dec.
Second harmonic will occur when the magnetisation curve is assymmetric - perhaps there is a dc current flowing or residual magnetism in the core.
R
Hans- Are you measuring an individual transformer or the speaker as a whole? The input circuits with the resistors and the RC network would have a significant impact on the impedance etc. At low frequencies they will dominate the impedance and the harmonic generation. I'll be posting my distortion curves shortly. 4V was the max I could do through 1 Ohm before I heard unselling noises from either the amp or the transformer. At least I'm pretty confident its fully demagnetized now.
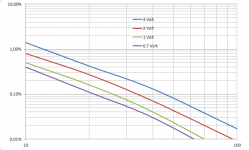
Here are the HD2 and HD3 measurements vs level for 10 Hz to 100 Hz. The actual signal levels are quite low so they may be compromised by noise but you can see the trends. There is a lot of data to manage so I think the table will be the most useful.
HD2 seems to be close to the effective residual on all the measurements. HD3 does change with level.
HD2 seems to be close to the effective residual on all the measurements. HD3 does change with level.
Attachments
Demian,Hans- Are you measuring an individual transformer or the speaker as a whole? The input circuits with the resistors and the RC network would have a significant impact on the impedance etc. At low frequencies they will dominate the impedance and the harmonic generation. I'll be posting my distortion curves shortly. 4V was the max I could do through 1 Ohm before I heard unselling noises from either the amp or the transformer. At least I'm pretty confident its fully demagnetized now.
Yes, I was measuring the speaker as a whole.
Hans
Hans
I suggest checking the harmonics that your model produces. If your model is symmetric then it will only produce odd harmonics. The third order harmonic will fall at 40 dB/dec whereas second order will fall at 20 dB/dec.
Second harmonic will occur when the magnetisation curve is assymmetric - perhaps there is a dc current flowing or residual magnetism in the core.
R
I was wrong with HD2, I misread the data.
In all cases HD3 is dominant.
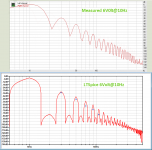
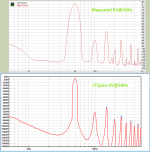
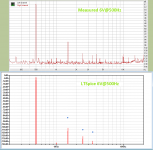
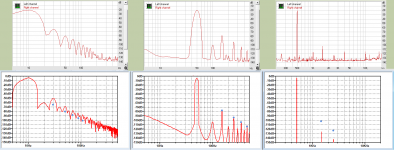
Below 3 images comparing measured vs LTSpice spectra, all taken from the same 400mSec window with a 6 Vrms input signal.
Spectra from 10 & 50Hz are remarkably similar.
However the LTSpice graph at 500Hz has ca 15dB less distortion, although the ratio between the harmonics is still similar as in the measurement.
With blue dots I've marked for the uneven harmonics the measured value in the LTSpice graph.
Hans
Attachments
Here are the HD2 and HD3 measurements vs level for 10 Hz to 100 Hz. The actual signal levels are quite low so they may be compromised by noise but you can see the trends. There is a lot of data to manage so I think the table will be the most useful.
HD2 seems to be close to the effective residual on all the measurements. HD3 does change with level.
Demian,
Same question to you: did you measure one transformer, or the speaker as a whole ?
And could you please resend the intended Zip file from posting #149, because that Zip file was empty.
Hans
Attached are the impedance plots. This time the file is in the zip.
For distortion I was measuring the transformer with nothing attached except the 1 Ohm current sense resistor. The measurement is the distortion across the transformer. I confirmed there is typically 20 dB less distortion at the amp output.
For distortion I was measuring the transformer with nothing attached except the 1 Ohm current sense resistor. The measurement is the distortion across the transformer. I confirmed there is typically 20 dB less distortion at the amp output.
Attachments
- Home
- Loudspeakers
- Planars & Exotics
- QUAD 63 (and later) Delay Line Inductors