Christian,I don't understand currently how it can be extended to "exotic" suspension methods bit it seems Dave found a way to do it!
I've been wondering about that too. And added masses, and even exciters, for that matter.
Eric
So here is a comparison between a Pettals simulation and REW measurements. It's a terrible DML panel, to be sure, and kind of an easy test for Pettals, but still interesting. I say "easy" because the plate is so thick that that the number of natural frequencies influencing the response is really few.
The panel is a 9.5 mm thick (yes, really) aluminum plate, about 202 x 368 mm. For the Pettals sim I used a Q of 200, rather than the default of 40. As you may recall, I estimated earlier the Q of this plate to be something like 1500, but once you go over about 200 in Pettals it seem to make no difference. I used a 25VT-4 exciter attached at the center of the panel. The panel was hung in the horizontal orientation using two strips of tape at about 80 mm from the two ends, locations which should infuence the fewest number low order modes.
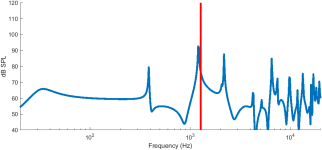
First is the impedance comparison. the impedance peak at the exciter resonance look really similar in both. And while there are peaks in both the sim and the measurement at nearly the same frequencies, the peaks are much lower in the Pettals sim. I suspect, however that that is probably only because the resolution of the Pettals plot simply isn't high enough to capture such sharp peaks.
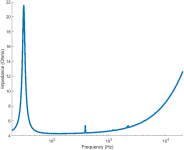
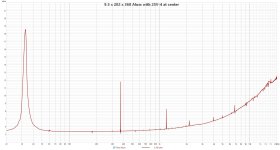
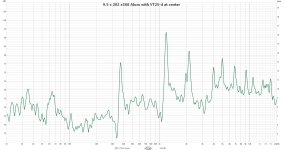
Next the on-axis FR comparison. Certainly the Pettals sim is much smoother wherever the SPL is low, but the pattern of peaks is remarkably similar. Even the double peak at around 2k is shown in both.
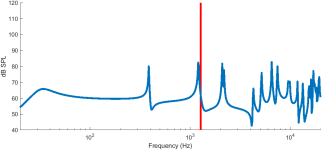
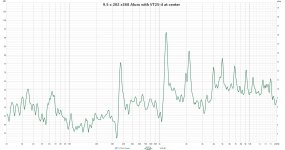
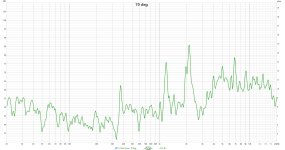
And finally the off-axis comparison. Here I am comparing the Pettals sim at 90 deg to a measurement at 70 deg. Here the match is not quite as good, particularly in that the deep nulls sim don't show up in the measured results.
Eric
The panel is a 9.5 mm thick (yes, really) aluminum plate, about 202 x 368 mm. For the Pettals sim I used a Q of 200, rather than the default of 40. As you may recall, I estimated earlier the Q of this plate to be something like 1500, but once you go over about 200 in Pettals it seem to make no difference. I used a 25VT-4 exciter attached at the center of the panel. The panel was hung in the horizontal orientation using two strips of tape at about 80 mm from the two ends, locations which should infuence the fewest number low order modes.
First is the impedance comparison. the impedance peak at the exciter resonance look really similar in both. And while there are peaks in both the sim and the measurement at nearly the same frequencies, the peaks are much lower in the Pettals sim. I suspect, however that that is probably only because the resolution of the Pettals plot simply isn't high enough to capture such sharp peaks.


Next the on-axis FR comparison. Certainly the Pettals sim is much smoother wherever the SPL is low, but the pattern of peaks is remarkably similar. Even the double peak at around 2k is shown in both.


And finally the off-axis comparison. Here I am comparing the Pettals sim at 90 deg to a measurement at 70 deg. Here the match is not quite as good, particularly in that the deep nulls sim don't show up in the measured results.


Eric
OMG I just realized just how big and thin that really is! I was going to ask how many of them you have broken so far and realized that you probably havent broken any, since it's only virtual design, so far, yes?
Eric
My early graduate school work was using cover glass for monitors, phones, TVs, etc as the plate medium, and it was mostly 0.7mm thick specialized glass formulations. These glass panels are really large and thin but are also really tough and luckily don't shatter into a bunch of little shards if they do break. I always liked the sound of them - very efficient and high-Q, but not as resonant as metals would be. They might be impractical on their own as speakers, but the simulations don't have to be practical for us to investigate what would sound good!Interesting, but why glass? What properties of glass (as opposed to say acrylic) makes it good for DML?
In my understanding, PETaLLS is based on the mode decomposition. The mode shape are calculated from the formulas coming from the work of M Warburton which opened the way to estimate the modes for any combination of standard edge conditions (free, simply supported, clamped) . I don't understand currently how it can be extended to "exotic" suspension methods bit it seems Dave found a way to do it!
Christian
Using attached masses, exciters, mounting conditions, etc is basically all from what's covered in Chs. 5 & 7 from my PhD thesis!Christian,
I've been wondering about that too. And added masses, and even exciters, for that matter.
Eric
The way that I've programmed it, the X and Y directional material properties are assumed to be the same (e.g. isotropic). The modal shapes in each direction are calculated independently, so it wouldn't be hard to assign different material properties (like different Young's moduli) to each direction.But this surely only holds for iso materials. The wave speeds in anisotropic materials vary with directional stiffnesses, so how is that handled?
I recall( I think) Dave saying PeTTALS assumes the X and Y coincidence frequencies to be the same, but they're not... Or do I remember incorrectly?
Eucy
I'll add anisotropy in there - just have to get the time to figure out where to plop the menus down in the GUI. I've been really busy with other things, but I promise that I'll get to all of this eventually! When the semester is over and I'm not teaching anymore, I'll have more time to sit down and work on these things.
I'm assuming that I need to meet the Nyquist sampling criterion - that I need a sampling resolution that is twice as dense as the shortest wavelength. This is dynamic, so that it's proportional to the number of modes being simulated. So if you set the maximum simulated frequency at 20kHz, you'll get a certain spatial sampling rate that works for modes up to 20kHz; if you set the maximum at 30kHz, you'll get more modes and a more dense spatial sampling rate. There are some minor differences that can be observed, but they didn't seem significant to me.Further note to the above. At 20k, the bending wavelength can be of the order of 10-20mm, so for decent resolution in FDM, readings tell me we need grid spacings of less than 1/6th of the wavelength, ie 2 to 3mm... Thousands of nodes...Not practical for DIY computers...
Even standard FEM methods have the same problems.
I'll have to go back and see what PeTTaLS is based on and how this is overcome.... Maybe it explains why the PeTTaLS hf region plots are flatter than what we get in testing?? Dave???
Eucy
I'm not actually sure why the high frequencies appear different in most measurements vs. my simulations. The velocity measurements that I've done in my recent papers on aluminum and acrylic match up very well, so I'm guessing that it's usually due to the unique thick plate things that Eric brought my attention to. This is something else that I need to study more...
I ran a simulation with the same parameters, but increased the frequency resolution by 16x and set the Q to 1500.So here is a comparison between a Pettals simulation and REW measurements. It's a terrible DML panel, to be sure, and kind of an easy test for Pettals, but still interesting. I say "easy" because the plate is so thick that that the number of natural frequencies influencing the response is really few.
The panel is a 9.5 mm thick (yes, really) aluminum plate, about 202 x 368 mm. For the Pettals sim I used a Q of 200, rather than the default of 40. As you may recall, I estimated earlier the Q of this plate to be something like 1500, but once you go over about 200 in Pettals it seem to make no difference. I used a 25VT-4 exciter attached at the center of the panel. The panel was hung in the horizontal orientation using two strips of tape at about 80 mm from the two ends, locations which should infuence the fewest number low order modes.
First is the impedance comparison. the impedance peak at the exciter resonance look really similar in both. And while there are peaks in both the sim and the measurement at nearly the same frequencies, the peaks are much lower in the Pettals sim. I suspect, however that that is probably only because the resolution of the Pettals plot simply isn't high enough to capture such sharp peaks.
View attachment 1453357 View attachment 1453366
Next the on-axis FR comparison. Certainly the Pettals sim is much smoother wherever the SPL is low, but the pattern of peaks is remarkably similar. Even the double peak at around 2k is shown in both.
View attachment 1453356 View attachment 1453384
And finally the off-axis comparison. Here I am comparing the Pettals sim at 90 deg to a measurement at 70 deg. Here the match is not quite as good, particularly in that the deep nulls sim don't show up in the measured results.
View attachment 1453402 View attachment 1453404
Eric
The peaks are definitely closer to what you measured now, but it's interesting to see that the low-frequency impedance peaks still aren't as high amplitude as in the measurements, and the high-frequency peaks are now too high!
There seem to be some clear patterns in the Q trends over frequency after looking at so many different experiments... I wonder if these can be predicted more accurately than just using a constant Q to describe the material?
One suggestion and one question :So here is a comparison between a Pettals simulation and REW measurements.
- Suggestion : you could import the PETTaLS screen shot to a site that propose to make transparent the background of a picture and then copy paste it on top of the REW screen shot. Some adjustments will make the scales matching (below examples with pixelcut.ai that I don't really know... and openoffice draw)
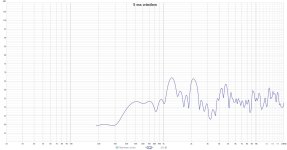
- Question : what is the time window used in REW? The response going low, I suspect it is a "long time window" so the room reflections are included while the PETTaLS response is for a baffled panel radiating in a half space without reflections. A short window (ie 5ms) might give closer conditions below 2k but will hide what happens below 1/5ms = 200Hz. The difference half space / open back will remain.
After I posted those results I heard your voice in the back of my head, and thought I should try shortening the window. Especially since nothing really interesting happens with this panel below 400 Hz anyway. But when I did a 5 ms window, the results look far less like the sim than they did with the default 500 ms window. Not sure why that is.Question : what is the time window used in REW? The response going low, I suspect it is a "long time window" so the room reflections are included while the PETTaLS response is for a baffled panel radiating in a half space without reflections. A short window (ie 5ms) might give closer conditions below 2k but will hide what happens below 1/5ms = 200Hz. The difference half space / open back will remain.
I may have to try your overlay suggestion, thanks.
Eric
Yep... Spatial not temporal... With FDM, that'll get to 5k or so with a safety factor, then it'll need to switch to SEA i believeI'm assuming that I need to meet the Nyquist sampling criterion - that I need a sampling resolution that is twice as dense as the shortest wavelength
Hello Eric,But when I did a 5 ms window, the results look far less like the sim than they did with the default 500 ms window. Not sure why that is.
Interesting. I didn't think about that when I suggested a 5ms window. Most probably the consequence of the low damping is the peaks ring long time after the 5ms. So the window rejects the room reflections but shortens also the modes decay and so the peaks in the frequency domain. A spectrogram should help to confirm or infirm this. Then the level shown decreases because of the low density of modes ?
So this material is probably almost impossible to measure acoustically at home.
From the impedance curve, I wonder why PETaLLS shows peaks around 2k like if some modes are visible in the simulated impedance curve, not in the measured one but peaks are visible on both SPL curves...
Hello Eucythen it'll need to switch to SEA i believe
SEA?
Christian
For the script testing, my standard test case is a 300x420mm plate with a 10x10mm mesh grid which leads to 1333 points. The modes are extracted in about 35s with an I7 (I7-1360P 13th generation). It was much faster when the matrices were more simple without the possibility of mass added locally.Further note to the above. At 20k, the bending wavelength can be of the order of 10-20mm, so for decent resolution in FDM, readings tell me we need grid spacings of less than 1/6th of the wavelength, ie 2 to 3mm... Thousands of nodes...Not practical for DIY computers...
The computation time is linked to the cube of the number of points so from 10 to 2.5mm it is 16 time more points so 16³ (4096) in time so about 40mn... if no other problem like a lack of memory occurs.
Hi ChristianHello Eucy
SEA?
Christian
Statistical Energy Analysis... Better suits high frequency analysis
Eucy
For a large glass plate 0.7mm is indeed very thin and fragile. You say specialized glass, but I wonder if it could be something closer to a polymer like Polycarbonate perhaps, which is 250 times stronger than normal window glass. How does the material parameters of this specialized glass used in the PETTaLS simulation differ from Polycarbonate? For Polycarbonate, density (kg/m^3) = 1200, Youngs modulus (GPa) = 2.4, Poisson’s ratio = 0.35 - 0.4it was mostly 0.7mm thick specialized glass formulations. These glass panels are really large and thin but are also really tough and luckily don't shatter into a bunch of little shards if they do break. I always liked the sound of them
I also find it interesting that you always liked the sound of this specialized glass. Many members here also liked the sound of Polycarbonate panels, although most of those were fluted panels and not solid plates. Many members also liked the sound of solid acrylic plates, which has some similar material properties as Polycarbonate. The thinnest Polycarbonate sheet I can source here is 1.5mm thick. Might be worth trying this?
Further to my posts above,
Further reading suggests the Nyquist theorem used for FDM will introduce derivative truncation errors of around 20% @5Khz indicating a need for much finer grid resolution... See ABAQUS/ANSYS where the 6 times sampling rate is recommended... So the high (er) frequency (above 1k) analysis remains a challenge.
In the case of modal decomposition, the derivative limitations/errors don't apply, but the sampling rate constraints apply in resolving the mode shapes at high frequencies, so again it seems the Nyquist rule may be insufficient.???..
.
OMG..Too much reading... Over and out!!
Eucy
@twocents, but I wonder if it could be something closer to a polymer like Polycarbonate perhaps, which
I reckon it may have been something like Gorilla Glass
Exactly - this is the main formulation we worked with.I reckon it may have been something like Gorilla Glass
By the way, here are some average surface velocity measurements for my acrylic and aluminum panels, compared to the new models I've developed with the more complicated exciter physics. I prefer these to acoustic measurements because outside of a tightly controlled anechoic chamber, acoustic measurements can be all over the place in terms of quality and reliability. The high-frequency response doesn't look too bad, but it's definitely off by a constant 5dB or so for the aluminum above 4kHz. These use a better model than what was in my most recent papers, so the match is quite a bit better.
ACRYLIC:

ALUMINUM:

ACRYLIC:
ALUMINUM:
Eucy,Further to my posts above,
Further reading suggests the Nyquist theorem used for FDM will introduce derivative truncation errors of around 20% @5Khz indicating a need for much finer grid resolution... See ABAQUS/ANSYS where the 6 times sampling rate is recommended... So the high (er) frequency (above 1k) analysis remains a challenge.
In the case of modal decomposition, the derivative limitations/errors don't apply, but the sampling rate constraints apply in resolving the mode shapes at high frequencies, so again it seems the Nyquist rule may be insufficient.???..
.
OMG..Too much reading... Over and out!!
Eucy
From the wavelength in the plate lamda(f) = c0 / sqrt(f . fc) > 6.mesh (with c0 sound celerity in the air, f the considered frequency, fc the coincidence frequency, mesh the distance between 2 points), it comes f < 3.3k with fc = 10kHz.I target even fc above 15k.
There is also the possibility of a finer grid at the exciter which should have 2 advantages: a better fit to the ring interface, a better description of the area of HF without a finer grid over all the surface so maybe a moderate computation cost... but a higher degree of complexity.
- Home
- Loudspeakers
- Full Range
- PETTaLS Flat Panel Speaker Simulation Software