I found the github link here:
github pettals
Is that what the link in the first post should be now?
I re-loaded it from there (I think), but it still doesn't run. I have not tried going back to 1.3 yet.
Eric
github pettals
Is that what the link in the first post should be now?
I re-loaded it from there (I think), but it still doesn't run. I have not tried going back to 1.3 yet.
Eric
Yes, that's the right link (for now). I believe that your previous link was to the "tags" page, and I reorganized that because I wasn't using it correctly.I found the github link here:
github pettals
Is that what the link in the first post should be now?
I re-loaded it from there (I think), but it still doesn't run. I have not tried going back to 1.3 yet.
It might even be better to link here, because this is the main page for the project. If I add a new "release" (which I plan to do in the future for new versions), this project page will point everyone to the latest version.
I just downloaded v1.4 from github onto my home computer and it's working. Maybe I'll wait to see if anyone else is also having issues. Sorry! I'm not sure what's causing this.
Don't know about Linux, but with Windows, just name each download with a version number and you can reinstall back and forth at willCan I get back 1.3 temporarily?
@EarthTonesElectronics
Hi Dave
Brilliant! Love it... But as usual, I have requests...🤭. Only 2 this time, one a repeat.
1/ can you please consider putting a slider control on the frequency box below the surface velocity map so a user can slowly drag the slider and watch the changes rather than typing in fixed frequencies. Tracking the spl changes as the modes move is fascinating.
2/ the white ring for the exciter is easier to see than the previous red one, but it's too fat and blocks out the map below it... Suggestion ::. Reduce the ring thickness a bit and can you add a button to turn the ring on and off?
And thank you 👃for incorporating the smoothing functions...
Cheers
Eucy
I notice that the white ring is actually a hole in the map...the white ring for the exciter is easier to see than the previous red one, but it's too fat
Ahhh.... What's next on my wish list (Dave's oh-no list) 🤭 in order of priority:
1/ More support choices... Mixed cases, partial support etc.
2/ Anisotropy. Yes... Super important for rectangular panel analysis.
3/ Freeform panel dimensions/shape through co-ordinate entry, mainly to see what happens at corners and modal boundaries. Maybe importation of externally generated shapes for this one..I imagine this will be very hard/impossible to accommodate given the analysis strictures. Even seeing what happens at chopped corners would be great. This sort of overlaps with the support item 1/ as unsupported corners probably largely act as though chopped off given the small areas involved.
4/ Extend panel dimensions beyond 1m (low priority for this one)
Sorry Dave, just can't get enough of a good thing.!!
Eucy
Last edited:
Dave,I just downloaded v1.4 from github onto my home computer and it's working. Maybe I'll wait to see if anyone else is also having issues. Sorry! I'm not sure what's causing this.
I reloaded 1.4 it it is now working. Yay!
When I tried the free panel again with the corner point force I found most of the modes that the FEA found.
But I happened to look at the mode shape of the first mode, which should be twisting with adjacent corners moving in opposite directions. But instead they are all moving in the same direction.
I didn't look at other modes yet.
Eric
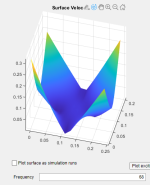
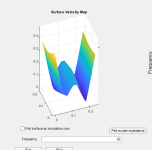
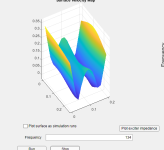
Okay, I'm starting to realize that the velocity map is absolute value (never negative). is that right? But obviously the sign of the velocity matters for sound radiation. So does your sound radiation calculation know that the edges are moving in opposition to the center? I'd like it better if the velocity map looked like the mode shapes. Otherwise it makes me worry whether or not the simulation knows what is moving in-phase and what is moving out-of-phase.
Eric
Eric

Eucy,Can you please tell me what your inputs are for this run?
Eucy
How are things going there? Are you still on the generator?
See post 37
Eric
I just uploaded v1.3 of PETTaLS to the github site, along with change notes. No real major changes, but a few wrinkles have been ironed out!
Dave,
I didn't load 1.3 yet, so this refers to 1.2.1. I'll load 1.3 shortly, but 1.2.1 is running so fast at the moment I hate to change anything.
Meanwhile, I think there may be something amiss in the FFFF model. I was doing another test to compare the natural frequencies in the your simulation to those predicted by my FEA, but using the FFFF case. This time, in order to excite all (or nearly all) of the modes, I used a point force very...
Yes, you're correct that these plots show the absolute value of velocity (or mode shape). The actual velocity map is all complex values (e.g. magnitude and phase), and this is what is used in the calculation of the acoustic radiation.Okay, I'm starting to realize that the velocity map is absolute value (never negative). is that right? But obviously the sign of the velocity matters for sound radiation. So does your sound radiation calculation know that the edges are moving in opposition to the center? I'd like it better if the velocity map looked like the mode shapes. Otherwise it makes me worry whether or not the simulation knows what is moving in-phase and what is moving out-of-phase.
Eric
View attachment 1435569
The problem with making these plots is that in a very simple setup, modes only display phases of +pi and -pi, which equates to either moving towards you or away from you... like in this picture I stole from one of your posts on the other thread:
Once you include the exciter on there, and start simulating regions where many modes overlap, different portions of the panel move with phases that run the gamut between -pi and pi. So one peak might not exactly be "out of phase" with another peak, but rather lagging behind by just a little bit. This makes plotting the "mode shape" somewhat difficult. The best representation would probably actually be a little animation that "plays" the motion of the plate from -pi to pi, and I might be able to add that in there.
Hi Eric,
How are things going there? Are you still on the generator?
Back to 'normal' now after 6 days on the generator. I'll be ready for the next one... New generator and wiring adjustments so we can plug the generator straight into the house to connect pre-selected circuits. No more extension leads. And we had no damage, unlike many.
Rainfall for the worst day was over 14".... Over the week...I lost track.
We were fortunate to have the generator... Many did not... And it was like Covid all over again... No supplies, no generators for sale or hire... All gone in a flash.
Eucy
Yep...I see the plot issue...I was focused on other things and was blind to the obvious. 😵💫
It also explains how I couldn't reconcile the map vs the fr dip in a previous post.
Eucy
It also explains how I couldn't reconcile the map vs the fr dip in a previous post.
Eucy
Last edited:
Just uploaded v1.4 to github with these changes:
- Added a smoothing option (unsmoothed, 1/6 octave, 1/3 octave, 1 octave). Smoothing is only applied to the SPL graph, not to the polar plot or the impulse response. The "compare results" checkbox allows you to keep previous results when plotting new smoothed results.
- The "compare results" checkbox now affects the new SPL graph, so you can compare on-axis to off-axis, etc.
- Fixed a bug in the code to implement the equations for FF mode shapes with odd indices.
I redid the comparison between the FEA and Pettals natural frequencies for the FFFF case, this time using V1.4, with the fix on the mode shapes. I used the acrylic properties, except with Q=100, and with dimensions of 0.24 x 0.2 x 0.003 m. The "missing" modes re-appeared in V1.4, with the exception of 2 or 3 modes that landed on top of other (stronger) modes, so didn't show up in Pettals. I only looked at about the first 20 modes, because beyond that the mode shapes in the FEA start getting pretty crazy shapes that are really hard to clearly match with the Pettals modes.
The largest difference (in percentage) was for the fifth mode, which was 183 Hz in Pettals and 195 Hz in the FEA, with a difference of 6.6%.
One other difference is that in the FEA, the nodal lines are often curved, like the images below, while in Pettals they are almost always straight lines. In the FEA, the curvature is related to the poisson's ratio. Higher poisson's ratio (PR) results in more curvature. With a PR of 0.37, acrylic's nodal lines are a little curvier than most other materials.
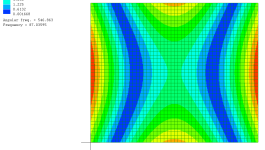
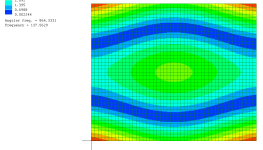
But Pettals did come pretty close with this cool mode shape:

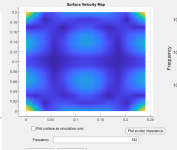
Eric
How similar is the FEA simulation to PETTaLS? As in, does it have an excitation source, and does it generate some kind of output over a range of frequencies, or does it just determine the modes (what would be called eigenvalues and eigenfrequencies, probably)?I redid the comparison between the FEA and Pettals natural frequencies for the FFFF case, this time using V1.4, with the fix on the mode shapes. I used the acrylic properties, except with Q=100, and with dimensions of 0.24 x 0.2 x 0.003 m. The "missing" modes re-appeared in V1.4, with the exception of 2 or 3 modes that landed on top of other (stronger) modes, so didn't show up in Pettals. I only looked at about the first 20 modes, because beyond that the mode shapes in the FEA start getting pretty crazy shapes that are really hard to clearly match with the Pettals modes.
I'm mostly curious because if those FEA pictures are the ideal mode shapes (i.e. independent from any coupling to an excitation source or the other modes) then that's definitely something PETTaLS doesn't do. All of the ideal independent mode shapes in PETTaLS have nodal lines that are parallel to the plate edges - curved nodal lines only appear from the coupling (or phase cancellation) between different modes.
I'd guess that, if this is the case, what we're seeing is a difference that emerges because of the thin plate vs. thick plate models. Perhaps the thin plate index can predict how much error we can expect to see in the mode frequencies - like hopefully a thinner plate (1mm aluminum) would produce less error?
Yes, this is what it started out as, but someone asked me to change it! I'll just put both in there, that way nobody can complain.1/ can you please consider putting a slider control on the frequency box below the surface velocity map so a user can slowly drag the slider and watch the changes rather than typing in fixed frequencies. Tracking the spl changes as the modes move is fascinating.
The white ring is matched to the actual dimensions of the exciter! So if it's too fat, then the exciter is actually that big! You're probably using the 25VT-4, which is the big one? I also changed the way that it was being plotted because the old red method had a bunch of issues. This is something I'm still iterating on to determine the best method. I can definitely add a button to turn the ring on and off.2/ the white ring for the exciter is easier to see than the previous red one, but it's too fat and blocks out the map below it... Suggestion ::. Reduce the ring thickness a bit and can you add a button to turn the ring on and off?
1, 2, and 4 are things I've done but are meant to be part of the "advanced" version. I'm not at all opposed to giving away these features to everyone here, but the University and I would like to find a way to license some of these special design features to companies that might be interested. I'm sure that I can find a way to "comp" the advanced version to everyone here who's spent a lot of time helping me out!1/ More support choices... Mixed cases, partial support etc.
2/ Anisotropy. Yes... Super important for rectangular panel analysis.
3/ Freeform panel dimensions/shape through co-ordinate entry, mainly to see what happens at corners and modal boundaries. Maybe importation of externally generated shapes for this one..I imagine this will be very hard/impossible to accommodate given the analysis strictures. Even seeing what happens at chopped corners would be great. This sort of overlaps with the support item 1/ as unsupported corners probably largely act as though chopped off given the small areas involved.
4/ Extend panel dimensions beyond 1m (low priority for this one)
3 is a little tricky. It's fairly straightforward for SSSS panels, possibly easy for CCCC, and I'm not sure how to approach it efficiently for FFFF. There are a lot of different ways to accomplish these things, but I just need to find one that fits nicely with the rest of the PETTaLS model.
Yes, I actually just think I'll add it as a label within the graph itself, or in the title of the graph.Dave... One more request
Please consider moving the current frequency box up to a position directly below the tick box for plotting. Easier for eye scanning during running
Regards
Eucy
Thanks! Keep the suggestions coming!
I did an analysis a few weeks ago looking at how using thin plate theory (like Pettals does) leads to an error in the determination of coincidence frequency, but that that error is pretty small for most materials. That was here.
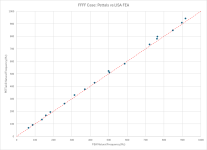
Today I compared the natural frequencies predicted by Pettals with those predicted by my LISA FEA. The FEA takes into account the thickness effects that thin plate theory ignores. I looked at two plates, one 3 mm Acrylic, and the other 8 mm EPS. For Acrylic I used Dave's properties, and for EPS I used E=40 MPa, nu=0.2 and rho=45, which is about the properties of my EPS. In both cases I used Q=100 to make the impedance peaks sharp. Boundaries were SSSS. I got the natural frequencies from Pettals by using a point force at the center of the panel, and taking the peak values in the impedance curves. This only gave me only a subset of the modes, making identification of particular modes and their frequencies easier.
The results below shows the ratio of the natural frequencies in the Pettals simulation to those calculated by the FEA for the same modes, and plotted as a function of the Pettals modal frequencies (the x axis), for both of those panels.
What it shows is that the error is small at low frequencies, but grows at higher frequencies, presumably because the effective wavelength is getting closer to the panel thickness. For the 3 mm Acrylic, the error only ever approaches 10% at 20 kHz. But the error for the EPS is much larger, reaching 10% at 5 kHz and exceeding 30% at 20 kHz.
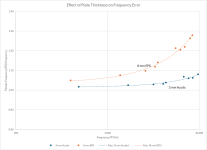
In this comparison, I used very small panels. For Acrylic it was .09 x .06, and for EPS it was .12 x .08. The reason for this is that by choosing a small panel, I reduced the number of modes, again, helping me to identify particular modes so that I could be sure I was comparing the same modes in Pettals and the FEA. You may think this affects the results, bit I don't think that it does. At any particular frequency, the wavelength is going to be determined by the properties and thickness of the panel, and not the overall size of the panel. So I'm pretty sure the trend would be virtually identical with larger panels, it would just be a lot harder to identify particular modes.
I hoped to put this in more general terms, that is, with dimensionless parameters, but I couldn't figure out how to do that in this case. Maybe later I'll figure it out.
Eric
Today I compared the natural frequencies predicted by Pettals with those predicted by my LISA FEA. The FEA takes into account the thickness effects that thin plate theory ignores. I looked at two plates, one 3 mm Acrylic, and the other 8 mm EPS. For Acrylic I used Dave's properties, and for EPS I used E=40 MPa, nu=0.2 and rho=45, which is about the properties of my EPS. In both cases I used Q=100 to make the impedance peaks sharp. Boundaries were SSSS. I got the natural frequencies from Pettals by using a point force at the center of the panel, and taking the peak values in the impedance curves. This only gave me only a subset of the modes, making identification of particular modes and their frequencies easier.
The results below shows the ratio of the natural frequencies in the Pettals simulation to those calculated by the FEA for the same modes, and plotted as a function of the Pettals modal frequencies (the x axis), for both of those panels.
What it shows is that the error is small at low frequencies, but grows at higher frequencies, presumably because the effective wavelength is getting closer to the panel thickness. For the 3 mm Acrylic, the error only ever approaches 10% at 20 kHz. But the error for the EPS is much larger, reaching 10% at 5 kHz and exceeding 30% at 20 kHz.

In this comparison, I used very small panels. For Acrylic it was .09 x .06, and for EPS it was .12 x .08. The reason for this is that by choosing a small panel, I reduced the number of modes, again, helping me to identify particular modes so that I could be sure I was comparing the same modes in Pettals and the FEA. You may think this affects the results, bit I don't think that it does. At any particular frequency, the wavelength is going to be determined by the properties and thickness of the panel, and not the overall size of the panel. So I'm pretty sure the trend would be virtually identical with larger panels, it would just be a lot harder to identify particular modes.
I hoped to put this in more general terms, that is, with dimensionless parameters, but I couldn't figure out how to do that in this case. Maybe later I'll figure it out.
Eric
Dave, in the FEA there is no excitation source, just eigenvalues and eigenfrequencies, as you suspected.How similar is the FEA simulation to PETTaLS? As in, does it have an excitation source, and does it generate some kind of output over a range of frequencies, or does it just determine the modes (what would be called eigenvalues and eigenfrequencies, probably)?
Yes, I think it's mainly the thin plate, thick plate difference we are seeing. The "thin plate index" was derived specifically using the definition of coincidence frequency, so I'm not sure it's directly applicable here. I'm going to have to think harder about that. As I mentioned in my last post I'd really like to frame this result in non-dimensional terms but I couldn't see how to do that just yet. I do think thinner produces less error.I'd guess that, if this is the case, what we're seeing is a difference that emerges because of the thin plate vs. thick plate models. Perhaps the thin plate index can predict how much error we can expect to see in the mode frequencies - like hopefully a thinner plate (1mm aluminum) would produce less error?
Eric
That would be super nice!1, 2, and 4 are things I've done but are meant to be part of the "advanced" version. I'm not at all opposed to giving away these features to everyone here, but the University and I would like to find a way to license some of these special design features to companies that might be interested. I'm sure that I can find a way to "comp" the advanced version to everyone here who's spent a lot of time helping me out!
One minor nit: It seems that if you plot the velocity map at a particular frequency, and then you change a parameter and rerun the simulation, and then try to get the velocity map at the same frequency as you did originally, it won't do it, even if you retype the number. You have to change the selected frequency to a new number, then change it back to the original one, to get the velocity profile you want.
Also, having the ability so save a set of inputs would be nice.
Eric
- Home
- Loudspeakers
- Full Range
- PETTaLS Flat Panel Speaker Simulation Software
