to pieter
I have wrote other articles on Audioreview magazine.
Also, as you see, I done lot of tests and circuit.
I have ready a new stuff (the last se trafo from Fiat tested) with a new double C nucleus.
I will have the new Litz in next future with this nucleus.
In every case I remember you that the previous Litz was a good stuff and, as I mentioned many time, was a proto.
Walter
The HF frequency response is not accurately described by the Ll/Cp model for frequencies much higher than the corner frequency. It all depends on the exact winding geometry, but the Vanderveen toroids tend to be more accurately described by it than a classical bobbin wound transformer (EI core or C core), and even those particular toroids eventually behave differently. But accurate transformer modeling is a subject on its own, a bit outside the scope of this thread.allow us to build relatively accurate Spice models
In addition I hope that the software from Fabrizio will be available in next future.
I am pushing on it.
This tool is fundamental in my opinion
Walter
I am pushing on it.
This tool is fundamental in my opinion
Walter
Hi
some consideration:
1- in my opionion the backward method is the best way to test the OT trafo with a simply test set up. At the moment is not available a good generator with almost zero output impedance, 0% Thd and a swing of around 600 Vpp. We are trying to do something but we stop at around the half, the main problem is that the P mosfet have a max voltage limited to 500/550 vdc.
2-with a few dollars is possible to buy a ss amp kit with 50w rms that it is capable of a wide band to check the freq. response; it is not necessary to go at 200 khz, the shape of the curve tell us what we will have; in addition the THD vs freq also tell us something very important. And this is possible to have with VA or ARTA or Spectralab and a good sound card.
3- Is not necessary to have the bias current, on S.E. OT, because if the goal is to understand in which way the stuff is working at low frequency we need to see the attenuation; with the bias it will be more attenuate . Each test we done in this way confirmed the final results with the entire amps. For high frequency the bias current is not involved because the capacitive components is more important
4- Is not a good method to use the load equal to the Rp of the tube we will use because we need to respect the nominal specs of the trafo; the reflected Z is not in one way ( sec to prim) but at the same time we have also the prim vs sec. So in this way we have the real test configuration.
After this my opinion, in the backward test, of course we can check what will happen when we close the primary with a resistance that is the nominal Rp of the tubes we will use. But in this way we are forcing the trafo to do something hard.
On the diagrams I sent we can see that, p.e. Hammond, on test set the attenuation is more evident on a test set respect to the complete amp
5- I f we look on the diagram form the software of Fabrizio we can see that the Z at low frequency is different for each trafo under test; the Fiat with 20H has a Z at 10Hz compliant with the theory written in some books where we must have a load that is 2Rp and in this case with 300B we are fine. So the tube at that frequency is capable to delivery current with a reasonable THd as the diagram of THD vs Freq show.
I stop here for the moment
Walter
Hi Walter,
Thank you for your thoughts. Let's compare notes...
However, I do expect the transformer's distortion spectrum to be different with and without bias, due to the different place of the operating point on the magnetization curve. If time allows (other projects get priority at the moment) I will do a test to see what happens.
If you want to go to full amplitude, the Rp must be transformed to the secondary and made the driving source's resistance, and Rl must be transformed to the primary as the load resistance(the T2 connection). Now you can kick it up to full voltage, at the price of a somewhat less accurate representation of the frequency response and probably the need to stay away from the LF -3dB point.
These are the two most important limitations of measuring the transformer backwards.
Do you have any idea if Fabrizio would appreciate a critical test/review of his software before it is publicly released? I'd be happy to do that.
Thank you for your thoughts. Let's compare notes...
I think we agree on this point, as the proper "forward" characterization requires either a pretty hefty generator or the driving tube(s) in question plus a proper power supply. The backwards method is certainly more convenient, and also a bit safer. However, the method has its limits, and these limits must be observed for the method to yield valid results.in my opionion the backward method is the best way to test the OT trafo with a simply test set up. At the moment is not available a good generator with almost zero output impedance, 0% Thd and a swing of around 600 Vpp. We are trying to do something but we stop at around the half, the main problem is that the P mosfet have a max voltage limited to 500/550 vdc.
I use ARTA myself, and I think it is very good when you know its limitations. With any sound card based measurement, you must take the results with a grain of salt once you venture outside the passband of the sound card/amplifier combo. This is because the input/output filter slopes are often defined by ceramic capacitors and cheap bipolar electrolytics because of space and cost. Even professional sound cards have this, but built-in laptop sound cards are particularly crappy in this respect. As a result, the slopes tend to be a bit variable, mostly as a function of temperature. You can partially compensate this with calibration, but do expect the calibration to drift over time. For accurate results, calibration must be performed after a good warm up period, every time before a measurement is made. A good (SE) OPT has a bandwidth exceeding the bandwidth of a typical soundcard, so the resulting measurements are indicative at best. A better interface would be a USB oscilloscope like the Picoscope with a built in function generator, as you will always be using the instrument within its passband. The better bit depth (24 vs 8 bits) of the sound card doesn't compensate for the filter slope issue.2-with a few dollars is possible to buy a ss amp kit with 50w rms that it is capable of a wide band to check the freq. response; it is not necessary to go at 200 khz, the shape of the curve tell us what we will have; in addition the THD vs freq also tell us something very important. And this is possible to have with VA or ARTA or Spectralab and a good sound card.
I was actually a bit surprised to see that the presence of bias (in the 300B measurement) didn't significantly affect the LF -3dB and -1dB points. I did expect that to happen. For HF behavior, indeed, the response must be the same, bias or not, because the capacitances and leakage inductances are all in air and thus perfectly linear. I'd like to make this point even stronger: any difference between a biased and unbiased measurement must be due to the bias source properties (most likely added capacitance), so the HF response is better measured without bias.3- Is not necessary to have the bias current, on S.E. OT, because if the goal is to understand in which way the stuff is working at low frequency we need to see the attenuation; with the bias it will be more attenuate . Each test we done in this way confirmed the final results with the entire amps. For high frequency the bias current is not involved because the capacitive components is more important
However, I do expect the transformer's distortion spectrum to be different with and without bias, due to the different place of the operating point on the magnetization curve. If time allows (other projects get priority at the moment) I will do a test to see what happens.
I don't understand what you're trying to say here. When you don't let the primary and secondary RMS currents exceed their allowable values, loading the primary with Rp is perfectly fine and nothing will be overloaded. You can't go to full amplitude, but you do get the most accurate representation of the frequency response.4- Is not a good method to use the load equal to the Rp of the tube we will use because we need to respect the nominal specs of the trafo; the reflected Z is not in one way ( sec to prim) but at the same time we have also the prim vs sec. So in this way we have the real test configuration. After this my opinion, in the backward test, of course we can check what will happen when we close the primary with a resistance that is the nominal Rp of the tubes we will use. But in this way we are forcing the trafo to do something hard.
If you want to go to full amplitude, the Rp must be transformed to the secondary and made the driving source's resistance, and Rl must be transformed to the primary as the load resistance(the T2 connection). Now you can kick it up to full voltage, at the price of a somewhat less accurate representation of the frequency response and probably the need to stay away from the LF -3dB point.
These are the two most important limitations of measuring the transformer backwards.
Measuring primary inductance with an open primary, secondary driven, is perfectly OK. I don't understand the "must have a load load that is 2RP" part, are you referring to the primary winding's inductive reactance at 20 Hz that, as a rule of thumb, needs to be equal to or greater than 2Rp?5- I f we look on the diagram form the software of Fabrizio we can see that the Z at low frequency is different for each trafo under test; the Fiat with 20H has a Z at 10Hz compliant with the theory written in some books where we must have a load that is 2Rp and in this case with 300B we are fine. So the tube at that frequency is capable to delivery current with a reasonable THd as the diagram of THD vs Freq show.
Do you have any idea if Fabrizio would appreciate a critical test/review of his software before it is publicly released? I'd be happy to do that.
timpert, thanx so much for spending the time and effort to present results - much appreciated.
If you get the chance, would you be able to clarify the OPT DC idle/bias current level for the 300B test profile in post #120, and where that idle bias point would approximately sit on the plot in post #91.
Wrt post #91, could you clarify that "f = 2 hZ, secondary driven to 420 mVrms, Lp = 45.2 H with the primary biased at 75 mA" relates to the local tangent slope where the primary winding current is measured to be 75mA?
For the OPT measurement setup with secondary being driven, was the primary winding floating (ie. isolated cro input channels), or was one end tied to Faraday screen, and also tied to driven secondary side and to transformer core?
With respect to the application of the test OPT, would its intended use with SV 572-10 have similar primary current signal swing and idle bias current as with a 300B output stage (I ask this as I'm not a SE aficionado)?
I've sometimes thought it may not be too onerous nowadays to make a floating resistive 'load' that can supply a suitable DC bias current for testing - such as a 150-300VDC supply and 4k series resistance. A smallish 12V VRLA battery (eg. 4-7Ah) could power a small cheap ebay dc/dc module with 150-300VDC regulated output, with an RC buffer - although C would need to be pretty substantial to keep impedance negligible at lower test frequencies. When I've measured primary inductance with DC bias its been with a simple test jig that typically applies a 'small-signal' test frequency at twice-mains, and with a DC current that I can fairly easily change for different spot measurements through the normal expected range (eg. of DC imbalance for PP OPT's, but out to larger DC levels as per choke testing for power supplies).
Last edited:
The plot has Vs on the vertical axis and ampere on the horizontal. Because the oscilloscope doesn't know the unit of the math result, it uses "EU". 200 mEU is thus 200 mA for the horizontal axis (50 mA/div) and 8 EU is 8 Vs (2 Vs/div) for the vertical axis.If you get the chance, would you be able to clarify the OPT DC idle/bias current level for the 300B test profile in post #120, and where that idle bias point would approximately sit on the plot in post #91.
The tangent slope suggests an inductance of 49.5 H, however, this figure is not very accurate, because I determined it simply by printing out the figure and drawing a tangent with a ruler. The inductance value calculated by the scope is calculated by calculating the peak stored energy, and using E = 0.5 L I^2 to derive the inductance. This approach ignores the (parallel) loss component caused by coercivity and thus results in a lower figure.Wrt post #91, could you clarify that "f = 2 hZ, secondary driven to 420 mVrms, Lp = 45.2 H with the primary biased at 75 mA" relates to the local tangent slope where the primary winding current is measured to be 75mA?
In real use, the primary's B+ connection is grounded for AC by the power supply capacitor. Here, I had grounded the B+ connection (which is the connection of the primary closest to the core), and also the "0" connection of the secondary, in order to make the parasitic capacitances appear exactly like they do in an amp. The transformer's Faraday shield is supposed to float, so I didn't connect it to anything. The core was grounded.For the OPT measurement setup with secondary being driven, was the primary winding floating (ie. isolated cro input channels), or was one end tied to Faraday screen, and also tied to driven secondary side and to transformer core?
It was made to operate with a bias of around 100 mA, and the magnetization curve suggests that it should be able to do so, albeit with a bit more distortion. The amp had ample power and strong bass, it sounded quite good. In all honesty, I liked it better than my later creation around the 300B.With respect to the application of the test OPT, would its intended use with SV 572-10 have similar primary current signal swing and idle bias current as with a 300B output stage (I ask this as I'm not a SE aficionado)?
I've sometimes thought it may not be too onerous nowadays to make a floating resistive 'load' that can supply a suitable DC bias current for testing - such as a 150-300VDC supply and 4k series resistance. A smallish 12V VRLA battery (eg. 4-7Ah) could power a small cheap ebay dc/dc module with 150-300VDC regulated output, with an RC buffer - although C would need to be pretty substantial to keep impedance negligible at lower test frequencies. When I've measured primary inductance with DC bias its been with a simple test jig that typically applies a 'small-signal' test frequency at twice-mains, and with a DC current that I can fairly easily change for different spot measurements through the normal expected range (eg. of DC imbalance for PP OPT's, but out to larger DC levels as per choke testing for power supplies).
There's no need to use a floating supply, because the B+ connection is always grounded for AC and thus can be tied to ground for characterization. I'd make something using cascoded MOSFETs or BJTs for biased measurements, but I haven't given this much thought yet. Perhaps I will, but I have a lot of other things that soak up my attention.
I hope this answers your questions.
@ Walter: take your time, there are no lives at stake...
Thanks timpert.
If I interpret that correctly, your sample OPT was designed to run with an idle bias of 100mA, although your 2Hz signal plot in post #91 would put that idle operating point sort of at the 'end' of the linear magnetisation region.
I'm not sure I understand your comment about the screen being designed to 'float' - was that really the intention for the screen (as a kind of equipotential sheet located somewhere within the windings) ?
I think my comment about a floating DC bias supply was more about avoiding an additional measurement system earth/ground loop.
Ta, Tim
Quote:
how can I calculate de primary load in OPT?
Answer and more:
The way the OPT will be used in a/the real amplifier is with the tube rp driving the primary, and the loudspeaker impedance loading the secondary. That is the “calculation”
So for testing, use primary resistor equal to rp; and the secondary resistor equal to the output tap rating, or equal to the loudspeaker rated “impedance” that is closest to the output tap that will be used. Using a resistor equal to the output tap rating allows all users to have a level playing field (since they will likely be using different loudspeaker models)
Some of the tests mentioned in the thread require both resistances to be in the circuits (primary and secondary), whether the testing is done in the forward mode, or in the reverse mode. It is only a matter of which resistance value is doing the ‘driving’ or doing the ‘loading’.
Another test should be done with the driving impedance equal to the tube rp (or the rated secondary load) as appropriate of hoe the transformer is tested: ‘forwards’ or ‘backwards’.
Then with the other winding open (no resistor connected), measure primary and secondary voltages. The ratio of these two voltages is the turns ratio.
The square of the ratio of the two voltages is the (unloaded) impedance ratio.
i.e. a ratio of primary voltage that is 25 times the voltage on an 8 Ohm secondary, means the primary is 5000 Ohms.
After that:
The same measurement is done with the other resistor connected across the winding that was just measured ‘open’. A new voltage ratio gives the loaded ratio.
Now:
The loaded voltage ratio/unloaded voltage ratio is related to the insertion power loss of the transformer.
dB loss = 20 Log ((loaded voltage ratio)/(unloaded voltage ratio)).
i.e. suppose the unloaded voltage ratio is 25. Suppose the loaded voltage ratio is 22.25.
Then the loss is 1dB (the loaded signal is -1 dB with respect to the unloaded signal).
Take a triode plate that drives 10 Watts into the transformer, and the transformer insertion is
-1dB (a loss).
The transformer output will be 7.94 Watts.
Surprising isn’t it?
hi
excuse me for delay
Unfortunately I haven't any good news at the moment.
I am pushing each time I can!!
Walter
excuse me for delay
Unfortunately I haven't any good news at the moment.
I am pushing each time I can!!
Walter
sure it is a coupler, I have no idea what good it could do in a SE transformer, but in a PP transformer it could be used to couple opposite primary charges and prevent them to mess with the secondary (at the expense of increasing the primary charging current)Surely a floating 'shield' is actually a coupler?
Last edited:
You can test same SE or P-P OT with this method.
Each trafo is a bi-directional device and you have a care to connect the right load on primary.
But also you can ply with different values.
And the driving voltage comes from a good ss amp is enough to get a different amplitudes for test.
The test of the OT trafo alone with a large swing is very difficult
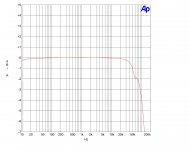
In attach an example of a freq. response
EL34 p-p, nominal 6000 ohm a-a, 8 ohm secondary.
From SS amp comes 17 Vout rms ( 1kHz as reference) , 8,5 volt on secondary of OT ( as expected) , primary closed to 6.000 ohm.
The V on primary are 220 Vrms, ratio 27,5 , as expected
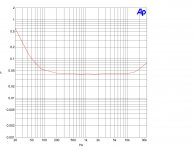
Then the Thd vs Req, at the same level; the results are not bad.
Walter
Each trafo is a bi-directional device and you have a care to connect the right load on primary.
But also you can ply with different values.
And the driving voltage comes from a good ss amp is enough to get a different amplitudes for test.
The test of the OT trafo alone with a large swing is very difficult
In attach an example of a freq. response
EL34 p-p, nominal 6000 ohm a-a, 8 ohm secondary.
From SS amp comes 17 Vout rms ( 1kHz as reference) , 8,5 volt on secondary of OT ( as expected) , primary closed to 6.000 ohm.
The V on primary are 220 Vrms, ratio 27,5 , as expected
Then the Thd vs Req, at the same level; the results are not bad.
Walter
Attachments
Walter, until you have made a valid comparison by testing then the method of driving the secondary is not verified, and just a proposal that you have not yet substantiated.
- Home
- Amplifiers
- Tubes / Valves
- OPT Characterization