You are on the right REW tab, but the legend shows the STEP is chosen.
Remove the [v] from the STEP and choose the first in that legend (Oct. 5 17:10:47)
Then zoom in on the first ~ 20 ms or so. That should show us an IR.
It should also show the reflection at 8ms as a peak. The second set of APL plots at 3 meter show a much later reflection, at 13 ms, right?
So it moved 5ms while you moved the mic back 2 extra meters.
Last edited:
Let me put this out there for comment. You can see a lot of time smearing of the bass response. The woofer has a split horn path. Its in a corner so there are multiple virtual images of those vertical slot apertures. Then there are the room resonances. Does this account for the widening of the impulse response, at least in the bass.
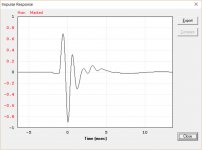
In a synergy, you have that reflection of the mid energy from the CD diaphragm to complicate the impulse response. . Here is what HR predicts for just the mids in my horn:
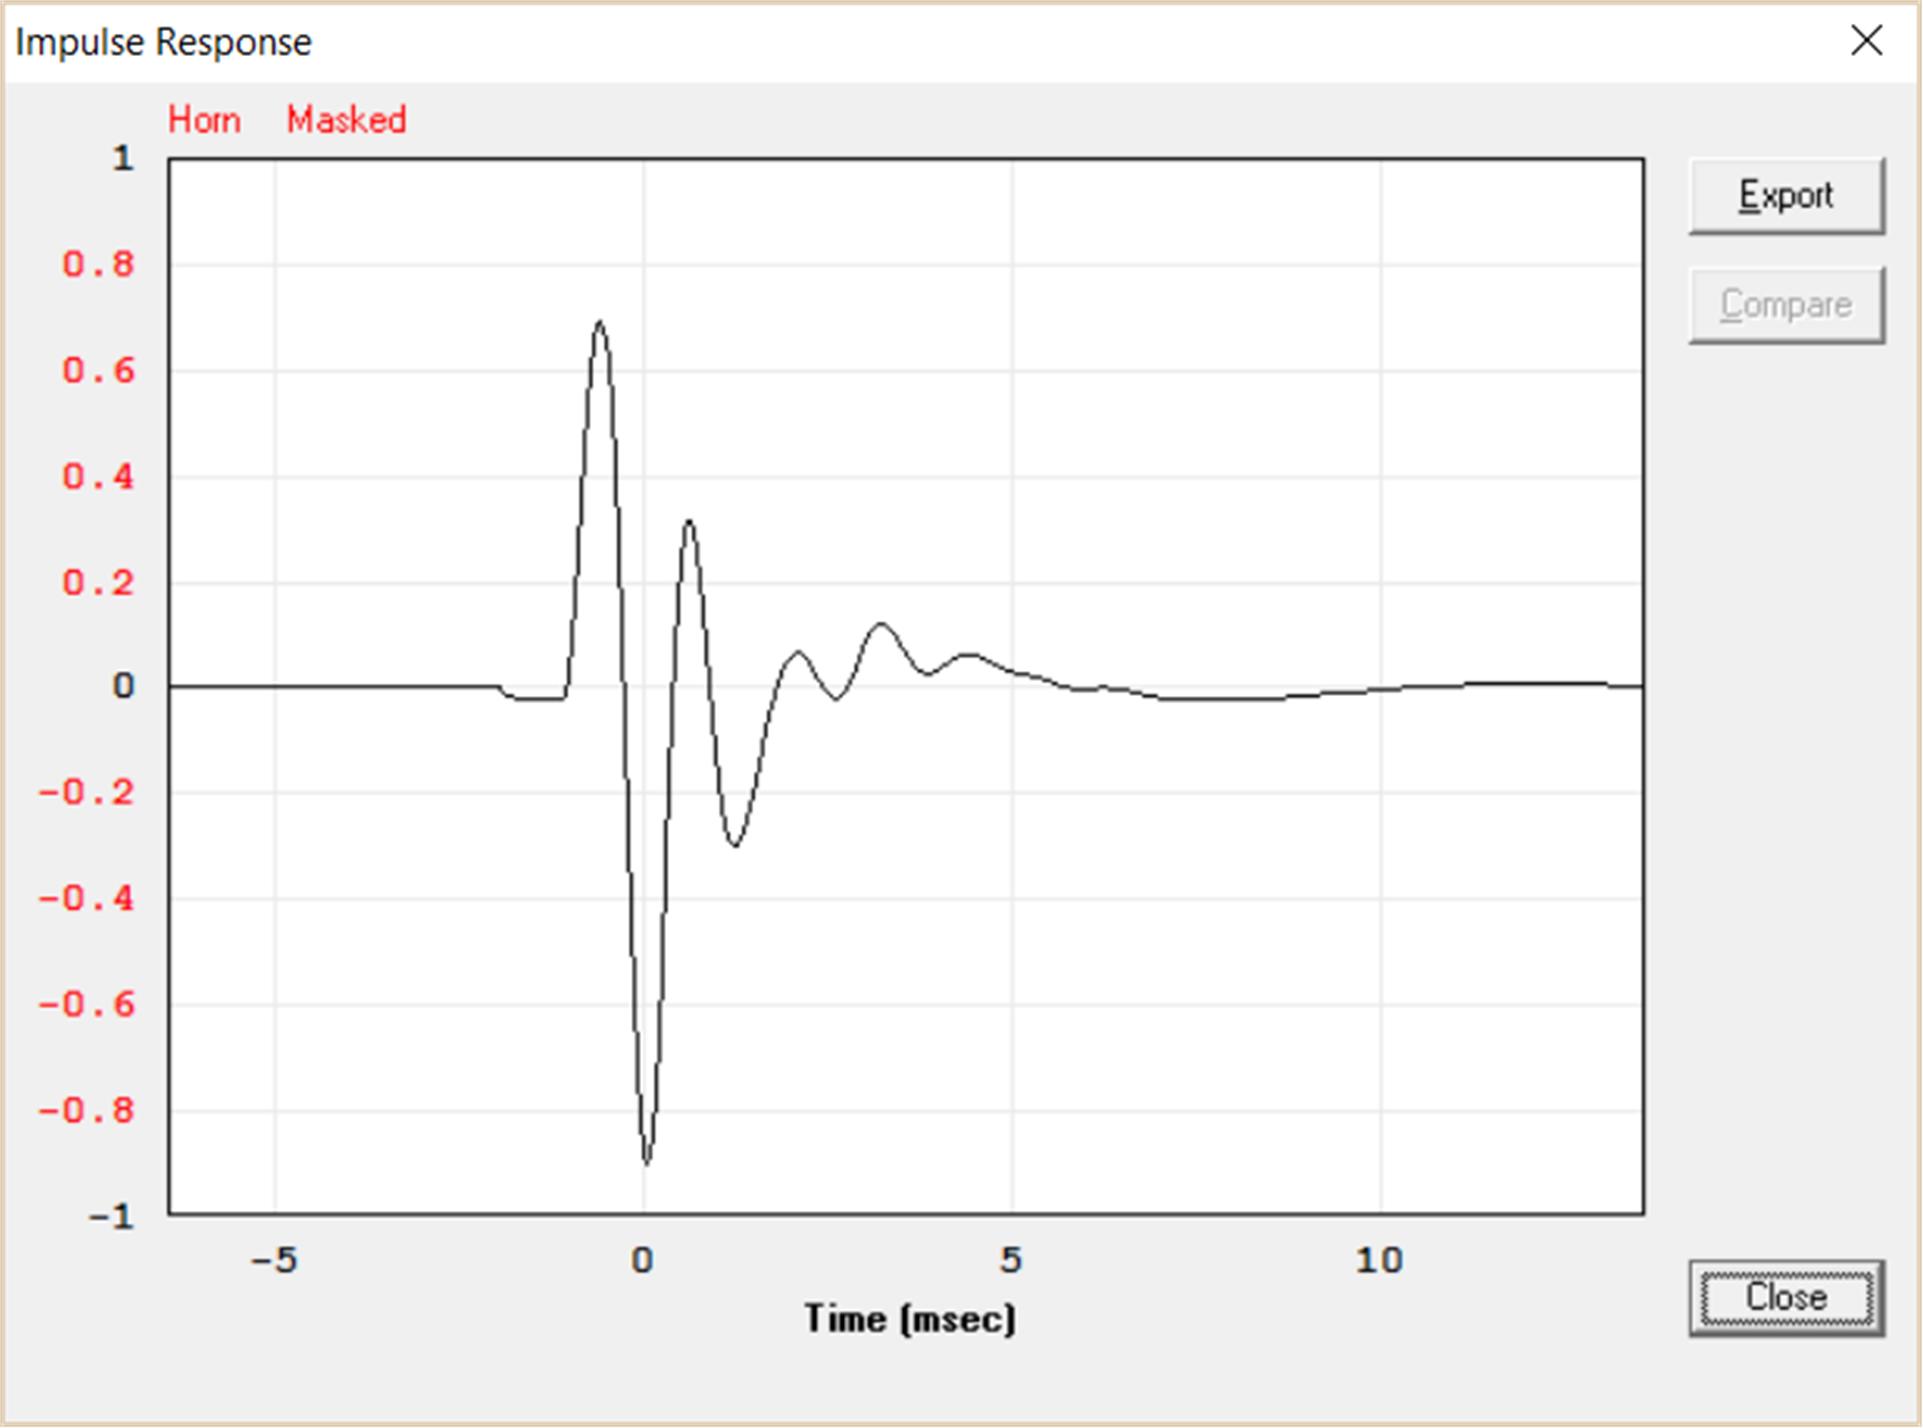
Its hard to see how one would get a classic IR from that. Bill, I'd love to see IRs from your Synergies.
jack
In a synergy, you have that reflection of the mid energy from the CD diaphragm to complicate the impulse response. . Here is what HR predicts for just the mids in my horn:
Its hard to see how one would get a classic IR from that. Bill, I'd love to see IRs from your Synergies.
jack
Attachments
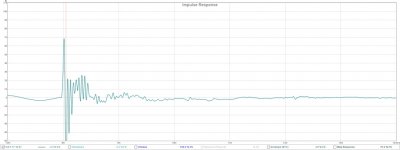
You are on the right REW tab, but the legend shows the STEP is chosen.
Remove the [v] from the STEP and choose the first in that legend (Oct. 5 17:10:47)
Then zoom in on the first ~ 20 ms or so. That should show us an IR.
It should also show the reflection at 8ms as a peak. The second set of APL plots at 3 meter show a much later reflection, at 13 ms, right?
So it moved 5ms while you moved the mic back 2 extra meters.
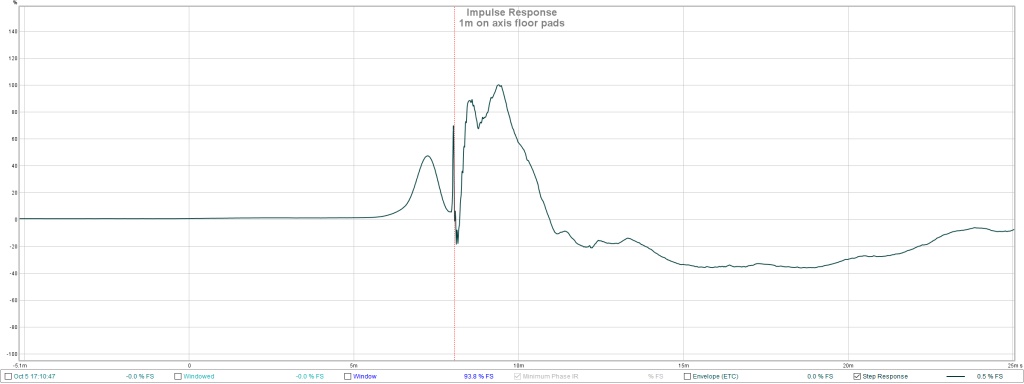
That is more like it. Thanks! Here is the 1m IR:
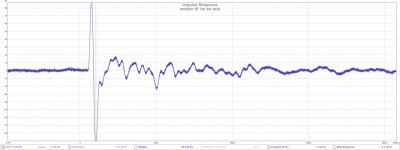
zoomed out:
Attachments
Last edited:
Let me put this out there for comment. You can see a lot of time smearing of the bass response. The woofer has a split horn path. Its in a corner so there are multiple virtual images of those vertical slot apertures. Then there are the room resonances. Does this account for the widening of the impulse response, at least in the bass.
jack
So much for that theory🙂
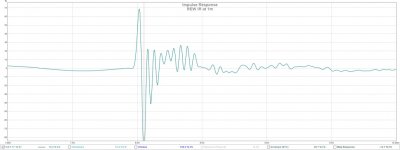
Here is the real woofer IR:
Attachments
REW and APL should agree on what's happening, but you've got to keep in mind that APL uses a series of frequency dependent windows to plot it's output. So to get an REW comparison you should also use a frequency dependant window for the two to agree.
In REW you can also use a Wavelet within the Spectogram tab. This should present similar data to APL when you set Time Range (ms) to ~30 ms.
In my case:

And it's APL equivalent:

See how they agree? Just a different graphical output based on processing very similar data. Taken within a few minutes of each other. If they don't agree with each other I'd look harder to find out what went wrong.
You're in a room. if you plot a 500 ms window in REW that room is in there. Below ~200 HZ it's in there anyways. APL filters in small frequency dependent slices to see what happens over time. REW can do frequency dependent windows but they tend to be overly smoothed. It does not use the same way of plotting APL does.
In REW you can also use a Wavelet within the Spectogram tab. This should present similar data to APL when you set Time Range (ms) to ~30 ms.
In my case:
And it's APL equivalent:
See how they agree? Just a different graphical output based on processing very similar data. Taken within a few minutes of each other. If they don't agree with each other I'd look harder to find out what went wrong.
You're in a room. if you plot a 500 ms window in REW that room is in there. Below ~200 HZ it's in there anyways. APL filters in small frequency dependent slices to see what happens over time. REW can do frequency dependent windows but they tend to be overly smoothed. It does not use the same way of plotting APL does.
Y The second set of APL plots at 3 meter show a much later reflection, at 13 ms, right?
So it moved 5ms while you moved the mic back 2 extra meters.
Yes, I see that now; need to think about it. I've got another view from another position that shows it at 16 ms. Maybe I can triangulate.
That first IR plot shows us about 6 ms after the main pulse? If there wasn't anything beyond that 14 ms point you don't have any additional reflections, yet APL did show us something there.
They definitely don't agree so far. They shouldn't be able to each tell a different story. So something went wrong. It's way past my bed time, I'm gonna go now. I hope Bill will show you his IR now that we actually see yours.
Something is fishy with the APL plots. They should confirm what REW tells us. Just look at my 2 plots, the REW Wavelet and APL's 2D plot... both show something in my room at 6 ms and ~5 KHz. The wavy shapes between 100 and 200 Hz are present in both plots...
Last edited:
Not past my bed time but I might have missed supper. Thanks for your helpThat first IR plot shows us about 6 ms after the main pulse? If there wasn't anything beyond that 14 ms point you don't have any additional reflections, yet APL did show us something there.
They definitely don't agree so far. They shouldn't be able to each tell a different story. So something went wrong. It's way past my bed time, I'm gonna go now.
NC535 -
A phase of 180 degrees is exactly the same as -180 degrees, so everything in the new phase plot
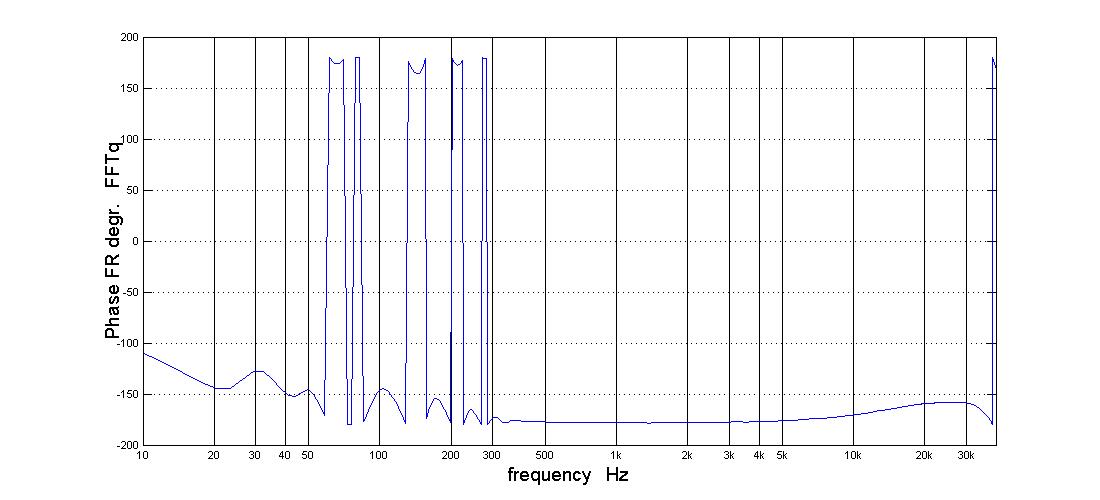
is within about 25degrees of flat. Invert the phase (via software or swapping speaker cable polarities) and you should see that.
Which I don't think is likely to be true using just IIR filters, unless you got the timing between tweeter and mid and their crossover roloffs rather amazingly right (in which case, I'm impressed). Is that maybe a "minimum phase" (Hilbert) converted version?
I was looking around and couldn't find a pic of the IR of the most recent passive crossover for Cosyne. But here is an earlier one
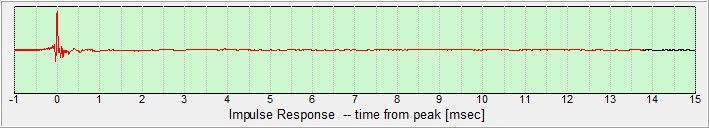
I think there's a more recent one somewhere in the thread there, I have company coming in a few minutes, but here is the thread link:
DIY Synergy/Unity spreadsheet | Page 3 | HiFiCircuit
The one that is further cleaned up with FIR is cleaner (as you'd expect). The Step Response (which doesn't just emphasize high frequencies like IR does) isn't as pretty, but still decent.
A phase of 180 degrees is exactly the same as -180 degrees, so everything in the new phase plot
is within about 25degrees of flat. Invert the phase (via software or swapping speaker cable polarities) and you should see that.
Which I don't think is likely to be true using just IIR filters, unless you got the timing between tweeter and mid and their crossover roloffs rather amazingly right (in which case, I'm impressed). Is that maybe a "minimum phase" (Hilbert) converted version?
I was looking around and couldn't find a pic of the IR of the most recent passive crossover for Cosyne. But here is an earlier one
I think there's a more recent one somewhere in the thread there, I have company coming in a few minutes, but here is the thread link:
DIY Synergy/Unity spreadsheet | Page 3 | HiFiCircuit
The one that is further cleaned up with FIR is cleaner (as you'd expect). The Step Response (which doesn't just emphasize high frequencies like IR does) isn't as pretty, but still decent.
Actually, I think the phase plot might be showing a phase plot from a wired bypass, I've never seen a compression tweeter with flat phase (never mind magnitude) out to 40kHz!
One more question from me, in APL, what does the AFR plot show? That's it's frequency plot. I'll look at it in the morning 😀.
Actually, I think the phase plot might be showing a phase plot from a wired bypass, I've never seen a compression tweeter with flat phase (never mind magnitude) out to 40kHz!
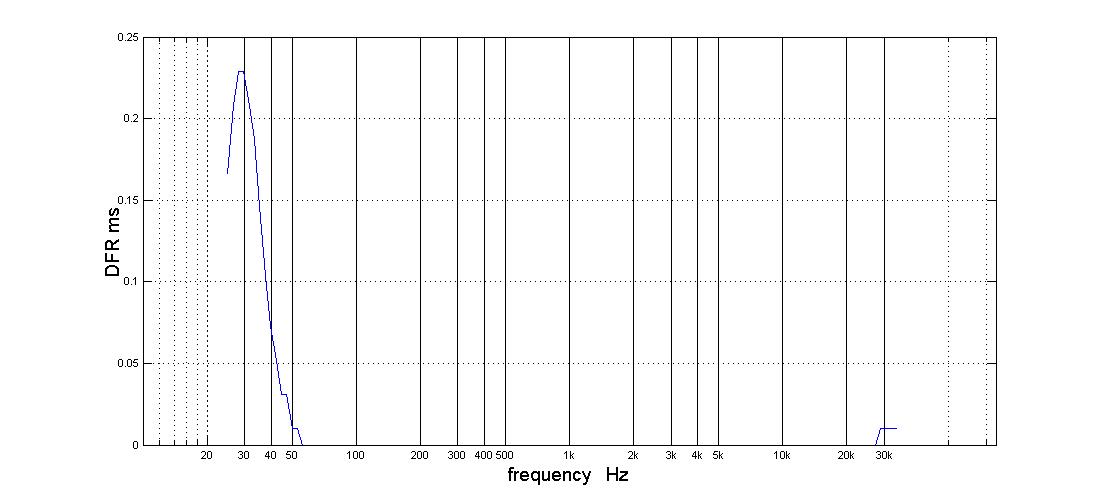
It's so intriguing I'm still here... I was suspecting the same thing. Which is why I asked for APL's equivalent to a FR plot, the AFR. DFR would also be interesting, I can't imagine woofer output that straight with only using IIR filters. Plus the distinct reflection APL shows isn't there in REW.
Do you use a loop back in REW to get your timed response? REW usually finds the peak and sets that to zero. Yet your's shows up at 8 ms. Coincidently the same figure APL shows the main reflection. I'm suspecting you measured a stereo signal in APL, one side is your timing loop back from REW, the other is the actual speaker trough the mic.
😱
Just guessing here, but that would explain the differences I see.
Thanks for the IRs. They will help me sanity check.NC535 -
A phase of 180 degrees is exactly the same as -180 degrees, so everything in the new phase plot
is within about 25degrees of flat. Invert the phase (via software or swapping speaker cable polarities) and you should see that.
Which I don't think is likely to be true using just IIR filters, unless you got the timing between tweeter and mid and their crossover roloffs rather amazingly right (in which case, I'm impressed). Is that maybe a "minimum phase" (Hilbert) converted version?
No that is a real IIR result . The only DSP I'm using is MiniDSP 4x10, which isn't capabile of FIR. I ddn't do a minphase conversion or display. What I did was spend hours literally dialing it in.
I was also surprised at the result. But if you get a flat frequency response, don't you then expect a flat phase response? ...Except where its not minphase.... When I ask TDA to subtract the minphase components, the phase plot flattens out. Its seem to be the same plot with those phase flips removed.
If +180 and -180 are the same, and they are obviously the same on a circle, and I do recall the rotating phasor diagram lecture from EE 101, why does the phase plot flip back and forth? I know - phase wraps where the delay that phase integrates to is a full cycle. If I ask TDA for a minphase corrected group delay plot I get something that asymptotically approaches a perfectly flat line as frequency rises, visually flat above about 80 Hz.
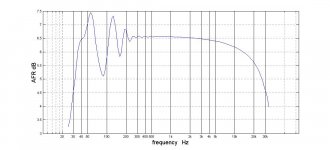
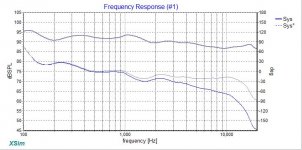
You can see in the REW plots that no data is taken above 20 Khz. TDA apparently sweeps to about 32 khz but you can't really see amplitude response in the 3D TDA plot. Parallax will get you if nothing else. Here is what APL calls the AFR:
and yes, the response is indeed tapering off in the high end, making it fair to ask why is the phase flat. There may be an explanation in the way APL does things. I look to REW for timing info. TDA is better for visualizing group delay and room impacts. It also has proprietary mechanisms for deciding what to correct and for doing the measurement and correction but I haven't got to them yet.
So tomorrow I will try to reconcile REW and TDA...
Attachments
It's so intriguing I'm still here... I was suspecting the same thing. Which is why I asked for APL's equivalent to a FR plot, the AFR. DFR would also be interesting, I can't imagine woofer output that straight with only using IIR filters. Plus the distinct reflection APL shows isn't there in REW.
Do you use a loop back in REW to get your timed response? REW usually finds the peak and sets that to zero. Yet your's shows up at 8 ms. Coincidently the same figure APL shows the main reflection. I'm suspecting you measured a stereo signal in APL, one side is your timing loop back from REW, the other is the actual speaker trough the mic.
😱
Just guessing here, but that would explain the differences I see.
Yes, I'm using a timing reference loop back in REW. I have REW set for mono output, so ch1 and ch2 should be the same. (Would it make any difference if it were set to "stereo"?) Ch2 is looped back, both ch1 and ch2 connect to the MiniDSP but the speaker is driven by ch1. If REW was displaying the FR of a wire how would that wire get the amplitude variation that we see?
If anything is suspect, it would be APL but only because APL is more of a black box, no reflection on APL or pun intended. APL doesn't have a preferences screen for example or much control of the sound card. From the APL screen, I can see I've set its output for mono and input for "left". I need to do another APL measurement with input set to "right". One of those two is a direct wire. But a wire would be perfectly flat and the APL results are not those of a wire, even though the group delay is impressively flat.
Your theory looks pretty good but how do you account for my first two TDA plots, those taken at 1m both with and without floor pads?
How do you account for that ghost reflection if we are looking at the response of a wire?
There is no way REW could be showing me the response of a wire. Yes, I've produced a trace that looks flat, from a distance at any rate, but that is the result of hours of tweaking. What I started out with was anything but flat and in no way resembled a wire.
This is not a wire! (high dynamic range option)

and if I should turn out to be wrong, just remember that I started out by saying it was too good to be true🙂
How do you account for that ghost reflection if we are looking at the response of a wire?
There is no way REW could be showing me the response of a wire. Yes, I've produced a trace that looks flat, from a distance at any rate, but that is the result of hours of tweaking. What I started out with was anything but flat and in no way resembled a wire.
This is not a wire! (high dynamic range option)
and if I should turn out to be wrong, just remember that I started out by saying it was too good to be true🙂
Attachments
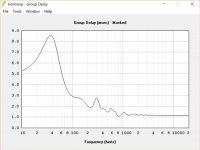
Here is a HR plot of the bass bin group delay. I have dsp delay dialed in to match group delay at the 210 hz XO to the Synergy.
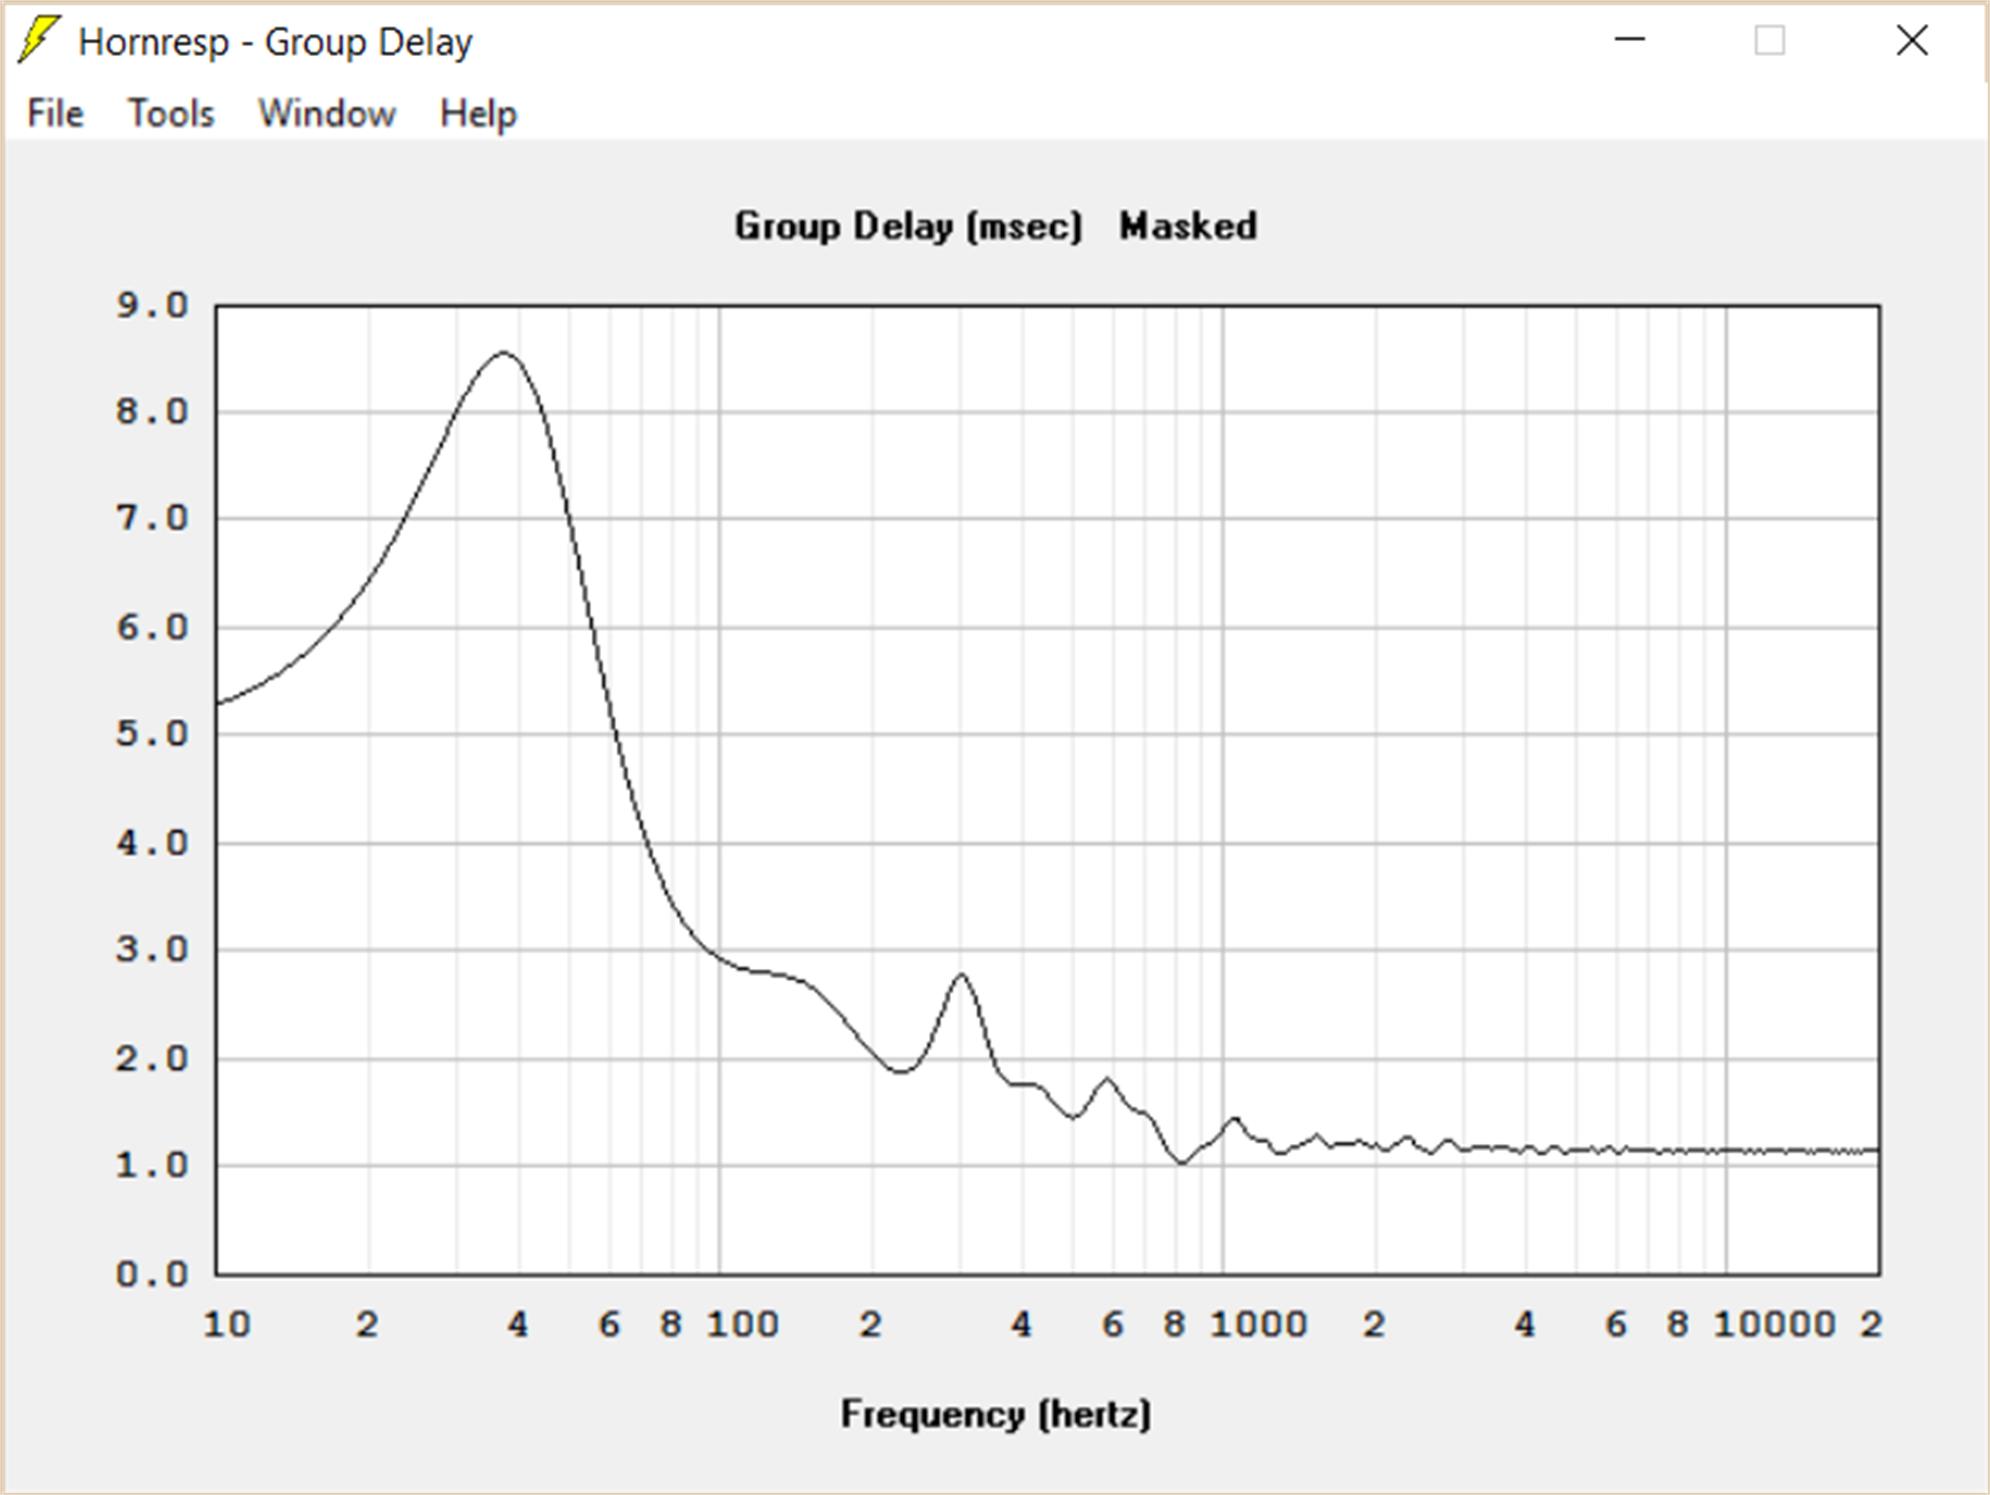
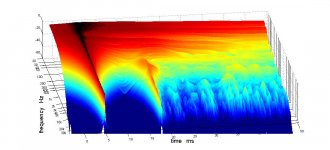
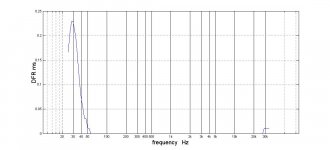
Here is group delay from APL.
They are not inconsistent with each other. The slow rise of GD between 80 and 200 hz that we see in HR is hidden in the thickening of the trace in the APL 3D plot.
Here is group delay from APL.
They are not inconsistent with each other. The slow rise of GD between 80 and 200 hz that we see in HR is hidden in the thickening of the trace in the APL 3D plot.
Attachments
But if you get a flat frequency response, don't you then expect a flat phase response?
Only for a single driver or device.
I'd about NEVER expect a flat phase response with a multi-way speaker! Unless the designer went to an immense amount of trouble. Even Danley's SH50 isn't all that flat in phase. (I don't count the first order crossover speakers using non-concentrically placed drivers, which can show a pretty flat phase response but only if the microphone is at a very precise location).
If +180 and -180 are the same, and they are obviously the same on a circle, and I do recall the rotating phasor diagram lecture from EE 101, why does the phase plot flip back and forth?
It doesn't. If the phase moves from -179 degrees and then to +179 degrees, then it has only moved two degrees, but that graph will make it look like it went all the way around the clock because it is set to show phase as "wrapped". Meaning it will never show anything below -180 degrees or above +180 degrees. Actual change is from -179 degrees to -181 degrees, i.e., -181 degrees will be shown as +179 degrees, and the software plotting routine is playing "connect the dots" between its calculated or measured frequency points. Take any angle and add any integer multiple of 360 degrees to it and you have the same angle in every way except for the number shown and perhaps how it might be graphed. The concept of phase is based on sine waves, and looking at a single frequency, you can never know how many whole periods of a sine wave it might have been shifted from one picture to the next. Look at a continuous graph of phase over a wide range of frequencies, starting from 0Hz you can, but we can never see speaker response at 0Hz nor do we ever really get a continuous graph of phase (it is always at a series of discrete frequency samples).
That is actually feasible (to get near flat phase with tapering high end). Another thing about phase response measuring is that it is usually shown in a relative way, IOW, it is shown with enough delay added or subtracted to make the phase look flat over some range or to minimize the number of phase "wraps" (which often signify not much of anything, as discussed above). Adding a fixed delay is the same kind of thing you'd get from moving the measuring mic closer or further from the speaker. Phase is never really flat at 0 degrees because that can only be at a place where there's no room for a mic - it is at best 0 degrees plus-or-minus the effects of some fixed delay! Since phase is "periodic" (the -180=+180 thing), most software will remove delay to make the phase plot more comprehensible by minimizing jaggy looking wraps or best flattening the curve at HF.The response is indeed tapering off in the high end, making it fair to ask why is the phase flat.
Another display option is "unwrapped phase" display, but that tends to give poor display resolution as the vertical scale can get to spanning thousands of degrees, so is seldom used.
For example, here are some phase responses of the same magnitude response, of the same speaker in fact, measured with different amounts of delay included. The difference in delay here is equivalent to moving the microphone 2 tenths of an inch!:
Attachments
Last edited:
Is your mic (soundcard recording input) maybe set to "single channel"? That's what Windows defaults to since Windows 7, you have to physically change it. Also, if you plug a USB mic or soundcard into a different USB socket on the computer, you have to set it for stereo again since Windows won't recognize the same USB recorder on a different socket.
If it is combining both channels of recording together, that can mess up the response normalization and also give you a result that is a combo of microphone and the direct bypass. The direct will be the leftmost time peak, the microphone's peak will include the time of flight travel.
If it is combining both channels of recording together, that can mess up the response normalization and also give you a result that is a combo of microphone and the direct bypass. The direct will be the leftmost time peak, the microphone's peak will include the time of flight travel.
Last edited:
Thanks Bill.
I have a new suspicion about what is going on. I had some trouble getting the sound card driver to run with APL. With the old sound card, I could go back and forth between REW and APL. With the new sound card, APL gave me input format errors. To get beyond them I had to load the application that came with the sound card and then I could use its ASIO control panel to configure the sound card to 96K samples/sec and APL again consented to do measurements. Without this app running, windows set it to 44.1K, causing APL to complain.
Why is that relevant? The application is a mixer and the sound card has two live inputs: one from the mic and the other a direct loopback of the line output. Does what we are seeing in APL look like it could be the sum of the mic plus the reference loopback?
This shouldn't be happening because in APL I select just one of these inputs but I will definitely do some measurement/experiments first thing tomorrow to confirm or rule out this hypothesis. I never did see any knobs on the application screen to control the mixing process and until now never connected mixing with reference loopback.
It would be too disruptive to go out in the garage and try it tonight.
- Home
- Loudspeakers
- Multi-Way
- My Synergy Corner Horn and Bass Bins