Don't forget that the lowpass you will apply to both woofer and midrange will delay their outputs (non-constant, too) unless FIR. On my larger synergies, I had to add an allpass network to delay the tweeter further when doing it passively.
Good to see more people using APL_TDA. It doesn't give much more info than you can find in REW, but it sure makes it a lot easier to read. Saves a lot of time to see the timing you have and where the room takes over.
I don't know if the test signal of APL_TDA is slightly different from REW, I used the measurements suite within APL_TDA. Though I've played with importing IR's to see what that looks like.
It is indeed "scanning" for the highest value within the signal and plots that. The 2D/3D plots are normalised. Even the demo version of APL_TDA is a useful addition to REW. Raimonds did offer a generous discount to forum members here.
I still have to try his correction suite one day.
As times go thanks nice sharings of precision and hard work here including the story where your wife wife poked here head in from the family room to tell you how fantastic it sounded, that is great to hear warm things as that in the middle of all the serious stuff, hope health is better now and thoughts include bwaslo too.
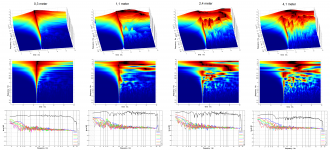
Agree wesayso its good to see those shared APL_TDA plots, it seems be very pro tool to dial in timing for summing band-passes. For grins here a 2-way direct radiator spreader placed up against a wall in a 4x5 meter cellar room with various furniture and 2 meter ceiling height, expect your synergy down the road will do much better out in room : )
Seen in some APL_TDA paper Raimonds Skuruls talk about TDS (Time delayed spectrometry) implementation and remember in past reading Tom Danley talk about same TDS thing with his TEF machine that should be very precise instrument.
Attachments
Last edited:
Re' Bill's guess about DFR in a spectrogram
Yes, you can see the DFR in a spectrogram, most clearly in the TDA 3D spectrogram attached to my previous post, as the black, highest intensity, line following the top of the ridge. You don't need to extract it from a spectrogram; things like REW and OmniMic can produce it directly and I've seen correlation between REW GD and TDA DFR or GDR when using the same windows.
APL_TDA can produce raw frequency response (AFR) and delay frequency response (DFR and GDR) and windowed curves. The processing for the latter is called FFT Q window analysis. Q windowing is said to limit the ringing of particular impulse response to value of Q set by the user and to eliminate most of environment’s reflections. Below I'm showing the raw AFR for my time aligned 3 driver sum w/o XO followed by windowed AFRs at Q = 2 below the raw graph, Q=8 to its right and Q=4 in the upper left.

As I mentioned briefly before, the Q-windowed curves can be produced with or without minimum phase subtracted. By comparing the with/without curves you can see in phase or group delay domains what is non-minimum phase, and thus likely to be something the room is doing to you, provided you are at least close to time alignment.
Yes, you can see the DFR in a spectrogram, most clearly in the TDA 3D spectrogram attached to my previous post, as the black, highest intensity, line following the top of the ridge. You don't need to extract it from a spectrogram; things like REW and OmniMic can produce it directly and I've seen correlation between REW GD and TDA DFR or GDR when using the same windows.
APL_TDA can produce raw frequency response (AFR) and delay frequency response (DFR and GDR) and windowed curves. The processing for the latter is called FFT Q window analysis. Q windowing is said to limit the ringing of particular impulse response to value of Q set by the user and to eliminate most of environment’s reflections. Below I'm showing the raw AFR for my time aligned 3 driver sum w/o XO followed by windowed AFRs at Q = 2 below the raw graph, Q=8 to its right and Q=4 in the upper left.
As I mentioned briefly before, the Q-windowed curves can be produced with or without minimum phase subtracted. By comparing the with/without curves you can see in phase or group delay domains what is non-minimum phase, and thus likely to be something the room is doing to you, provided you are at least close to time alignment.
the website was down for me all day. I didn't meant to ignore those posts.
Thanks for the good wishes, BYRTT.
That was pretty much my main point, Wesayso, that it makes it so much easier to see. Had it not, I might have continued missing "it" for a while longer.
Bill: I had the same thought that any XO filters will have group delay. The problem I have with taking that into account, other than by iterating through measurement or a complicated export/import process, is that in ACD (my XO software) the modelled DSP delay "pollutes" the system phase delay chart and there is no group delay chart.
Hmm... I should add that "delay frequency response" type plot to Xsim as another plot to watch while tuning. But there are too many other things I'm supposed to do in there, so if I open that up it might be a long project. Better for winter work.
Re-evaluting the 3 measurement method
Why couldn't I find time alignment the conventional way? Inexperience is one reason. The other is that for this instance at least, there is a never a perfect, unmistakable match between the acoustic and simulated sum. I went back to ACD and took another look.

I've got the .2 ms delay case above the zero delta delay case. I'm trying to get the white trace to overlay the dark blue. Neither is a compelling match. The .2 ms delay matches best through the crossover region. With the benefit of hindsight, I see it is the one I should have picked.
Two things I've learned:
- the CD despite being farthest back in the horn needs more delay
- if you can't be the traces aligned over a wide range, align them at crossover
Why couldn't I find time alignment the conventional way? Inexperience is one reason. The other is that for this instance at least, there is a never a perfect, unmistakable match between the acoustic and simulated sum. I went back to ACD and took another look.
I've got the .2 ms delay case above the zero delta delay case. I'm trying to get the white trace to overlay the dark blue. Neither is a compelling match. The .2 ms delay matches best through the crossover region. With the benefit of hindsight, I see it is the one I should have picked.
Two things I've learned:
- the CD despite being farthest back in the horn needs more delay
- if you can't be the traces aligned over a wide range, align them at crossover
Hmm... I should add that "delay frequency response" type plot to Xsim as another plot to watch while tuning. But there are too many other things I'm supposed to do in there, so if I open that up it might be a long project. Better for winter work.
If you could link XSIM to OmniMIC so that the tools of OmniMIC could be used to analyze the frequency response generated by XSIM in real time, you might have something.
IR method of time alignment
I've been meaning to connect a time reference loop back on my sound card for some time now but didn't get around to it until yesterday. Now the speaker sits directly on the garage floor as it will up in my listening room. It was time for another set of measurements.
My intention was to look at the IRs to determine the DSP delays needed for time alignment.
My first thought was just to let REW do the work and just read the delays off the cursor. This indicated that the MIDs and the CD each needed a 2 ms delay to align with the Bass Bin at 1m on axis. (Yes, a different delay will be needed out at the LP.)
Dialing in those delays and remeasuring I saw that there was still a time offset between the mids and CD and a polarity issue as well:
I next dialed in 2.19 ms delay for the CD and got this composite IR of all 3 drivers.
You've already seen how that looks in APL_TDA. I wish I had done this sooner!
I've been meaning to connect a time reference loop back on my sound card for some time now but didn't get around to it until yesterday. Now the speaker sits directly on the garage floor as it will up in my listening room. It was time for another set of measurements.
My intention was to look at the IRs to determine the DSP delays needed for time alignment.
An externally hosted image should be here but it was not working when we last tested it.
My first thought was just to let REW do the work and just read the delays off the cursor. This indicated that the MIDs and the CD each needed a 2 ms delay to align with the Bass Bin at 1m on axis. (Yes, a different delay will be needed out at the LP.)
Dialing in those delays and remeasuring I saw that there was still a time offset between the mids and CD and a polarity issue as well:
An externally hosted image should be here but it was not working when we last tested it.
I next dialed in 2.19 ms delay for the CD and got this composite IR of all 3 drivers.
An externally hosted image should be here but it was not working when we last tested it.
You've already seen how that looks in APL_TDA. I wish I had done this sooner!
I made an XO using these time delays and prior measurements.
Here is the frequency response:

Here is its impulse response:

You can see some slight CD-mid driver time mis-alignment remaining. I was going to tweak this out but I got distracted by another anomaly. In this APL_TD display, note the group delay step and resonance at/around 300 Hz.

Note also the 324 hz null in my ungated, unsmoothed MID frequency response:

This null only appeared when I took the speaker off the dolly and set it down on the floor 6" lower. It starts disappearing when I set a gate at 20 ms and is gone completely with a 10 ms gate.
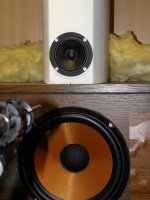
To find out where it was coming from, I set some fiberglass panels up behind the mic (hmmm, the sw compressed the picture vertically)

and then ran a APL_TDA sweep. Well there is nothing behind the mic within the implied distances except garage floor so this must be back scatter off the floor.
The resonance/reflection at around 300 Hz is now mostly gone.
Here is the frequency response:
Here is its impulse response:
You can see some slight CD-mid driver time mis-alignment remaining. I was going to tweak this out but I got distracted by another anomaly. In this APL_TD display, note the group delay step and resonance at/around 300 Hz.
Note also the 324 hz null in my ungated, unsmoothed MID frequency response:
This null only appeared when I took the speaker off the dolly and set it down on the floor 6" lower. It starts disappearing when I set a gate at 20 ms and is gone completely with a 10 ms gate.
To find out where it was coming from, I set some fiberglass panels up behind the mic (hmmm, the sw compressed the picture vertically)
and then ran a APL_TDA sweep. Well there is nothing behind the mic within the implied distances except garage floor so this must be back scatter off the floor.
An externally hosted image should be here but it was not working when we last tested it.
The resonance/reflection at around 300 Hz is now mostly gone.
This morning I started over again measuring that original IR time aligned XO first with a single absorber pad directly in front of the speaker and next with a second absorber on the floor essentially in back of the mic.
Here is a shot of the measurement setup
With absorption behind the mic, that null is gone.
An externally hosted image should be here but it was not working when we last tested it.
Here is a shot of the measurement setup
An externally hosted image should be here but it was not working when we last tested it.
With absorption behind the mic, that null is gone.
Yeah, this is great work! So at least the horn itself seems very well behaved. Rooms are a bit trickier. 🙂
I then re-tweaked the crossover, starting by dialing in the additional DSP delay I needed for the CD per the IR measurement. This introduced a small peak/dip at the 950 Hz XO that I reduced with a single PEQ.
Here is an APL_TDA sweep of the final result.
The delay through the 950 Hz CD/Mid XO is quite flat.
The 300 Hz resonance/floor reduction is still present but much reduced compared to bare concrete. In the listening room, I'll heavy padded carpet which probably won't do much to 300 Hz. I'm surprised the sound isn't scattered forward more away from the mic.
Here is the frequency response:
Here is the same response with ERB smoothing:
I like my bass a little hot but I can see I need to pull down the high end a little more. I haven't really tried to voice these speakers but I've done enough to realize it makes a difference.
Here is the APL_TDA display of harmonic distortion:
The 2nd bass unit will help down at the very low end.
Here is an APL_TDA sweep of the final result.
An externally hosted image should be here but it was not working when we last tested it.
The delay through the 950 Hz CD/Mid XO is quite flat.
The 300 Hz resonance/floor reduction is still present but much reduced compared to bare concrete. In the listening room, I'll heavy padded carpet which probably won't do much to 300 Hz. I'm surprised the sound isn't scattered forward more away from the mic.
Here is the frequency response:
An externally hosted image should be here but it was not working when we last tested it.
Here is the same response with ERB smoothing:
An externally hosted image should be here but it was not working when we last tested it.
I like my bass a little hot but I can see I need to pull down the high end a little more. I haven't really tried to voice these speakers but I've done enough to realize it makes a difference.
Here is the APL_TDA display of harmonic distortion:
An externally hosted image should be here but it was not working when we last tested it.
The 2nd bass unit will help down at the very low end.
Learning the APL software myself...going to be using it in my car.
Raimonds has been excellent to deal with so far.
Raimonds has been excellent to deal with so far.
Last edited:
Have you tried using time lock in Holm? It works perfectly for getting inter driver time delay, i.e., phase difference.
That last plot is looking pretty sweet 🙂
Thanks. That was a couple of days ago but I remember sitting back and smoking a virtual cigar in satisfaction when I first saw it.
Have you tried using time lock in Holm? It works perfectly for getting inter driver time delay, i.e., phase difference.
I've been meaning to try it ....
REW marks midpoints of slopes but different BW driver waveforms have different risetimes. When I did it manually, I timed the peaks, which worked for an XO starting point. Today's iteration was to correct for differential crossover filter group delay.
Great progress, but as I've been told: Please use the attachment function! I can't see any of the pics from https://lh3.googleusercontent.com/
If you wan't the pics to be inline with the text (instead of grouped at the bottom) you can use the paper clip button when making a post.
/Anton
If you wan't the pics to be inline with the text (instead of grouped at the bottom) you can use the paper clip button when making a post.
/Anton
Great progress, but as I've been told: Please use the attachment function! I can't see any of the pics from https://lh3.googleusercontent.com/
If you wan't the pics to be inline with the text (instead of grouped at the bottom) you can use the paper clip button when making a post.
/Anton
Hi Anton:
I am using the "insert image" button, the one that looks like an envelope, to get images inserted in line with the text. This appears to work on both my laptop with Chrome browser and my android devices.. When I use the paperclip attachment button, as I did in the beginning of this thread, the images show up only as attachments at the bottom of the post.
BTW, that link to google didn't work for me.
If you are having a problem, it may be because these pictures and graphs are fairly high resolution. There may be a choke point between you and the google photo servers. I see that they are slow to load and so I'm going to dial that back in the future. Hope that helps,
Jack
- Home
- Loudspeakers
- Multi-Way
- My Synergy Corner Horn and Bass Bins