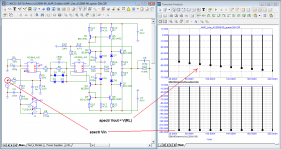
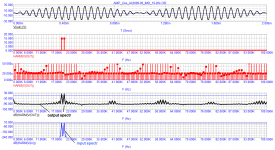
I am reproached here that I use the wrong transistor models. Replaced models with those corrected by Bob Cordell. Here is the result. Areas enclosed by a square are enlarged and shown in separate figures.
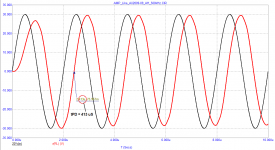
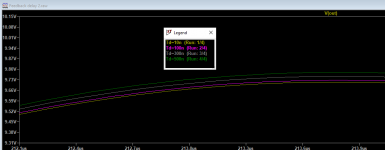
the time to reach the steady state takes about 3 μs
Why don’t you plot the difference in voltage between the inverting input and the non-inverting input ( simple subtract will work).
Then to a Fourier analysis on the resulting signal while you step Cdom from say suboptimal minimal value all the way through to sub optimally excessive.
I am reproached here that I use the wrong transistor models. Replaced models with those corrected by Bob Cordell. Here is the result. Areas enclosed by a square are enlarged and shown in separate figures.
the time to reach the steady state takes about 3 μs
How does a simulation account for charging of various capacitors and transistor diffusion capacitance in a circuit.
There is quite a lot of diffusion capacitance in power transistors.
Nothing happens in a simulation until you press "Run".
That could be taken as commencing from a quiescent state with power on or else it could involve starting from zero and powering up - which could easily account for the 3uS delay which does not recur after the first cycle.
I don't believe FCD exists and think we should involve the software experts to help resolve the "Run" interpretation issues.
Back in 1981, Jiri Dostal gave calculations (formulas 8.5 and explanations to them), according to which the signal propagation delay time should not exceed 100 ns in order for the distortion of the audio range signals to be invisible to the human auditory system.
Unfortunately, no one understood his conclusions, and the overwhelming majority of developers continue to develop equipment guided by only one parameter (THD), which does not correlate with sound quality in any way.
Take this amplifier, for example.
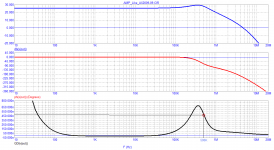
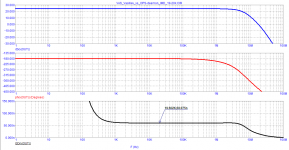
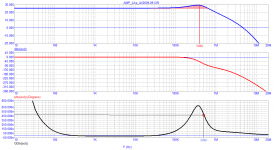
Amplifier without general feedback, constant current amplifier, signal propagation delay time in the audio range is close to zero. It would seem that something else is needed. In theory, it should meet the requirements of Cyril Hammer.
However, let's take a closer look at the behavior of the group delay outside the audio band. Literally immediately behind the sound range, the delay begins to increase and reaches 700 ns by the frequency of 350 kHz.
I have already pointed out more than once that for the minimum speed distortions, the group delay should be no more than 100 ns, have as long a horizontal section as possible (not less than 200 kHz) and have a smooth falloff at the end.
Developers who understood what the GDelay influences began to indicate this parameter in the manuals for the equipment.
Unfortunately, no one understood his conclusions, and the overwhelming majority of developers continue to develop equipment guided by only one parameter (THD), which does not correlate with sound quality in any way.
Take this amplifier, for example.
Amplifier without general feedback, constant current amplifier, signal propagation delay time in the audio range is close to zero. It would seem that something else is needed. In theory, it should meet the requirements of Cyril Hammer.
However, let's take a closer look at the behavior of the group delay outside the audio band. Literally immediately behind the sound range, the delay begins to increase and reaches 700 ns by the frequency of 350 kHz.
I have already pointed out more than once that for the minimum speed distortions, the group delay should be no more than 100 ns, have as long a horizontal section as possible (not less than 200 kHz) and have a smooth falloff at the end.
Developers who understood what the GDelay influences began to indicate this parameter in the manuals for the equipment.
Attachments
-
 AMP_Like_AX2009-09_SCH.png26.8 KB · Views: 364
 -
 AMP_Like_AX2009-09_Bode.png47.3 KB · Views: 365
 -
 AMP_Like_AX2009-09_IMD_19-20kHz.png33.3 KB · Views: 348
 -
 AMP_Like_AX2009-09_FCD.png81.5 KB · Views: 358
 -
 AMP_Like_AX2009-09_20k-spectr_(FCD).png70.2 KB · Views: 345
 -
 AMP_Like_AX2009-09_500kHz.png24.8 KB · Views: 161
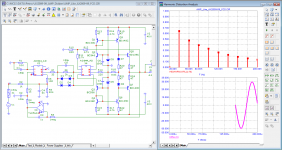
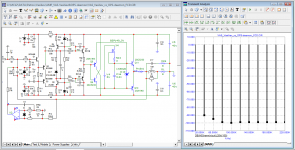
Now let's turn to a simple development of Russian radio amateurs. The voltage amplifier was proposed by Maxim Vasiliev, and the output stage was developed by Dmitry Kireev.
The features of the output stage include the fact that it is capable of working from peak to peak (Rail-to-Rail), the bias circuit for maintaining the quiescent current (bias) has an isolated power supply with a voltage of 5 V.
The signal propagation delay time is 60 ns, the duration of the linear section is more than 1 MHz, at the end there is a smooth fall. With a smooth decline, the time to reach the steady state does not exceed 2 * tPD. In this case, this time is no more than 100 ... 150 ns, which guarantees negligible speed distortions.
Attachments
-
 AMP_Vesiliev-deemon_500kHz.png23.9 KB · Views: 204
 -
 AMP_Vesiliev-deemon_IMD_19-20kHz.png27.9 KB · Views: 221
 -
 AMP_Vesiliev-deemon_20kHz-spectr_(FCD).png78.3 KB · Views: 245
 -
 AMP_Vesiliev-deemon_20kHz-spectr.png83.8 KB · Views: 240
 -
 AMP_Vesiliev-deemon_Bode.png24.5 KB · Views: 291
 -
 AMP_Vesiliev-deemon_SCH.png32.3 KB · Views: 290
The differences between these graphs are fully explained by bandwidth differences. The wideband one will amplify the wide band spectrum beyond the audio bandwidth better than the narrow band one, which will amplify the high frequency spectrum components less.
This has nothing to do with whatever name distortion you dream up, it is basic bandwidth/filter practice, college freshman year.
Jan
This has nothing to do with whatever name distortion you dream up, it is basic bandwidth/filter practice, college freshman year.
Jan
Attachments

Why don’t you plot the difference in voltage between the inverting input and the non-inverting input ( simple subtract will work).
Then to a Fourier analysis on the resulting signal while you step Cdom from say suboptimal minimal value all the way through to sub optimally excessive.
That would show facts and figures of what is really going on. So it will not happen ;-)
Jan
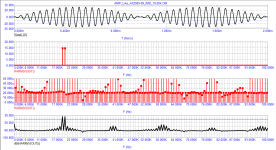
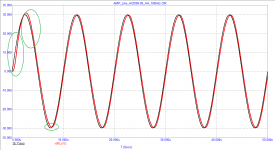
Jan, you still don't understand anything. The problem is not in the gain. Due to the gain, the signal amplitude would decrease. The problem is precisely in the delay in signal transmission. Therefore, in one amplifier, there is also a greater noise level in the sound band when measuring IMI 19-20 kHz. Audio frequencies, standard test. Moreover, in the steady-state mode, the distortions at a frequency of 20 kHz are the same for both amplifiers. And in the first period (which Graham constantly talked about) there is a big difference (100 times!)
Attachments

You'll soon be irritated Jan. It is a supernatural device bestowed by the Gods in the heavens, not a coke bottle.
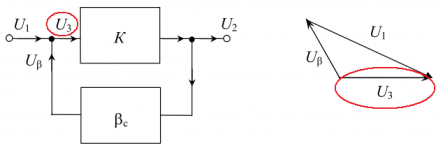
Bonsai, I'm not interested in the error vector U3 at the amplifier input. You can exercise however you like.Why don’t you plot the difference in voltage between the inverting input and the non-inverting input ( simple subtract will work).
Then to a Fourier analysis on the resulting signal while you step Cdom from say suboptimal minimal value all the way through to sub optimally excessive.
Jan, your statement contradicts logic, at 500 kHz the maximum gain
Attachments
And in the first period (which Graham constantly talked about) there is a big difference (100 times!)
So what? Show an example of this in the real world of audio or else it's irrelevant.
Matt, slim chance the great prophet will bother responding to comments from peanut gallery like us.
Jan, you still don't understand anything. The problem is not in the gain. Due to the gain, the signal amplitude would decrease.
No. I mentioned the gain of the high frequency spectrum part of the input signal, not the main signal frequency. I was talking in terms of frequency response, I thought that was clear.
The signal you input has a broad wideband spectrum, but you only look at the carrier frequency. It is the gain versus frequency, the frequency response of the amp, that is responsible for how well it follows your infinitely fast starting signal.
Wide bandwidth -> the gain for the higher frequency spectrum components of your input signal remains flat to higher frequencies than with the lower bandwidth, where the gain rolls off earlier. That fully explains the difference in the two graphs.
Jan
That would show facts and figures of what is really going on. So it will not happen ;-)
Jan
😀
Bonsai, I'm not interested in the error vector U3 at the amplifier input. You can exercise however you like.
Jan, your statement contradicts logic, at 500 kHz the maximum gain
Right on cue.
Jean, I do not understand what a wide spectrum at the amplifier input you are talking about.
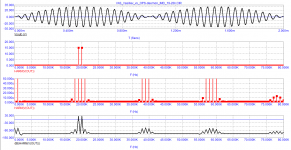
At the output of the generator there is one "stick" with a frequency of 20 kHz, harmonics minus 240 dB. Really much lower, for measurement it is necessary to reduce the rendering step.
The measurement conditions for both amplifiers are the same. One at the output has a distortion level of minus 45 dB, and the other has minus 90 ... 100 dB.
Attachments
Your input signal has a an infinitely fast starting point. That has a (theoretically) infinite wide spectrum.
You don't see that in the spectrum you show. Explain why and you will gain a lot of insight.
The same with Bonzai's suggestion to look at the amp input terminals. That has all the info you need, but of course you didn't realize it and you just ignored it, as predicted.
Jan
You don't see that in the spectrum you show. Explain why and you will gain a lot of insight.
The same with Bonzai's suggestion to look at the amp input terminals. That has all the info you need, but of course you didn't realize it and you just ignored it, as predicted.
Jan
Last edited:
Your input signal has a an infinitely fast starting point.
Years ago we've asked him to put a filter at the amp's input. Unfortunately.
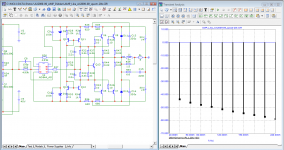
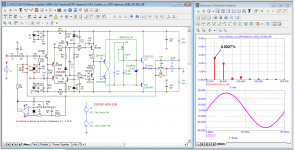
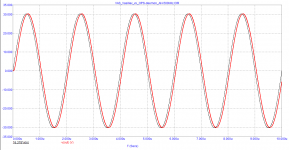
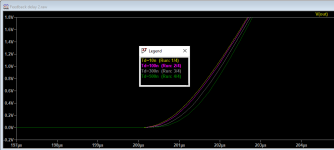
Signal 20kHz sine wave.
Input RC = 1k + 470pF
Startig point + top of sine wave.
Delay time stepped.
Input RC = 1k + 470pF
Startig point + top of sine wave.
Delay time stepped.
Attachments
Last edited:
Explain which filter will help reduce the noise and distortion of this amplifier by 30 ... 40 dB in this test.Years ago we've asked him to put a filter at the amp's input. Unfortunately.
There are two frequencies at the input, clean, without additional harmonics
Why, in steady-state mode, the distortions of two amplifiers on a sinusoidal signal are the same, and the IMD test shows a difference of 30 ... 40 dB
Attachments
Your input signal has a an infinitely fast starting point. That has a (theoretically) infinite wide spectrum.
You don't see that in the spectrum you show. Explain why and you will gain a lot of insight.
The same with Bonzai's suggestion to look at the amp input terminals. That has all the info you need, but of course you didn't realize it and you just ignored it, as predicted.
He is predictable, again and again and........................
- Home
- Amplifiers
- Solid State
- Musings on amp design... a thread split