That's my main problem with ARTA. It's a pain saving each individual impulse. REW can but unfortunately it's only for its own file type.
When I get a chance in the next couple days (maybe today) I'll send you my data.
You could always aks Ivo Mateljan (I have read he gives fantastic support for ARTA). ARTA has already some export functionality for polars (but limited to 1/3 octave resolution currently), so it might be not so difficult. It is a bit of a shame he was asked to leave this thread, as I would really liked him here. He visits mostly the German forums, but my German is only as good as my Chinese...
I should have tested the other speaker to see if it behaves in the same way but my neighbor had just got home and was firing up his grill. His grill is about 10' from my deck so I didn't want to bug him.
I measured the other Pioneer bookshelf this morning in room, and got the same 9khz null. Took the grill off, and it was reduced to a 4dB dip. Should have known.....
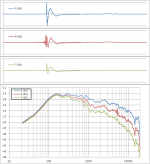
Here's the data for my 2-way waveguide. It's an 18" wide elliptical wg I built, with a 15" woofer in a 3cu ft sealed cab. I hope this is of use since I was having issues locking the time.
Attachments
That's what Holm exported.
I'd attach the Holm .zip that has the data but it's too large.
I'd attach the Holm .zip that has the data but it's too large.
Last edited:
That's my main problem with ARTA. It's a pain saving each individual impulse. REW can but unfortunately it's only for its own file type.
I guess that doesn't leave many options to Holm.
It is a bit of a shame he was asked to leave this thread, ...
It's a shame that he couldn't have been more polite.
I measured the other Pioneer bookshelf this morning in room, and got the same 9khz null. Took the grill off, and it was reduced to a 4dB dip. Should have known.....
Here's the data for my 2-way waveguide. It's an 18" wide elliptical wg I built, with a 15" woofer in a 3cu ft sealed cab. I hope this is of use since I was having issues locking the time.
Hi Nate
Thanks for the data. Before I post it I want to make sure that there is not something wrong. The impulse response at 40 degrees looks faulty. It is far far different from 30 degree and 50 degrees. You can look at it yourself or send me the full Holm file. Basically I don't trust this data set. It just doesn't look right and I am sure that you would find the result disappointing.
Lets make sure that nothing is wrong.
actio = reactio
It's a shame, Mr. Geddes can not stop his needling!
See post 145, .....
Wim and others: If you want an public discussion with Ivo, this could be solved easily. Please use the ARTA Thread (http://www.diyaudio.com/forums/multi-way/76977-arta-17.html).
Sorry for disturbing
Regards
Heinrich
It's a shame, Mr. Geddes can not stop his needling!
See post 145, .....
Wim and others: If you want an public discussion with Ivo, this could be solved easily. Please use the ARTA Thread (http://www.diyaudio.com/forums/multi-way/76977-arta-17.html).
Sorry for disturbing
Regards
Heinrich
Last edited:
Hi Nate
Thanks for the data. Before I post it I want to make sure that there is not something wrong. The impulse response at 40 degrees looks faulty. It is far far different from 30 degree and 50 degrees. You can look at it yourself or send me the full Holm file. Basically I don't trust this data set. It just doesn't look right and I am sure that you would find the result disappointing.
Lets make sure that nothing is wrong.
Thanks Earl, I'll check it out later.
It's a shame, Mr. Geddes can not stop his needling!
See post 145, .....
Regards
Heinrich
Hi Heinrich
That was just stating a fact.
I have been very clear that I don't have any allegiance to any particular program, like you obviously do. If ARTA were to export data in the required format, and I would invite him to do that, I would happily use that data as well. It doesn't do that now, only Holm appears to, so there aren't any other options.
According to Toole, the Quad performed very badly in a blind test (unpublished). In a private conversation that we had, he used that as an example for why high directivity is not desirable. I mentioned that maybe the specific directivity control was not very good, but he did not believe that would make a big difference. This is the one area where Floyd and I disagree, but I think that his supporting data is weak.
This is well covered in his book. The story was that the ESL 63 did poorly in mono tests when compared to wider directivity speakers. Higher directivity and a drier sound led listeners to comment unfavorably on it (lack of spaciousness, I believe) When the tests were repeated in stereo the Quads were better ranked but still behind the competitors.
This is one reason why Floyd and his compatriots prefer mono testing (stereo makes every thing sound a little better).
Dr.Geddes,
I apologize if this post is OT.
The idea of employing constant directivity feature is certainly appealing
to me since I have never had anything but flat baffle monopole speakers. The
stereo image does collapse as soon as I make my move to either left or right.
I remember you saying that a dome tweeter in a conical waveguide/horn with
foam plug would be a much more better solution than a dome on a baffle and
that you have already made an experiment like that.
So, would I be correct thinking I could simulate a response of a dome tweeter
in a conical wg/horn using your SPEAK program?
All I have is a 9" hifi bassmid and a 28 mm dome. PA drivers are not an option
right now. Perhaps I could send you measurement data once this is completed,
altough I am not sure if it would be doable to export Clio (Version 4.55) data to
Holm and make it appropriate for sending.
TIA
Lojzek
Yes, this is quite far off topic, so lets not go this way too far.
SPEAK is obsolete and I am not sure that it will even run on a modern PC platform.
A conical waveguide on a dome is going to be an improvement, but it is not a total solution.
It is a shame that there is no standard output format for polar data. Maybe we can establish one. The Holm format is quite flexible and any software could export in that format if they chose to. It is completely open. Exporting in a proprietary format simply makes no sense.
Right, I was familiar with the ESL63 results documented in the Toole book.This is well covered in his book. The story was that the ESL 63 did poorly in mono tests when compared to wider directivity speakers...
Gedlee comments of "unpublished" and "private conversation" led me to believe it might have been concerning the ESL57.
Thanks Earl, I'll check it out later.
Looking at it some more, i.e. in the frequency response, it seems consistent so maybe it is OK. But your setting the impulse response timing by eye is a little disconcerting since I don't know exactly what that will do.
All of my calculations are complex so the phase is carried forward through out the process until the data is actually plotted which is then the magnitude squared so the phase gets lost at that point. But the modes each have a phase and adding them up with different phases can produce different results. I know this because I initially did not do the analysis in complex numbers because the numerical codes were based on real data. A while back I changed everything to complex and found some variations in some data, but mostly off axis. On axis the modes tended to be in phase so the lost phase was not a big issue.
An incorrect impulse timing causes the phases of the various modes to be incorrect, again more so off axis since the impulse delays more and more as one moves off axis. Hence, incorrect impulse timing does cause errors, but to what extent is hard to *****.
The power response is phase blind so it is always correct. Hence if the power response does not seem to track the polar map well then this could indicate a problem with the impulse timing.
Last edited:
Gedlee comments of "unpublished" and "private conversation" led me to believe it might have been concerning the ESL57.
It was unpublished when we had that conversation and I did not remember it from his book.
Looking at it some more, i.e. in the frequency response, it seems consistent so maybe it is OK.
Yeah, the 40deg impulse shape does seem inconsistent with 30deg & 50deg but the resulting frequency response shows only a small 5.5kHz spike.
Concerning REW & ARTA file formats:
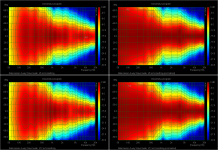
The ARTA manual does a good job of documenting the processes and exact file formats used. For example, it is simple matter to read in the HOLM file format you like and create the binary *.pir files ARTA uses for polar plotting. Attached is the ARTA sonograms for the data natehansen66 posted with 1/6 or 1/12 oct smoothing, with or without normalizing to on-axis response.
As mentioned previously, REW can save groups of impulse measurements in a binary file format. I don't think it would be that difficult to use for your purposes if we can get the definition of the file format. I have sent a request to one of the developers to see if it is something that can be shared.
ARTA does not currently have the ability to save groups of impulse measurements in one file. But, it is simple to combine them into the tabular form you like with a short script or VBA code...that is what I do. Or, is it that you don't like having to save each measurement separately in the first place? This can be automated with a macro, similar to LAUD and PRAXIS. Just enter a file name prefix and away you go...
http://www.artalabs.hr/AppNotes/AP-8 Repetitive measurements with script language AutoIT EngRev1.pdf
While we are griping about measurement software...I wish HOLM had the ability to use a second channel for reference.
In the grand scheme of things, we are blessed with many options not available a decade ago.
Attachments
Bolserst
Thanks for the post.
I have no doubt that there is a work around to using any other software, and I hope that uses will do that. My point is that I am not going to do that.
If we are gripping, I don't like the term "sonogram" used in this context. This term came from the audiology and speech recognition people and refers to color levels plotted on a frequency versus time plane, not angle versus frequency. I suppose there is no "law" that prevents the term from being redefined, but I find it in poor taste to do so. That is why I use "polarmap". It does not redefine any previously used terms.
Holm was written specifically to do one thing. It does that well. Everything else it is poor at. It can't even do a decent job at measuring impedance. As with all things one can get around this.
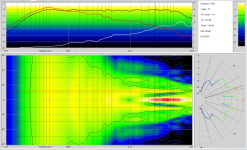
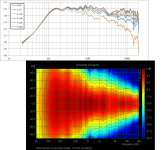
Here is what I get for the Hanson data.
The HF lobbing could be because of the impulse response timing error, I don't know.
I have always found it curious that ARTA never seems to show lobbing, while my analysis always does. Real sources virtually always have lobbing.
The axial response at 18 degrees is quite good, although a flatter DI would be desirable.
I will post this into the database once I get back access to it.
Attachments
Last edited:
Here is what I get for the Hanson data.
The HF lobbing could be because of the impulse response timing error, I don't know.
I have always found it curious that ARTA never seems to show lobbing, while my analysis always does. Real sources virtually always have lobbing.
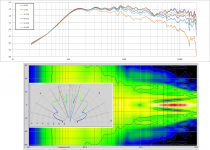
Certainly sometimes course angular increments may hide or smooth over lobing.
I usually acquire polar data with finer increments (0 - 20) for this reason.
In this case, I think there must be an issue with the processing due to the timing error you mentioned.
You are showing a 12dB or larger null at 5kHz in the polar plot right at 10degrees where data was acquired.
I don't see anything in the 0 - 30 degree response curves that would suggest this is real (in the 5khz - 10Khz range).
Also, I don't see the pinch at 3.5Khz in your polar map either.
While the timing issues are being worked out, and if it interests you, I could easily generate polar maps(sonograms) for any of your datasets you currently have HOLM data for that you are confident impulse timing issue are not present. If you can generate polar maps for the same data sets with 1/12 oct smoothing it would be a good "apples-to-apples" comparison of real data that you are comfortable with.
Attachments
- Status
- Not open for further replies.
- Home
- Loudspeakers
- Multi-Way
- Measurement technology