Absolutely, I would expect a near perfect reconstruction, especially from noise free data.
Reconstructing 90 measurements from 14...Very Cool.
Well, actually much more I guess as you have said you can look at response for any distance, not just the measurement distance.
I will put the file together tonight and email to you.
I keep meaning to ask you how important the accuracy of the measurement angles are? For example you say you want data at 0, 5, 10, 15, 20, 30, 40, 50 etc...what if the turntable position was actually 0, 6, 9, 14, 21, 29, 41 etc... but you performed your analysis using the standard angle set values.
In your data set I am assuming that you use a far field model to simulate the data, so the near field stuff won't enter the problem.
The angles get more sensitive as the frequency goes up, but I expect the analysis to be quite robust against this.
Its like fitting a sine wave to noisy data. If you know the frequency then the fit can be quite good even with a very noisy signal. In our case it is exactly analogous to knowing the energy levels of an atom (which are modes) - they are know to a very high level of precision.
Correct. It is a far field model.
Do you need the impulse responses calculated using a sample rate of 44100 as in your example? or is 48000 useable as well. I seem to recall a sample rate miss-match had caused some difficult with previous data I had sent you.
Do you need the impulse responses calculated using a sample rate of 44100 as in your example? or is 48000 useable as well. I seem to recall a sample rate miss-match had caused some difficult with previous data I had sent you.
The same setup can be used to move the speaker. Both ways have their merits. In my case the design is for near wall placement. Have done free field and now undergoing nearwall measurements. Made me smile when seeing your measurement room setup, wouldn't change a thing 🙂
This standard could be part of a continuing refinement for the diy community at large. Would certainly help to lift that vail when these types of subjective comments are made and agree with you 100%
Digital servos are cheap enough, have resolutions of 1-4k steps. Even 1 degree resolutions could be possible across a greater than 180 degree sweep. Analog servos on the other hand can have issue with zeroing them out, or with repeatability to a given resting point and resolution.
Correct. It is a far field model.
Do you need the impulse responses calculated using a sample rate of 44100 as in your example? or is 48000 useable as well. I seem to recall a sample rate miss-match had caused some difficult with previous data I had sent you.
I remember that now. Back then I could not handle 48000, but I am pretty sure that I can now. But it must be placed in the Holm file correctly. I have never actually tried 48000, since I only ever use 44100, but this should not be a big deal since the code reads the sample rate and uses what it read.
I was just looking at that data last night. I plan to post it into my database. The 48000 stuff looked good, but the 44100, looked poor.
Last edited:
This standard could be part of a continuing refinement for the diy community at large. Would certainly help to lift that vail when these types of subjective comments are made and agree with you 100%
This is the goal. Speedy measurements are not really a necessity. Low cost with high resolution is.
Bolserst
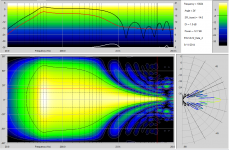
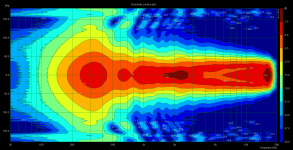
That was a very good test. Thanks for submitting it.
Below is the result. Not bad I'd say. Certainly better than ARTA would do with a 13 degree average spacing (180 / 14).
I am now curious about why the model gives a slightly higher HP Q than I submitted. I had to put in something for the low end - I had not anticipated doing plots that did not have any HP function at all.
Some of the HF resolution here could be due to using only 200 points in the frequency axis. Again, I have not anticipated doing anything with such pronounced HF beaming.
Attachments
Last edited:
Hi friends,
I am author of ARTA software and I have just joined this Forum. I was warned by several ARTA users that Dr. Geddes is constantly pushing some information on algorithms that are used in ARTA in a wrong way. Indeed, after I have read several threads I have found that Dr. Geddes has little knowledge on ARTA internal engines. It is normal as he is not registered ARTA user, but to be correct he should at least read ARTA User Manual.
His main complaint is on how ARTA presents directivity plots, especially polar plot. In short, he writes that ARTA uses higher order interpolation to get better looking curves, he also suspect on ARTA smoothing method as he „uses interpolation and not smoothing“ in his software, he also writes on frequency domain averaging application problem etc.
I must say that in all cases he is wrong.
ARTA is the first software that in its User Manual almost fully describes what kind of interpolation or smoothing or averaging or filtering is used in measurement analysis and presentation. All used methods are approved by known standards or scientifically. Averaging and smoothing are used to reduce measurement variance, interpolation is mainly used as best compromise between discrete domain based algorithms and graphical curve presentation.
In this thread Dr. Geddes says:
„_Wm_ - so would I because ARTA never seem right to me. I suspect it is interpolating the angular data which smears the results. This is well known in pro standards, which is why the minimum spacing in the standard is 2.5 degrees.“
How ARTA plots polar plot. This is one thing that I did not explain in Manual. Is there any interpolation? Yes. First I have to explain that there is always some kind of interpolation, as point based line drawing is nothing else but linear interpolation in Cartesian coordinate system. It means that if we apply “no interpolation“ the line drawing will be erroneously done in polar coordinate system. To circumvent this problem, ARTA first virtually draw lines in Cartesian coordinate system and then make conversion of curve points and plots them in the polar coordinate system. This is why ARTA curves look nice.
At the end of this post I have to say that this post is just a small attempt to break unfair Dr. Geddes self promotion. I also have to say that I do not like how he communicate with forum members. They do not need to share professionals frustration – it is the fact that nobody can make ideal loudspeaker.
I will try to make some measurements in Holm, and send them to you. It could take a couple of weeks until I have a chance to do so, but it really does interest me to see the differences in polars between what you are doing and what is done by ARTA.
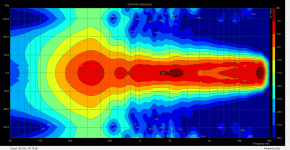
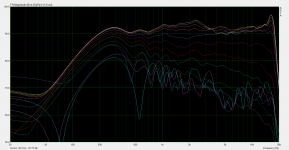
As promised, I made the measurement in ARTA and holmimpulse on my rotary table. Attached is the polar plot from ARTA, and also the frequency overlays. The measurement angles are those defined by Dr. Geddes.
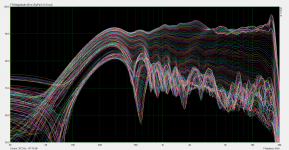
I also made a measurement at every degrees between 0 and 180 to have a really high resolution polar for comparison. The overlay is also attached, but ARTA crashes when I try to generate the polar plot! I still have all individual measurements in PIR, txt and wave format, so if anybody has some tips to produce the correct polar from this, it would be very helpful.
@Dr Geddes, the Holm export is attached in the requested format. I looking forward to see your result.
The speaker measured uses an OS12 waveguide and an AE TD12M basmid. Crossover is a behringer DCX2496 crossed over approximately at 1200 Hz 4th order acoustically.
Attachments
I have uploaded the 180 measurements to the following location:
One.com File Manager
This file (144mB) will be available for the next 10 days for downloading if anyone wants to try and make ARTA generate a polar plot from it. The files includes the PIR, TXT and WAV formats for each measurement angle.
One.com File Manager
This file (144mB) will be available for the next 10 days for downloading if anyone wants to try and make ARTA generate a polar plot from it. The files includes the PIR, TXT and WAV formats for each measurement angle.
Hi _Wim_,
just remove file for 180 degree, and you will get plots.
Later I will fix it (just happens for 1 degree resolution).
just remove file for 180 degree, and you will get plots.
Later I will fix it (just happens for 1 degree resolution).
_Wim_
The first sample is at 100 and should be at -100. You would have missed the impulse at 100. The code did not like this either.
Try -100 to 4800. I find that always works for me.
PS. I think I said that wrong in my writeup! My bad!
The first sample is at 100 and should be at -100. You would have missed the impulse at 100. The code did not like this either.
Try -100 to 4800. I find that always works for me.
PS. I think I said that wrong in my writeup! My bad!
Hi _Wim_,
just remove file for 180 degree, and you will get plots.
Later I will fix it (just happens for 1 degree resolution).
It works indeed. Thanks! Here is the polar response with 179 measurements 🙂. I do not think the measurment at 180 degrees will make a lot of difference ...
Attachments
Hi friends,
I am author of ARTA software and I have just joined this Forum. I was warned by several ARTA users that Dr. Geddes is constantly pushing some information on algorithms that are used in ARTA in a wrong way. Indeed, after I have read several threads I have found that Dr. Geddes has little knowledge on ARTA internal engines. It is normal as he is not registered ARTA user, but to be correct he should at least read ARTA User Manual.
His main complaint is on how ARTA presents directivity plots, especially polar plot. In short, he writes that ARTA uses higher order interpolation to get better looking curves, he also suspect on ARTA smoothing method as he „uses interpolation and not smoothing“ in his software, he also writes on frequency domain averaging application problem etc.
I must say that in all cases he is wrong.
ARTA is the first software that in its User Manual almost fully describes what kind of interpolation or smoothing or averaging or filtering is used in measurement analysis and presentation. All used methods are approved by known standards or scientifically. Averaging and smoothing are used to reduce measurement variance, interpolation is mainly used as best compromise between discrete domain based algorithms and graphical curve presentation.
In this thread Dr. Geddes says:
„_Wm_ - so would I because ARTA never seem right to me. I suspect it is interpolating the angular data which smears the results. This is well known in pro standards, which is why the minimum spacing in the standard is 2.5 degrees.“
How ARTA plots polar plot. This is one thing that I did not explain in Manual. Is there any interpolation? Yes. First I have to explain that there is always some kind of interpolation, as point based line drawing is nothing else but linear interpolation in Cartesian coordinate system. It means that if we apply “no interpolation“ the line drawing will be erroneously done in polar coordinate system. To circumvent this problem, ARTA first virtually draw lines in Cartesian coordinate system and then make conversion of curve points and plots them in the polar coordinate system. This is why ARTA curves look nice.
At the end of this post I have to say that this post is just a small attempt to break unfair Dr. Geddes self promotion. I also have to say that I do not like how he communicate with forum members. They do not need to share professionals frustration – it is the fact that nobody can make ideal loudspeaker.
Hello Imat,
I think my previous measurement (with 179 measurement angles) clearly shows you do a very good job in your software. The difference between the 14 measurement polar is almost nothing (and absolutely nothing more to learn from the data)
I like ARTA a lot (in fact, I do not use anything else anymore), and I would recommended to anyone who is serious about measuring audio. The only small disadvantage is that there is a certain learning curve to go through, but this is off course absolutely normal for a software with so much possibilities.
Very glad you joined, never was a software bug so fast resolved J
Thanks again,
Wim
Hi Wim,
I know for this bug, and also there is one more bug when using gated impulse response for creating directivity plots.
Both bugs will be resolved in ARTA service release which will be published soon.
In the meantime I am testing ARTA in order to find some more bug that came out when I've changed to IDE Visual Studio 2013.
Best,
Ivo
Hello Ivo,
There also something wrong when showing the phase responce when working with the "get delay from marker" button. I try to simulate it again (tomorrow, now it is bedtime), and send you a PM how you can recreate it.
There also something wrong when showing the phase responce when working with the "get delay from marker" button. I try to simulate it again (tomorrow, now it is bedtime), and send you a PM how you can recreate it.
Hi friends,
I am author of ARTA software and I have just joined this Forum. In this thread Dr. Geddes says:
„_Wm_ - so would I because ARTA never seem right to me. I suspect it is interpolating the angular data which smears the results. This is well known in pro standards, which is why the minimum spacing in the standard is 2.5 degrees.“
You are being grossly unfair because my statement was not a claim in any way. It was obviously stated as a guess. If it is wrong then so be it, but it is not my obligation to read a manual for a piece of software that I do not use.
We will see if our two algorithms produce the same results although, again to be fair, we should be comparing results with equivalent numbers of angles, not my results for 14 angles versus your results for 180 angles. That is kind of absurd is it not?
We have already seen how your data is incorrect at 18 angles.
_Wim_
What was the measurement distance?
Could you send me the Holm Zip file? The data doesn't look right and I want to see if it looks the same in Holm.
Also it is some sort of cardioid, correct? This throws off the model at LFs.
Since you only have 4.5 ms of clean data, then even the ARAT results are no good below say 200-300 Hz.
Last edited:
- Status
- Not open for further replies.
- Home
- Loudspeakers
- Multi-Way
- Measurement technology