Is there any interpolation? Yes. First I have to explain that there is always some kind of interpolation,
I use no interpolation in the angular direction. It is not required.
And I am equally annoyed with you coming to a thread that I started and "self promoting" yourself. I am not "selling" what I am offering. I have no commercial interest. If you want to sell your software then I suggest you start your own thread.
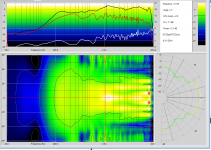
Here is what I get. If you look at the power curve you can see that the data is very noisy compared to what I am used to seeing. If I can look at the actual Holm file then maybe I can figure out if there is a problem.
It doesn't look like anything that I have seen before.
I use a 1.5 meter measurement distance. If this is wrong then this will affect things.
(The LF are not right as I said before.)
It doesn't look like anything that I have seen before.
I use a 1.5 meter measurement distance. If this is wrong then this will affect things.
(The LF are not right as I said before.)
Attachments
Hi Gedlee,
I did not send you any data, and I don t know how you decide what is right and what is bad in quality of directivity plots.
In ARTA I am giving sonograms (which uses linear interpolations) and contour plot that uses high order interpolations (as this approach is better if you have less recorded responses). I have tried several types of interpolation and ended with ones that are used in scientific program like Matlab, IDL and gnuplot. The problem is that even small differences in interpolation results in much more different contour plots. It is a reality, as isobares are highly discriminative.
I do not expect that ours programs will get identical curves especially if you are using, as I understand from your paper, fit to high order spherical sources patterns - an approach which is never been justify in practice.
We came to the point that our programs will generate similar but different curves. And we have to use users on it, and train them to know where differences came from and how we can interpret them.
When you make a stable working program for directivity plot, I will be the first that will put link on it, as I have put link on all relevant measurement software.
Best,
Ivo
_wm_ your data beyond 60 degrees is contaminated somehow. It looks like you did not lock the time base after the first run and after 60 degree Holm locked onto a reflection as the initial impulse.
Bad input -> bad output.
iMat - your rudeness is more than I am willing to overlook. I will not get into a competition with you.
Bad input -> bad output.
iMat - your rudeness is more than I am willing to overlook. I will not get into a competition with you.
Last edited:
Aah, I recall the details now. I acquired the data at 96000. Back then you requested data in the Holm *.zip file. When you read in my data file with Holm it down sampled(poorly in the time domain) to the 44100 you had your sample rate set to. I later regenerated the impulses with IFFT to a sample rate your Holm setup could handle(sound card capability related).I was just looking at that data last night. I plan to post it into my database. The 48000 stuff looked good, but the 44100, looked poor.
Since that data was for a Phoenix Dipole clone, you may want to reprocess the data now that you have capability to turn off the monopole assumption
Actually, concentrating on the 200Hz – 10kHz range the results are pretty impressive.That was a very good test. Thanks for submitting it.
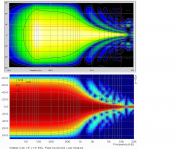
Below is the result. Not bad I'd say. Certainly better than ARTA would do with a 13 degree average spacing (180 / 14).
Attachment #1 – compares with ARTA plot of the exact data set you used.
Attachment #2 – compares with ARTA plot of the 5deg increment data set
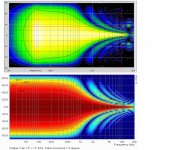
Attachment #3 – compares with ARTA plot of the 3deg increment data set
Attachment #4 – compares with ARTA plot of the 2deg increment data set
Your reconstruction clearly shows the separation and shape of the first two lobes(wings?) nearly as good as the 2 degree increment ARTA plot. However it failed to fill in the 13Khz hole...which was one of the things I was most curious about. I understand this was kind of an extreme data set to test, but that was kind of the point. I appreciate your willingness to post the results even though they weren't a "slam dunk".
Let me know if you would like to experiment with data sets for a different size or shape radiator. I can also include 2nd order HP behavior if desired.
It would be interesting to see if increasing the frequency axis resolution could “fix” the 13kHz hole.Some of the HF resolution here could be due to using only 200 points in the frequency axis. Again, I have not anticipated doing anything with such pronounced HF beaming.
Were the 200 points LOG spaced?
BTW, there are a few designers that actually strive for this type of polar response.
See Roger Sanders M11 polar measurements posted here:
3D3A Lab at Princeton University
You may recall, they acquired measurements for your Nathan as well.
3D3A Lab at Princeton University
Attachments


_Wim_
What was the measurement distance?
Could you send me the Holm Zip file? The data doesn't look right and I want to see if it looks the same in Holm.
Also it is some sort of cardioid, correct? This throws off the model at LFs.
Since you only have 4.5 ms of clean data, then even the ARAT results are no good below say 200-300 Hz.
Measurement distance was approx 1.5m (did not measure is exactly). More the 4.5 ms of reflection free measurement is not possible in our living room (european houses are smaller then usa houser I am afraid). No cardiod speaker, closed box. I agree data is not usable below even below 500 hz.
Holm zip file can be downloaded here (to big for this forum): One.com File Manager
_wm_ your data beyond 60 degrees is contaminated somehow. It looks like you did not lock the time base after the first run and after 60 degree Holm locked onto a reflection as the initial impulse.
Bad input -> bad output.
iMat - your rudeness is more than I am willing to overlook. I will not get into a competition with you.
I did lock the time measurement (as far as I remeber), but I will try to repeat the measurement when I have some time. That de data is noisy probably comes also from the fact that my living room is mainly made of concrete and brick, nothing flexible.
Net time I try for find some damping material to put against the first reflection aera's.
I don't use Holm Impulse so the term "lock the time measurement" does not make a lot of sense to me. Two questions, first is the rotation center under the acoustic center of the speaker (which may well change with frequency)? Second, by "locking the time" I believe you are fixing the window with respect to the the time from the start of the impulse. As you rotate its possible for the initial time to recede out of the time window, at least if the window is cut tightly at the beginning of the time window.
As someone that has used and developed scientific plotting programs for decades I will no longer consider using any software that cannot plot raw data. The ability to visually check measurements for anomalies and outliers is essential. This means plotting the data in the exact spatial location with all measured values included without any overshoots or undershoots. Processed plots obviously have a role when presenting results but I would suggest treating them as something distinct and to an extent less fundamental than the raw data.We came to the point that our programs will generate similar but different curves. And we have to use users on it, and train them to know where differences came from and how we can interpret them.
I don't use Holm Impulse so the term "lock the time measurement" does not make a lot of sense to me. Two questions, first is the rotation center under the acoustic center of the speaker (which may well change with frequency)? Second, by "locking the time" I believe you are fixing the window with respect to the the time from the start of the impulse. As you rotate its possible for the initial time to recede out of the time window, at least if the window is cut tightly at the beginning of the time window.
Rotating around acoustic center is indeed difficult (even impossible due to frequency dependancy) to perform perfectly. In the cae of the tested loudspeaker above(= very big speaker), the loudspeaker stand was to small to rotate around the estimated acoustic center (as an estimate, I take the center between the voice coil of tweeter and the woofer)
To cope with this, I do as you suggested, I set the start of the window a little in front of the impulse at zero degrees (in ARTA). For all the following measurements, I leave the window in the same position. This seams to work ok for me.
.. Since you only have 4.5 ms of clean data, then even the ARAT results are no good below say 200-300 Hz.
How high are the typical ceiling in the USA? Here in Belgium the ceiling is typically at 2.5m height, so when the center of the speaker is at 1.25m, the first reflection (actually the first 2 reflections) for a measurement at 1.5m distance is will come after 4.15ms (or did I miscalculate this?).
Doing the reverse calculation, for a first reflection at 4.5 ms, I probably measuremed only at 1.25m distance.
The only way I can make the reflection free window larger, is to go outside. But with a complete active setup and a non-portable measurment pc, this is a task I like to avoid...
Your reconstruction clearly shows the separation and shape of the first two lobes(wings?) nearly as good as the 2 degree increment ARTA plot. However it failed to fill in the 13Khz hole...which was one of the things I was most curious about. I understand this was kind of an extreme data set to test, but that was kind of the point. I appreciate your willingness to post the results even though they weren't a "slam dunk".
Increasing frequency resolution does not change anything.
The issue at 13 kHz is aliasing from the point spacing. My choice of 0, 5, 10 etc. comes from my desire to get good data up to 10 kHz with the least number of points. Had I wanted to do to 15 kHz I would need to use 0, 3, 6, 12, 18 etc. This can easily be done for someone who wants this extreme resolution at 13 kHz and is willing to take all that much more data. I don't see it as necessary. I get 2 degree resolution up to 10 kHz with 14 points, and that is pretty remarkable.
Last edited:
I don't use Holm Impulse so the term "lock the time measurement" does not make a lot of sense to me. Two questions, first is the rotation center under the acoustic center of the speaker (which may well change with frequency)? Second, by "locking the time" I believe you are fixing the window with respect to the the time from the start of the impulse. As you rotate its possible for the initial time to recede out of the time window, at least if the window is cut tightly at the beginning of the time window.
The rotation should be about the approximate center of the box If you rotate about the speaker baffle that will cause the data to be slightly erroneous.
Locking the time measurements in Holm forces the lag to the excitation to be exactly the same for each run. This puts all the impulses on the same time base. The impulse arrivals should be retarded as the box is rotated because that is what happens in a spherical source as well. But still, there is no way that you could rotate about the boxes center and have the impulse move out of the window.
(as an estimate, I take the center between the voice coil of tweeter and the woofer)
This would be an error with my technique. You should rotate about the center of the enclosure. What is assumed is a source in an enclosure and the origin of the coordinate system is the center of the enclosure. The so-called "acoustic center" does not even enter into my calculations.
But as I say, I need an estimate of the box volume, source radius, speaker f0 and Q. Otherwise the results won't be as accurate.
My ceiling is about 4 meters. This is on the large side, yes, but not all that uncommon.
My point would be that I can get good results even in a room as small as yours - if you take the right data.
Last edited:
How high are the typical ceiling in the USA? Here in Belgium the ceiling is typically at 2.5m height, so when the center of the speaker is at 1.25m, the first reflection (actually the first 2 reflections) for a measurement at 1.5m distance is will come after 4.15ms (or did I miscalculate this?).
Doing the reverse calculation, for a first reflection at 4.5 ms, I probably measuremed only at 1.25m distance.
The only way I can make the reflection free window larger, is to go outside. But with a complete active setup and a non-portable measurment pc, this is a task I like to avoid...
The time to the first reflection is not critical, and 4.5 was just a guess based on what I saw. But I do need a fairly good measurement of the distance to the drivers and I need the box volume. This tells me where the origin is relative to the drivers, and the drivers relative to the mic. These distances aren't critical, but they become a bigger potential for error the closer one measures.
As someone that has used and developed scientific plotting programs for decades I will no longer consider using any software that cannot plot raw data. The ability to visually check measurements for anomalies and outliers is essential. This means plotting the data in the exact spatial location with all measured values included without any overshoots or undershoots. Processed plots obviously have a role when presenting results but I would suggest treating them as something distinct and to an extent less fundamental than the raw data.
I would tend to agree - to a point. In my analysis I can look at the raw data, but an interpolated plot based on this raw data is pointless. It has no detail at all.
In physics it is quite common to fit data to a model and use that model for analysis. In fact that is almost all of physics. Everything is a model - one is always assumed no matter what you are doing.
Using physics to enhance the resolution of raw data is simply a fact of life in engineering.
Since that data was for a Phoenix Dipole clone, you may want to reprocess the data now that you have capability to turn off the monopole assumption
Yes, that was exactly what I was doing.
I still cannot deploy changes to my web, but finally Microsoft has acknowledged a problem with VS2013 and have a case open to fix this. For the last two weeks they were claiming that it was my coding error, until I deployed the exact same code to the website from another computer. Now they agree that there is a bug somewhere.
In the meantime I have taken on the task of rewriting Polarmap since it was very old code. I will release a new version when I get back "up".
Last edited:
Holm zip file can be downloaded here (to big for this forum): One.com File Manager[/url]
I see nothing in that Holm file. It should be megabytes in size.
- Status
- Not open for further replies.
- Home
- Loudspeakers
- Multi-Way
- Measurement technology