Can you down load that? Preferably in some usable form.
I can export the total acq buffer as a .wav file. That what you mean?
Jan
The measurement is not done at -170dBFs, but around -120dB. The displayed values are automatically adjusted for the 60dB gain stage (shifted by -60).
Are you sure you are measuring any harmonics and not missing them all?
It isnt likely the harmonics are below -170. espec not when they can be measured by other commercially available instruments at about -150.
I have been worrying about that too, but never seen any measurement from that oscillator that actually shows harmonics. Viktors measurements also show a -150dB floor with no harmonics. In a sense, I whish I did see them!
I will try to insert a known level of harmonic, see if that comes out.
Jan
I have found it necessary to insert a "harmonic" to validate measurements on these guys. Its hardest on something like the Shibasoku or DiAna since they are looking for a real harmonic.
BTW my measurements were with the oscillator free running and its not that stable. I'll look at patching in a sync input today. However I want to have isolation so that means a transformer. it should be interesting. My last effort was with a KH4400 but I could never get lock without extra harmonics.
I will also get a full response curve on the B&K notch in its two modes. its a sharper notch than I had expected at 70 dB. There is no published circuit diagram of the unit and its a real bear to reverse engineer due to its construction. At least the caps are distortion free being air dielectric.
Transformer is a good idea. In my case it doesn't appear necessary as the sync source and the analyzer are in the same box.
Jan
Jan
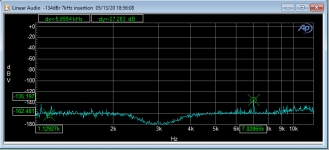
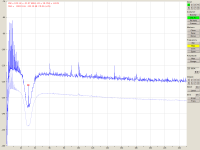
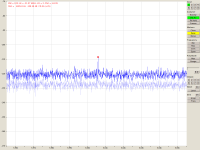
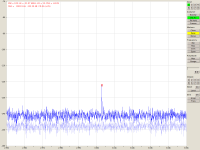
OK, I inserted a 7kHz signal from another oscillator into the 100R output of the Vic oscillator, as follows.
Vrms = 4V, output through the 40dB osc attenuator, then through an external 60dB attenuator, then attenuation from this attenuator (1k) to the osc 100R is another 20dB. Total attenuation 120dB.
Output voltage 4V and AP ref at -2dBV is another 14dB, total -134dBr.
What I see is slightly more, -135.2dBr. There is more noise and junk because now an external unit, mains powered, is connected.
But it seems close enough for government work.
Jan
Attachments
> Transformer is a good idea
Transformer with -160dB distortion ?
Or I misunderstood completely ?
Patrick
Transformer with -160dB distortion ?
Or I misunderstood completely ?
Patrick
The transformer is for isolating the injection lock signal. It should be pretty clean but not that perfect since all it needs to do is bump the main oscillator over. However you can calculate the gain from the transformer output to the main output and see if those are going to be an issue. LTSpice to the rescue- does anyone have a model of the oscillator?
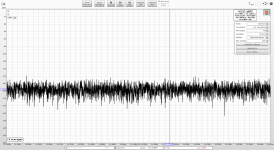
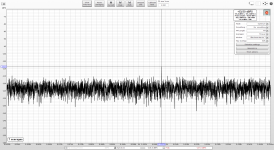
Jan sent me a recording from his AP. 4M samples - exactly:
The fundamental frequency was identified as 3002.9Hz (later on from the spectrum)
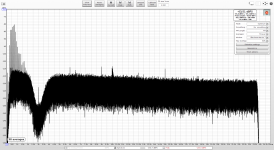
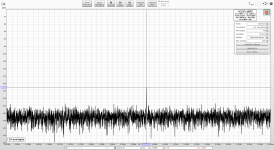
This is spectrogram of the recording
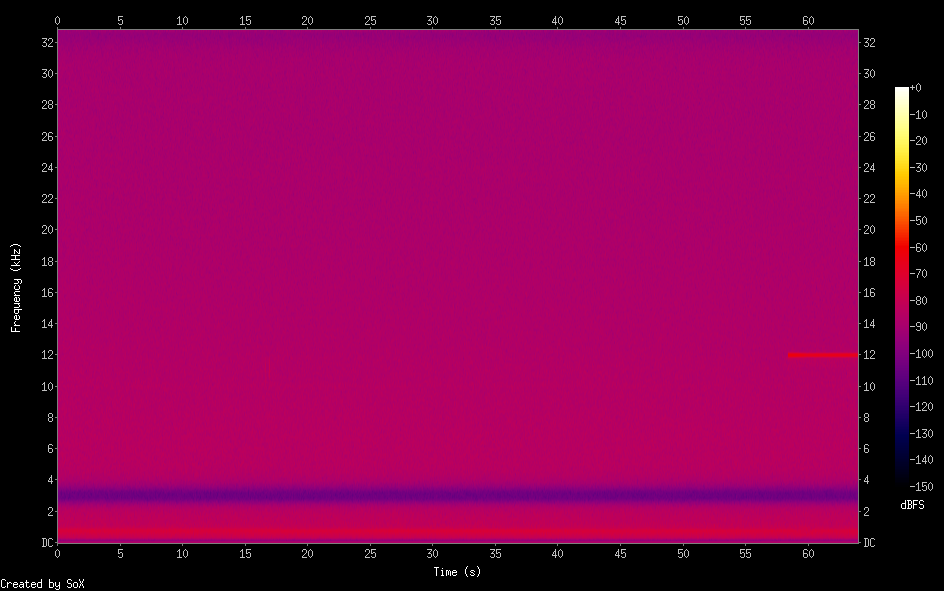
Some 12kHz noise made it to the end of the recording - will have to be removed.
The linux analyzer jaaa supports any samplerate and a simple modification adds 4M, 8M FFT.
John Mulcahy has recently added 2M and 4M options to linux build of his REW https://www.diyaudio.com/forums/equ...t-samplerates-sw-analyzers-2.html#post6175436 . But REW by default does not support 65536Hz samplerate and java uses the plug plugin in linux - the stream would be resampled automatically to 48kHz. I resampled the wav in sox, using the best quality resampler (rate -v -s 48000). The spectrum in the waterfall visually did not change, but the harmonics were not visible in the spectrum anyway.
Now we have only about 55 secs of usable samples, but single 4M FFT takes 83 secs at 48kHz and 8M 128 secs at 65,536Hz. The wavs must be merged exactly at period boundary of analyzed signal, otherwise the signal will contain a discontinuity which ruins FFT.
A simple octave code found that
1966080 samples@65,536Hz samplerate contain exactly 90,087 periods of 3,002.9Hz
480000 samples@48000Hz samplerate contain exactly 30,029 periods of 3,002.9Hz
Thus the two wavs were truncated at multiples of this samples number which fell close to 55 secs to keep maximum of really measured samples
These wavs both contain exact number of periods of the signal and can be repeated any number of times without any signal discontinuity. Looping them to make 50 minutes of continuous signal was trivial with sox and a simple bash loop.
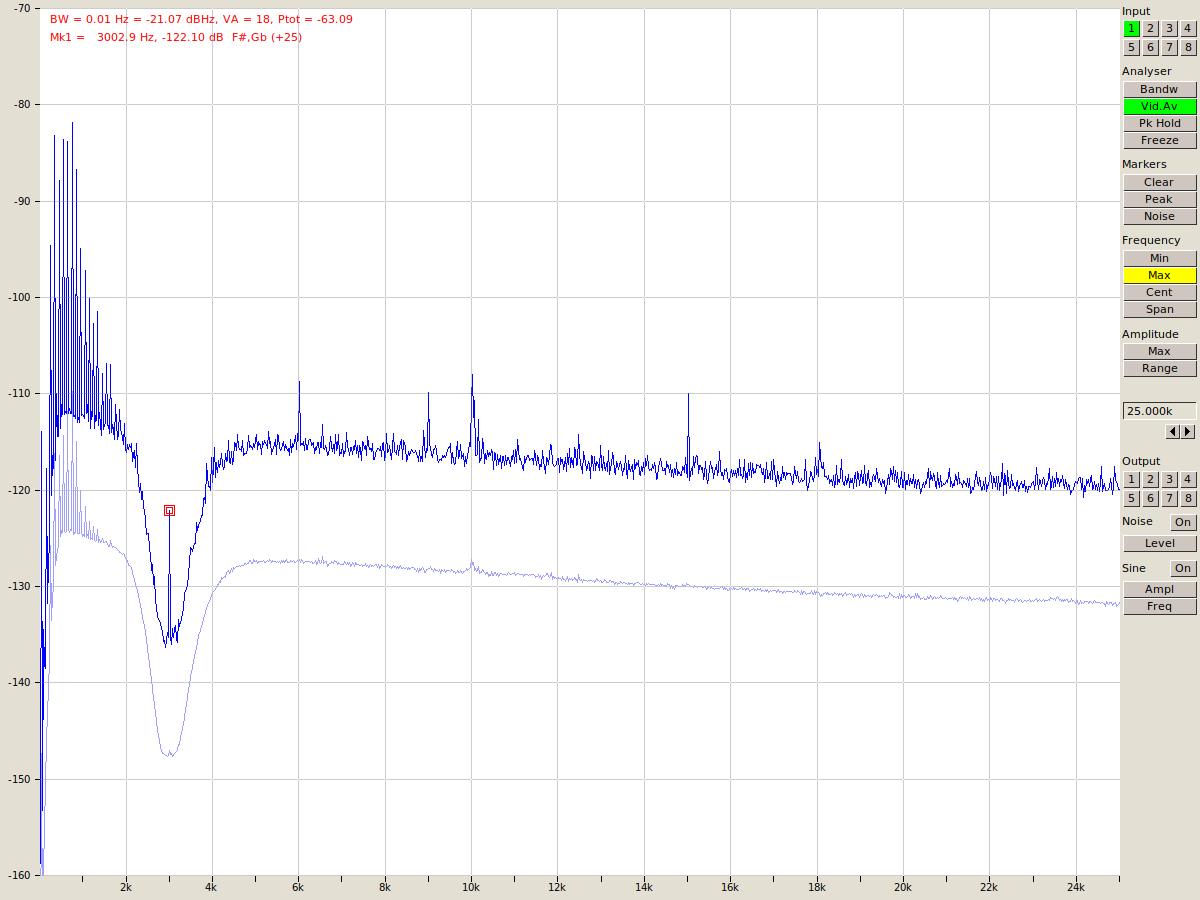
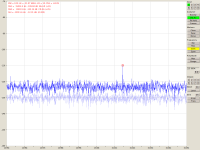
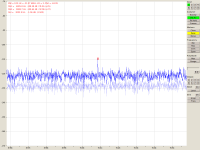
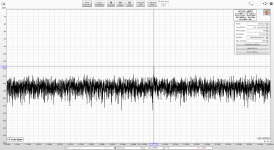
Spectrum in jaaa (65,536Hz, 8M FFT):
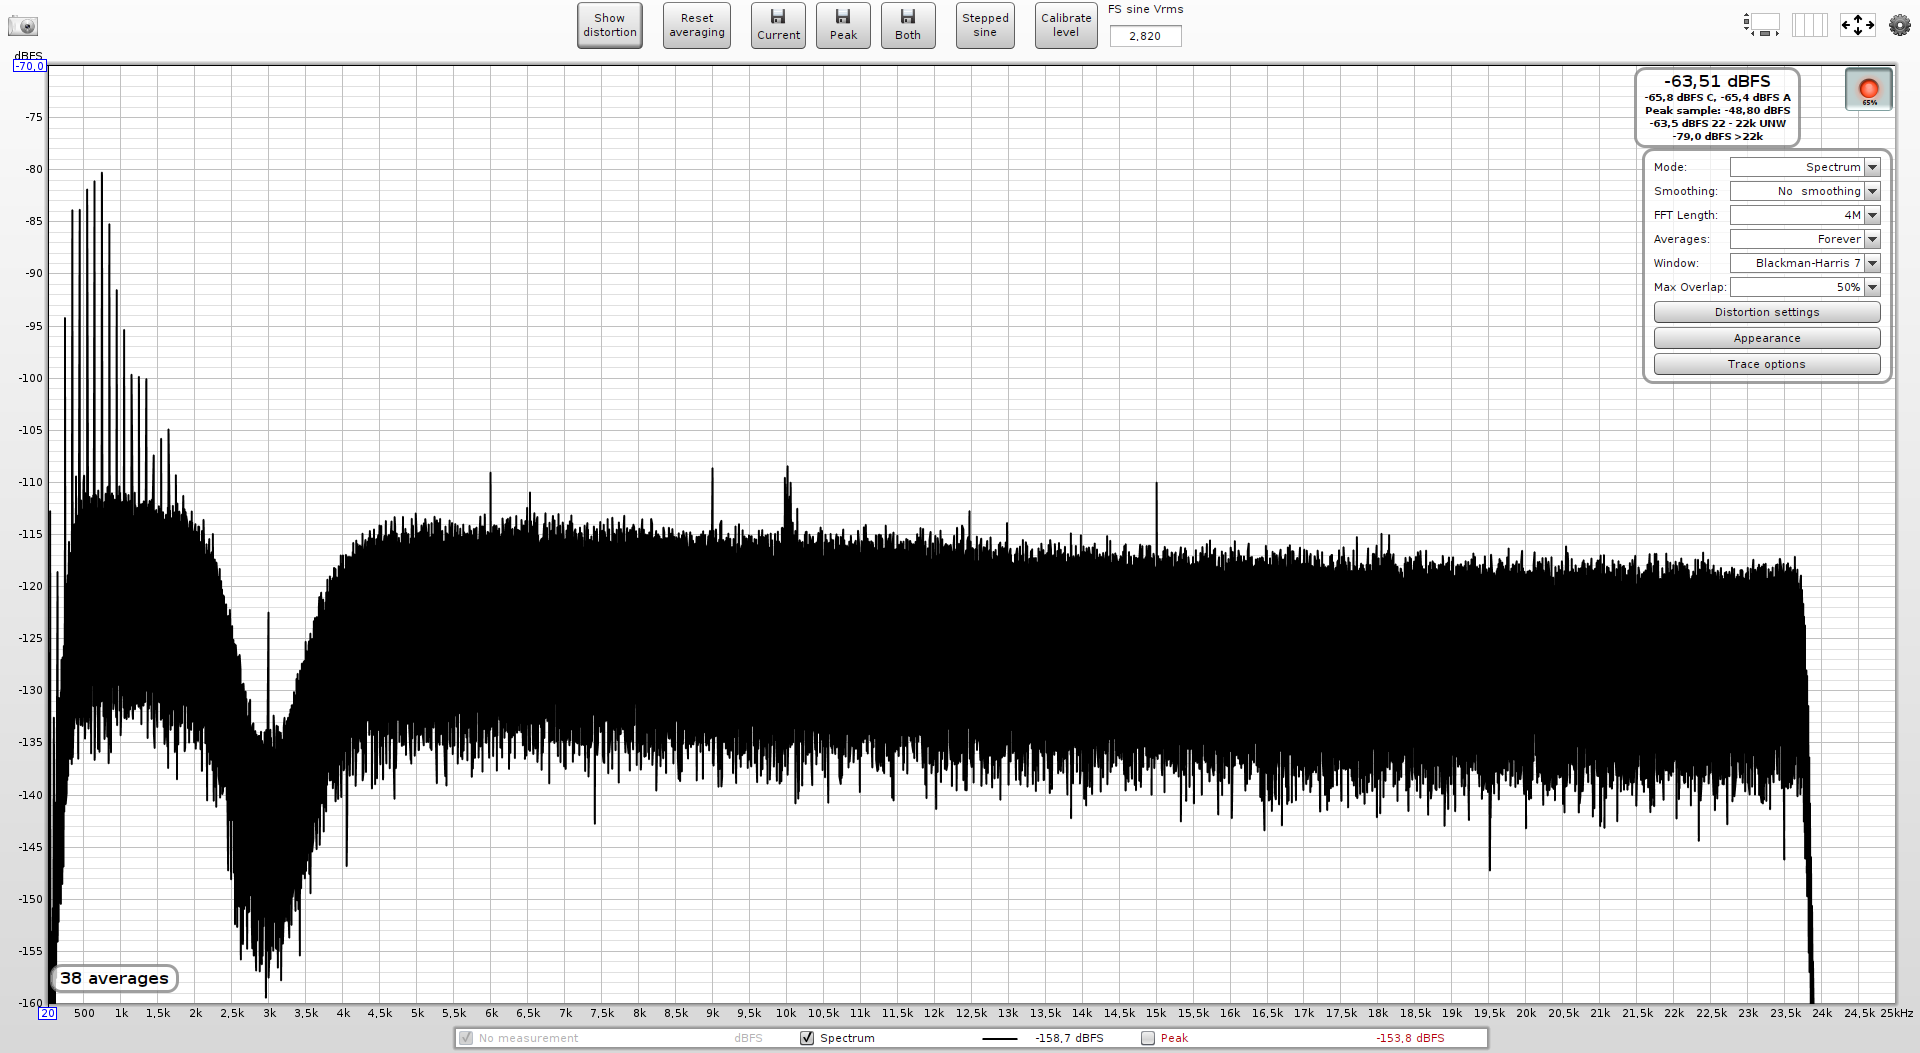
Spectrum in REW (resampled to 48kHz, 4M FFT):
Code:
soxi orig.wav

Input File     : 'orig.wav'
Channels       : 1
Sample Rate    : 65536
Precision      : 24-bit
Duration       : 00:01:04.00 = 4194301 samples ~ 4800 CDDA sectors
File Size      : 12.6M
Bit Rate       : 1.57M
Sample Encoding: 24-bit Signed Integer PCM
The fundamental frequency was identified as 3002.9Hz (later on from the spectrum)
This is spectrogram of the recording
Some 12kHz noise made it to the end of the recording - will have to be removed.
The linux analyzer jaaa supports any samplerate and a simple modification adds 4M, 8M FFT.
John Mulcahy has recently added 2M and 4M options to linux build of his REW https://www.diyaudio.com/forums/equ...t-samplerates-sw-analyzers-2.html#post6175436 . But REW by default does not support 65536Hz samplerate and java uses the plug plugin in linux - the stream would be resampled automatically to 48kHz. I resampled the wav in sox, using the best quality resampler (rate -v -s 48000). The spectrum in the waterfall visually did not change, but the harmonics were not visible in the spectrum anyway.
Now we have only about 55 secs of usable samples, but single 4M FFT takes 83 secs at 48kHz and 8M 128 secs at 65,536Hz. The wavs must be merged exactly at period boundary of analyzed signal, otherwise the signal will contain a discontinuity which ruins FFT.
A simple octave code found that
1966080 samples@65,536Hz samplerate contain exactly 90,087 periods of 3,002.9Hz
480000 samples@48000Hz samplerate contain exactly 30,029 periods of 3,002.9Hz
Thus the two wavs were truncated at multiples of this samples number which fell close to 55 secs to keep maximum of really measured samples
Code:
soxi 65-aligned.wav
Input File     : '65-aligned.wav'
Channels       : 1
Sample Rate    : 65536
Precision      : 24-bit
Duration       : 00:00:57.00 = 3735552 samples ~ 4275 CDDA sectors
File Size      : 11.2M
Bit Rate       : 1.57M
Sample Encoding: 24-bit Signed Integer PCM
Code:
soxi 48-aligned.wav
Input File     : '48-aligned.wav'
Channels       : 1
Sample Rate    : 48000
Precision      : 24-bit
Duration       : 00:00:50.00 = 2400000 samples ~ 3750 CDDA sectors
File Size      : 7.20M
Bit Rate       : 1.15M
Sample Encoding: 24-bit Signed Integer PCM
These wavs both contain exact number of periods of the signal and can be repeated any number of times without any signal discontinuity. Looping them to make 50 minutes of continuous signal was trivial with sox and a simple bash loop.
Spectrum in jaaa (65,536Hz, 8M FFT):
Spectrum in REW (resampled to 48kHz, 4M FFT):
Attachments

Last edited:
Details of each peak - 100Hz range around the peak
Fundamental:
jaaa

REW

H2 jaaa

H2 REW

H3 jaaa

H3 REW

H4 REW

H5 jaaa

H5 REW

H6 REW

Fundamental:
jaaa
REW
H2 jaaa
H2 REW
H3 jaaa
H3 REW
H4 REW
H5 jaaa
H5 REW
H6 REW
So Pavel, what does this tell us? Does this have to be corrected for the twin-tee attenuation?
Edit: BTW I sometimes see that 12kHz (I thought it was closer to 10kHz). It comes and goes, no idea what the source is.
Jan
Edit: BTW I sometimes see that 12kHz (I thought it was closer to 10kHz). It comes and goes, no idea what the source is.
Jan
Last edited:
The charts are spectra from the wav you recorded. Any changes made prior to the recording (notch filters effects on the harmonics, the gain stage) must be accounted for manually. This is what you would see on your AP if it did not subtract the gain stage (just a Y axis shift) and its FFT was long enough.
IMO the spectra clearly show :
1) the harmonics are where expected, the measurement technique has not eliminated them - good
2) The oscillator frequency is very stable and precise (the 8M FFT has resolution of 0.008Hz), at least for the 50/57 seconds of the recording I used (the 36minutes of 18 averages of 8M FFT were built from the single 57 secs sequence).
Now we have only about 55 secs of usable samples, but single 4M FFT takes 83 secs at 48kHz and 8M 128 secs at 65,536Hz.
Really, just curious the standard libs in Matlab, etc. take a couple of seconds.
Details of each peak - 100Hz range around the peak
Fundamental:
jaaa
REW
H2 jaaa
H2 REW
H3 jaaa
H3 REW
H4 REW
H5 jaaa
H5 REW
H6 REW
Pavel for some reason your images don't open (for me at least).
Jan
It's how many secs of samples at the given samplerate must be accumulated to reach the FFT length. The actual FFT calculation takes millisecs with libfftw.
Pavel for some reason your images don't open (for me at least).
Jan
I see them all (including in your quote 🙂 ) on a different machine, they are standard PNGs.
I linked the image attachments directly in the post, hoping the forum would scale them. They are too big for the post text, I will resend them as regular attachments which show just as thumbnails.
Unfortunately I cannot edit anymore, 30 mins have expired...
Sadly, I'm with Jan and cannot see the additional images.
Great work on all parts; I'm actively lurking and appreciating the efforts!
Great work on all parts; I'm actively lurking and appreciating the efforts!
It looks like they go stuck in some temporary cache on the server and then somehow got deleted...
Here they are again.
Here they are again.
Attachments
-
 H5-REW.png151 KB · Views: 110
 -
 H5-jaaa.png47.4 KB · Views: 103
 -
 H4-REW.png154.3 KB · Views: 94
 -
 H3-REW.png154.4 KB · Views: 111
 -
 H3-jaaa.png47.8 KB · Views: 330
 -
 H2-REW.png155.2 KB · Views: 336
 -
 H2-jaaa.png43.1 KB · Views: 348
 -
 fundamental-REW.png154.1 KB · Views: 358
 -
 fundamental-jaaa.png42.8 KB · Views: 352
 -
 H6-REW.png154.4 KB · Views: 107
Demian, that's a good data point. I am currently also trying this on the RTX, running under Virtins MI. So far I am mostly trying to figure out Virtins ;-)
How do you do this with DiAna, just DiAna and the RTX as sound card?
Jan
Virtins is not simple and the Spectrum analyzer UI is not easy to manipulate (or I'll be lod shortly otherwise by someone who read the manual). Using Diana with the RTX is pretty simple and straightforward. DiAna is not installed like an ordinary app so expect some fumbling. I just updated and still fumbling. . .
- Home
- Design & Build
- Equipment & Tools
- Low-distortion Audio-range Oscillator