Bandpass min phase for me.. I guess I like older recordings 🙂
That's crazy interesting too, isn't it? !
The old stuff (prior to say mid 70's) seems to respond better to flat phase tuning.
My pure guess is, that era was recorded in an entirely analog world where low order was the rule. So flat doesn't change it too much.
Stuff from that time period up till maybe 2000ish on is a crap shoot i think... digital higher-order IIR exploration seems to have been going on sometimes??
But fortunately it seems that good ears rule eventually, and imho today's recordings are steadily showing better timing, flatter phase, as well as better tonality.
One thing I hear with flat phase sub timing on anything other than wtf recordings, is that bass almost always seems less, thinner...until you hear it's just cleaner..and turn it up to restore tonal balance....then it all just sounds better, tighter, ...better timing with the rest of the music and more foundation....ymmv 🙂
Hi BYRTT, yes, you correctly anticipate I plan a flat phase tie in to a sub.
And you also raise one of the most interesting questions around imo.....that being, what type phase sounds best down low?...
Ha ha yes now that we can its a interesting question, but try think about it how nature and naturals works that if you change on that you add phase distortion to naturals and it can ruin the reel 2/3d and automatic feel for foot tapping of tight rhytms in same way as summing multible IIR passbands add its phase distortion.
...My current opinion is that it depends on how a recording was made....
I think if made on flat phase sub monitors, we want flat phase tuning.
I think if made on min phase monitors, min phase tuning...
I mean, kinda simple really...other than how the hell was it actually recorded, ie how many min phase orders of crossover were used, or is it an enlightened studio using lin phase??? haha 😕...
Agree optimal we should listen to every recording with same parameters as it was made, but guess or imagine the thing that save us we not need listen with same phase orders of crossover as mastering process is that musicians rhytm in most recordings from beginning is synchronised via single transducer bandpass minimum phase monitoring headphones or because its a one take live band into same room.
...But for me, I hear so much extra bass definition saying 'goodbye group delay' hello flat phase, I don't care anymore. If a song was recorded with excessive group delay, well, can't win em all.....most songs rock flat phase to my ears...
Agree combat excess phase can help read bass definition but overdone think it gets kind of non natural diffuse and the reel feeling of say natural perfect 2/3d is a thin ballancing line that can take alot of hard work to dial in and get right.
...I really believe ditching min phase down low is part of the new magic coming to us all...
Have you seen the new breed of monitors like Meyer's bluehorn? I'm in 😀...
Wow interesting monitors thanks sharing, looks a bit like covered bandwidth is really huge or over avarage and that can explain some of the flat phase there.
...See, like i was saying to ra7...a lin phase zealotlol
Ha ha you good 🙂
Bandpass min phase for me.. I guess I like older recordings 🙂
Agree 😛
Hi ra7, that was the 'tuned in-room' measurement ....
here it is as requested 🙂
Mark, I'm confused. Why doesn't the tuned measurement look as good as your 4-way measurement? Or, was the 4-way an outdoor measurement, and the line array tuned one an indoor measurement? I would try to tune the indoor line array measurement (all sound included, not anechoic or FDW) to the B&K curve as a start.
Mark, I'm confused. Why doesn't the tuned measurement look as good as your 4-way measurement? Or, was the 4-way an outdoor measurement, and the line array tuned one an indoor measurement? I would try to tune the indoor line array measurement (all sound included, not anechoic or FDW) to the B&K curve as a start.
Hi, sorry for any confusion.😱
Not sure which tuned measurement you are asking about vs the 4-way, indoors or out?
And nope I haven't been comparing the line array indoors vs 4-way out.
To make sure i don't create anymore confusion, let me contrast what measurements I've done indoors and out.
A quick aside first ...(Ron, I know you keep working to convince me that I have to think of the line and the room as an inseparable system, and i completely agree with that in the end.
But before I try to jump to that end, I really feel i have to understand the line outdoors. Thank you very much for your patience my friend 🙂 )
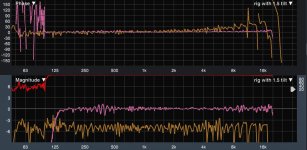
OK, outdoors first. First graph below is the 4-way and the line.
4-way is pink; line is orange. No smoothing mag or phase.
The 4-way is actually just the 3-way main portion w/o sub. All my designs cross at 100Hz to the sub, I will be using the line the same way.
Both speakers' corrections were done with FirDesigner. The 3-way uses 4096 taps per channel, the line 8192 taps.
The first thing I noticed outdoors was that the line does not clean up as easily as the multi-way. Second was the lines high end wildness above about 4kHz.
(This was what prompted all my speculation/line theory questioning about c-to-c spacing earlier in the thread.)
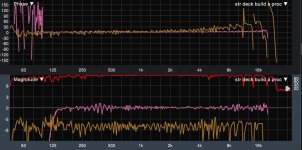
ra7, you were asking about the red coherence trace earlier.....in this first graph the coherence is for the 3-way...notice it's ruler flat 100% above HPF...that's as good as it gets..
The second graph is exactly the same as the first, but now coherence is shown for the line array trace..really good till about 4kHz, then further evidence of interference.
OK Indoors.
3rd trace is the line array with outdoor tuning; vs indoor with indoor tuning.
Outdoor is same as previous two graphs. Orange.
Indoor is the same tuning that was posted in #134. Blue
But this time indoor has no smoothing or FDW. Jagged indeed.
Indoor tuning was to one spot about 10 ft away, about 4 ft off floor.
Normally, when i tune a 4-way to a single spot like that indoors, I get curves that look only a little more ragged than outdoors.
(I don't tune to a spot like that because i know with FIR doing such is bull**** tuning.)
But the fact that the 4-way will clean up near perfectly to a single spot with 4096 taps of FIR, and the line won't come anywhere close with twice that, makes me realize I have a lot more to learn here..........
Anyway, hope all the above clears up any confusion i may have made re measurements and comments about them.
I really enjoyed listening to the line outside last evening. A little low shelving boost, and high shelving cut ...much like the B&K curve..sounded nice.
I like the B&K curve, but have been tuning flat because i put each section of the 4-ways on its own fader for dynamic tone control. The split in octaves per driver section is about 2 :2.5 :3 :2 ...and pretty easily fixes almost any recordings tonal profile.
Attachments
2 short questions if I may,
Why FIRDesigner? I've looked it up, but that doesn't tell me much about it's capabilities. Is it in the same league as Audiolense, Acourate and DRC-FIR?
I'm sure Eclipse will say it is, but I can't see that from it's specs alone. It can combine IIR/FIR and has automation, but how does that work? There are dozens of programs out there, like Dirac, APL_TDA etc. but I wouldn't put them all in the same league as the other 3 I mentioned. APL_TDA would be though. I wouldn't put Dirac into that category, even though it also has IIR and FIR capabilities.
The other question, what's the 3 way we are looking at? If it is what I think it is, it will be quite the stiff competition for the array, maybe even unfair 😀.
I'd like it if the plots weren't combined, this doesn't make it easy to read.
I guess I have a couple more questions:
Do we get to see a plot of the 3 way inside? I think I see two identical looking plots here with the coherence trace being from the 3 way on the first one and the line array on the other? I'm curious to know what tweaks you do to the response of the 3 way when bringing it indoors.* Especially the how.
What did the plot look like with outside tuning on the array, but brought inside? Did I miss that one? Not that I'm real curious about that one though. And you probably can guess why 😉.
Shown to us so far is that the 3 way can be refined to excellence outdoors. More trouble to do the same with the array, even when outside. Not a real surprise there, right? Maybe some tools could do a better job with the array, but it won't be able to match (or better) the 3 way, no way. 😉
The other lesson so far is that if you bring the array indoors, it's output is bound to hit some walls and other stuff. Not a new lesson either. What are you hoping to see here? I'm kinda curious what these plots are ment to show us. What do they show you? I can't tell anything useful from this, unless I were allowed to dig deeper, what do you get out of it?
* = I can't imagine only having the equivalent to 4 big sliders to make up tonality on songs. At least it left me with the impression that you are adjusting the output of the individual drivers (4 separate bands) to shape the overall tonality on a song or album. Could you give us a description of this proces? Something inside of me is screaming: you can do better than that....
I find that if I aim for a house curve (lets call it that), that I can play 'almost' any song without having to adjust the balance between songs. The only requisite for that is that I use volume leveling between the songs. I am using JRiver's volume leveling with the R128 algorithm.
controlling the wildness in the top octave
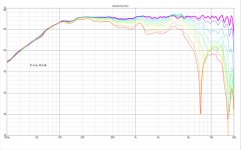
Given the questions about ripple/combing/wildness in the top octave, I searched the literature for an answer and failing to find one turned to Vituix simulation. For the most part, the line source approximation starts to degrade where the spacing equals half a wavelength and is just about completely gone at a spacing of 2 wavelengths. Thus, we are advised not to go there. One source, I forget whom, acknowledged that might not be an option and rationalized that much of the degraded response might be above our hearing thresholds.
But there is some hope and it shows Mark's wisdom in preserving the option for shading. In Vituix, I see two things:
* shading can reduce the magnitude of the combing ripple
* the combing ripple can be equalized away - the corrections hold over a sufficiently wide horizontal angle to be useful.
The attached screenshots are of the Vituix sim of my 32 driver SB65WAC25 array. The weighting isn't optimal; its literally the first I tried to determine if the approach was worth pursuing. The center 8 drivers are full on. Each group of 4 drivers going away from center is 1 db down relative to the previous group. Inspiration can be found in Dave Smith's paper. I wanted to approx raised cosine weighting; the sinx/x was too complicated for my taste. I'll look for more optimal weightings and happily accept help there as some of the math makes my brain hurt.
The Vituix simulation is just a simulation and has yet to be correlated with reality. Its based on my set of 10 measurements over a 90 degree arc of a single driver in a test box with approximately the same baffle width of the array I have in development. Vituix uses this directivity when summing the responses of all the drivers in the array. I've done manual equalization of the array's response so I can look at the directivity un-normalized.
The simulation doesn't include ground/ceiling effects and shows limitations when I try to include them. I trust the differences between two sims - i.e. weighted vs unweighted - a lot more than I trust absolute results.
Attachments
Thanks for the questions 🙂
I use FirDesigner because it was built with the prosound market in mind, particularly live sound. It integrates well with leading measuring systems such as Smaart, Systune, and Kippel on the measurement input side.
And with Lake, Powersoft, and Linea Research among others, on the processor files output side.
I had been using rePhase with good success and wanted something more automated. When i started using FirD about 3 years ago, I knew i didn't care about room correction, and wanted the best, easiest tool to try tons of FIR file experiments.
The program's capability has grown immensely over the last three years, gaining considerable prosound traction. It's author, Michael Smithers is a senior research engineer for Dolby labs.
I can't say how it compares to the other products you mention, but i have a hard time believing it doesn't measure up 🙂, given the top drawer industry partner relationships Eclipse Audio appears to keep acquiring.
I like the DRC-FIR documentation, and the fact you recommend it...if I get moved to try to correct room response too, I think that will be it.
The 3-way I mention is basically the same drivers in a few different box configs.
The bms 4594he coax CD is used in all, on either the HF950 or XT1464 horn from 650Hz up. And the lower mid driver is either a pair of rcf mb12n351, or a single mb12n405.
The boxes are either the Peter Morris design on Soundforums, or my own modular design that has separate cabinets for the CD and 12' drivers.
In no way do I mean to try to compare overall sound quality of these vs the TC9 lines. Totally unfair....hugely different price points.
But I do think it's fair to step back from overall sound quality and compare how to measure and tune a point source vs a line.
Learning how a line works has been my stated goal all along...I only know how to start that learning from the reference I know how to tune.....the point source.
I apologize if my intertwined musings about the two sometimes sound like a contest....
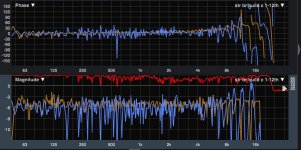
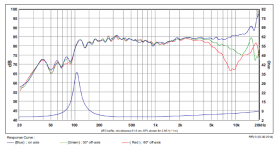
First screeshot below is a 3-way in the same room corner as I've been posting for the line. It has spatially averaged outdoor tuning. 1/12th. Light blue.
Then comes the same indoor line trace shown previously on its own, with 1/12th smoothing to make it more intelligible. It has tuning to a single spot. darker blue.
I wish I had the 3-way completely tuned to the the same specific spot, I will try to produce those for comparison when i can tear up the bedroom again. That might help examine the dramatic difference I see in FIR's ability to tune to a single spot... (which i guess was what i was trying to explore in previous post.)
I'll also try to grap the line inside with outdoor tuning.
I make out two general observation on these traces.
First, the line totally rocks in its low end control...the infinite line theory works!!! Look at the performance and coherence below 250Hz. And the HF combing theory in play, is pretty obvious too.
Second, the point source totally rocks in its high end control, but has no control down low in comparison to the line. The two traces also show how much IR is dominated by HF response....
I do know there is a ton of acoustic room tuning needed to give the line its chance to improve the HF. That and maybe the shading that nc535 just played with.
The 4 sliders all controlled by one master slider ?....
That has been one of my luckiest accidental finds in audio.
When building FIR files for the 3 or 4-ways, I put each driver on a channel with a fader for easy switch between them.
Well, one fine day I'm done tuning and too lazy to undo the separate channel assignments, and just start cranking tunes.
Let me step aside for a second...
A widely used prosound technique is call aux fed subs, which simply means as far as volume control, that the subs have separate fader. I do that even when i build in a house curve. Mandatory system capability for varying source material imo.
But, source material varies so much dang much, sometimes even on top of separate sub control, and house curve 'centering', I often find a little high shelving EQ is is needed.
Ok back to one fine day...Well, in my lazy separate-channel state, I say heck, forget high shelving, just move the HF and VHF sliders.
And then, I'm like, wow, I can adjust midrange too. And wow, listen to how much easier it is to get a tonal balance that sounds right.
You might think this would mess up a multi-way, because we know changing relative levels moves acoustic crossover frequency.
But with my rig, where each driver is flat phase for quite a distance past xover freq, it's who cares if acoustic crossover freq shifts..it's still in phase 😀
Plus I use very high order lin phase xovers 96dB/oct typical, to minimize the frequency range of vertical lobing. This also factors into the 4-sliders working so well.
I love this setup !!!!!
Hope everything made sense.
I use FirDesigner because it was built with the prosound market in mind, particularly live sound. It integrates well with leading measuring systems such as Smaart, Systune, and Kippel on the measurement input side.
And with Lake, Powersoft, and Linea Research among others, on the processor files output side.
I had been using rePhase with good success and wanted something more automated. When i started using FirD about 3 years ago, I knew i didn't care about room correction, and wanted the best, easiest tool to try tons of FIR file experiments.
The program's capability has grown immensely over the last three years, gaining considerable prosound traction. It's author, Michael Smithers is a senior research engineer for Dolby labs.
I can't say how it compares to the other products you mention, but i have a hard time believing it doesn't measure up 🙂, given the top drawer industry partner relationships Eclipse Audio appears to keep acquiring.
I like the DRC-FIR documentation, and the fact you recommend it...if I get moved to try to correct room response too, I think that will be it.
The 3-way I mention is basically the same drivers in a few different box configs.
The bms 4594he coax CD is used in all, on either the HF950 or XT1464 horn from 650Hz up. And the lower mid driver is either a pair of rcf mb12n351, or a single mb12n405.
The boxes are either the Peter Morris design on Soundforums, or my own modular design that has separate cabinets for the CD and 12' drivers.
In no way do I mean to try to compare overall sound quality of these vs the TC9 lines. Totally unfair....hugely different price points.
But I do think it's fair to step back from overall sound quality and compare how to measure and tune a point source vs a line.
Learning how a line works has been my stated goal all along...I only know how to start that learning from the reference I know how to tune.....the point source.
I apologize if my intertwined musings about the two sometimes sound like a contest....
First screeshot below is a 3-way in the same room corner as I've been posting for the line. It has spatially averaged outdoor tuning. 1/12th. Light blue.
Then comes the same indoor line trace shown previously on its own, with 1/12th smoothing to make it more intelligible. It has tuning to a single spot. darker blue.
I wish I had the 3-way completely tuned to the the same specific spot, I will try to produce those for comparison when i can tear up the bedroom again. That might help examine the dramatic difference I see in FIR's ability to tune to a single spot... (which i guess was what i was trying to explore in previous post.)
I'll also try to grap the line inside with outdoor tuning.
I make out two general observation on these traces.
First, the line totally rocks in its low end control...the infinite line theory works!!! Look at the performance and coherence below 250Hz. And the HF combing theory in play, is pretty obvious too.
Second, the point source totally rocks in its high end control, but has no control down low in comparison to the line. The two traces also show how much IR is dominated by HF response....
I do know there is a ton of acoustic room tuning needed to give the line its chance to improve the HF. That and maybe the shading that nc535 just played with.
The 4 sliders all controlled by one master slider ?....
That has been one of my luckiest accidental finds in audio.
When building FIR files for the 3 or 4-ways, I put each driver on a channel with a fader for easy switch between them.
Well, one fine day I'm done tuning and too lazy to undo the separate channel assignments, and just start cranking tunes.
Let me step aside for a second...
A widely used prosound technique is call aux fed subs, which simply means as far as volume control, that the subs have separate fader. I do that even when i build in a house curve. Mandatory system capability for varying source material imo.
But, source material varies so much dang much, sometimes even on top of separate sub control, and house curve 'centering', I often find a little high shelving EQ is is needed.
Ok back to one fine day...Well, in my lazy separate-channel state, I say heck, forget high shelving, just move the HF and VHF sliders.
And then, I'm like, wow, I can adjust midrange too. And wow, listen to how much easier it is to get a tonal balance that sounds right.
You might think this would mess up a multi-way, because we know changing relative levels moves acoustic crossover frequency.
But with my rig, where each driver is flat phase for quite a distance past xover freq, it's who cares if acoustic crossover freq shifts..it's still in phase 😀
Plus I use very high order lin phase xovers 96dB/oct typical, to minimize the frequency range of vertical lobing. This also factors into the 4-sliders working so well.
I love this setup !!!!!
Hope everything made sense.
Attachments
Given the questions about ripple/combing/wildness in the top octave, I searched the literature for an answer and failing to find one turned to Vituix simulation. For the most part, the line source approximation starts to degrade where the spacing equals half a wavelength and is just about completely gone at a spacing of 2 wavelengths. Thus, we are advised not to go there. One source, I forget whom, acknowledged that might not be an option and rationalized that much of the degraded response might be above our hearing thresholds.
But there is some hope and it shows Mark's wisdom in preserving the option for shading. In Vituix, I see two things:
* shading can reduce the magnitude of the combing ripple
* the combing ripple can be equalized away - the corrections hold over a sufficiently wide horizontal angle to be useful.
The attached screenshots are of the Vituix sim of my 32 driver SB65WAC25 array. The weighting isn't optimal; its literally the first I tried to determine if the approach was worth pursuing. The center 8 drivers are full on. Each group of 4 drivers going away from center is 1 db down relative to the previous group. Inspiration can be found in Dave Smith's paper. I wanted to approx raised cosine weighting; the sinx/x was too complicated for my taste. I'll look for more optimal weightings and happily accept help there as some of the math makes my brain hurt.
The Vituix simulation is just a simulation and has yet to be correlated with reality. Its based on my set of 10 measurements over a 90 degree arc of a single driver in a test box with approximately the same baffle width of the array I have in development. Vituix uses this directivity when summing the responses of all the drivers in the array. I've done manual equalization of the array's response so I can look at the directivity un-normalized.
The simulation doesn't include ground/ceiling effects and shows limitations when I try to include them. I trust the differences between two sims - i.e. weighted vs unweighted - a lot more than I trust absolute results.
Awesome nc535, thanks for that.
Between seeing how well the line controls the low end, and knowing acoustic treatment and shading can help the high end, ...well, good stuff 🙂
I need to study your graphs and get back again..
The attached screenshots are of the Vituix sim of my 32 driver SB65WAC25 array. The weighting isn't optimal; its literally the first I tried to determine if the approach was worth pursuing. The center 8 drivers are full on. Each group of 4 drivers going away from center is 1 db down relative to the previous group.
Can you explain the traces in the weighted vs unweighted a bit?
I'm having a harder time following them than i thought...
Oh, and one thing in your post i can't agree with..'mark's wisdom'.....
NONE TO BE FOUND 😀
One more PS, please pardon all the grammatical mistakes in today's long post....girlfriend was waiting on me to help paint downstairs, uhg
Time to go do another coat..
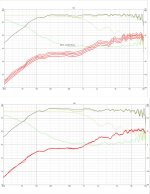
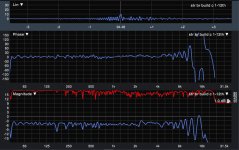
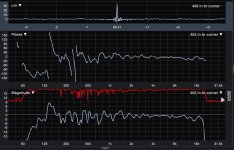
Let's see if this little bit helps:
Red traces are the driver or driver_group voltages
Black traces across top of SPL is "total SPL on axis"
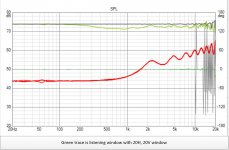
The green that follows below that is a listening window average, 10 degrees H and 10 degrees V, if I recall correctly
The gold trace is an overlay showing the un-EQ spl of the flat source
The other green trace is from "show minimum phase". I could have shown normal phase but it would filled the screen with wrapsl.
The EQ is 12 PEQs. I haven't figured out a way to auto-EQ to flat. I should be able to export to REW, from REW manually back to Vituix. I would love to EQ out those HF ripples and see how it holds over directivity, now that I see same/similar ripples in your SPL (2nd graph in your long post)
Red traces are the driver or driver_group voltages
Black traces across top of SPL is "total SPL on axis"
The green that follows below that is a listening window average, 10 degrees H and 10 degrees V, if I recall correctly
The gold trace is an overlay showing the un-EQ spl of the flat source
The other green trace is from "show minimum phase". I could have shown normal phase but it would filled the screen with wrapsl.
The EQ is 12 PEQs. I haven't figured out a way to auto-EQ to flat. I should be able to export to REW, from REW manually back to Vituix. I would love to EQ out those HF ripples and see how it holds over directivity, now that I see same/similar ripples in your SPL (2nd graph in your long post)
Thanks for the answers, Mark.
I think these exercises begin to show you why I like the lines. Once indoors, the averaging begins to kick in making a lot of in room things go away.
For me, the beauty of this solution was that I did not need much room control at all (that was the point of going with the line array).
Your corners may make it more difficult than it was with my free standing arrays. All I treated was 3 (partial) walls, could have gotten quite far with treating only 2. No need to treat the whole wall, just big enough to cover the reflection as seen from the area of interest. Though I did make it as high as the array. I had to treat the wall behind the listening position. My room is too small to let that be. If more space was available behind the desired listening area and I would have only put up some diffusion panels there as a Haas Kicker.
That simple cure (3 panels) and the very small floor space needed was a definitive plus and primary reason to believe in the project. That's why I went all out on the build.
I can't (and won't) judge FIRdesigner, but for the line in the room it would be advisable to be able to feed it with a good quality frequency dependent window (that excludes REW's version). That is one thing that DRC-FIR, Acourate and Audiolense have in common. They all have their own variant of a frequency dependent window. As DRC-FIR is fully user adjustable, both a blessing and a curse 😀, it was the tool of choice for me.
Basically we're trying to adjust the lines without compensating for the (early) reflections that might occur. Making the compensation work in a much larger area.
Another way would be to take an average of lots of different position measurements to get close to the same results. You want to exclude the anomalies that occur at a single spot. Or get rid of them 😉.
For instance, with my damping panels in place, the first noticeable reflection (actually it is a left over trace from the wall behind the listening position) comes in around 7 ms. At 7 ms I am down to below 800 Hz (frequency dependent window length at 808.8 Hz is 5.94 ms).
So everything above that is almost reflection free. I currently do use an average of 3 measurement points:
- First measurement point for the left channel is the exact sweet spot. *
- Second one is 8.5 cm to the left of that center point.
- Third one is at 17 cm to the left of that center point.
Same deal for the right channel, but moving from sweet spot to the right in 2 steps. That makes it an average around my ear position 🙂. However, I've used 8 positions, covering a much wider area, and the average turned out quite close to the sweet spot measurement. That's why I decided to try centering around the ear for a change. The end result is not shockingly different than my single point results at all. But that's just because the first reflections are down.
DRC-FIR should be able to improve the top you get.
Shading might be another way and I keep forgetting that you guys don't need the bottom end to go low. I would have only used shading on the top end, to keep the bottom end go as low as possible.
I've often thought/dreamed about a synergy like horn in the middle of a line array of woofers. I think you can appreciate the why of that idea 😉.
* = confirmed by playing both speakers and measuring. Moving the microphone to align both peaks.
...The EQ is 12 PEQs. I haven't figured out a way to auto-EQ to flat. I should be able to export to REW, from REW manually back to Vituix. I would love to EQ out those HF ripples and see how it holds over directivity, now that I see same/similar ripples in your SPL (2nd graph in your long post)
Hi Jack maybe easyer said than done but in short export that response with HF ripples and open it in "Calculator" tool under "A responses", now pick "Mirror A" and set "dB" number so that at 1kHZ point response is aproximately lowered to zero dB SPL line, hint there is a "A" button at lower left to re focus graph area. Now push "Calculate & Save" and load that into a new upstream filter of poweramp called "Transfer funchtion file" in schematic window.
You can see example below for my own SB65 on a big cardboard baffle 1/48 smoothing exported from REW, alright in below after EQ response gets flat as a pancake from DC to lightspeed but that can be edited manual directly in frd file so that stopband slopes from original is replaced in the mirror file, or you can take it back into REW where the "Merge B to A" filter in "SPL" tab can merge those two stopbands slopes back over a two run session.
Another intersting thing in VituixCAD is if you load that mirror in a emty session to a driver, you can pick "View"/"Impulse response" and create a IR wav-file that will EQ that driver flat as pancake when loaded directly into JRivers convolution engine. Think this is very neat feature and actual if one has a very neutral speaker or head phone reference set one can use the "SPL trace" tool to trace a transducers datasheet response and then load it same way as above to hear how that driver will sound raw out of box.
Attachments

Last edited:
Given the questions about ripple/combing/wildness in the top octave, I searched the literature for an answer and failing to find one turned to Vituix simulation. For the most part, the line source approximation starts to degrade where the spacing equals half a wavelength and is just about completely gone at a spacing of 2 wavelengths. Thus, we are advised not to go there. One source, I forget whom, acknowledged that might not be an option and rationalized that much of the degraded response might be above our hearing thresholds.
But there is some hope and it shows Mark's wisdom in preserving the option for shading. In Vituix, I see two things:
* shading can reduce the magnitude of the combing ripple
* the combing ripple can be equalized away - the corrections hold over a sufficiently wide horizontal angle to be useful.
Assuming you have uniform spacing in your array, it's easy to see that the inter-element delays (delays between neighboring drivers) at the listening position will be minimal for drivers at ear height, and maximized at the ends of the array. That's just simple geometry. That's why shading helps with the ripple, though it also decreases the directivity of the array.
Although the same EQ might address the ripple across a wide azimuthal angle, what about at elevation angles? You might not have to move far up or down to need a different EQ.
Hi Jack maybe easyer said than done but in short export that response with HF ripples and open it in "Calculator" tool under "A responses", now pick "Mirror A" and set "dB" number so that at 1kHZ point response is aproximately lowered to zero dB SPL line, hint there is a "A" button at lower left to re focus graph area. Now push "Calculate & Save" and load that into a new upstream filter of poweramp called "Transfer funchtion file" in schematic window.
You can see example below for my own SB65 on a big cardboard baffle 1/48 smoothing exported from REW, alright in below after EQ response gets flat as a pancake from DC to lightspeed but that can be edited manual directly in frd file so that stopband slopes from original is replaced in the mirror file, or you can take it back into REW where the "Merge B to A" filter in "SPL" tab can merge those two stopbands slopes back over a two run session.
Another intersting thing in VituixCAD is if you load that mirror in a emty session to a driver, you can pick "View"/"Impulse response" and create a IR wav-file that will EQ that driver flat as pancake when loaded directly into JRivers convolution engine. Think this is very neat feature and actual if one has a very neutral speaker or head phone reference set one can use the "SPL trace" tool to trace a transducers datasheet response and then load it same way as above to hear how that driver will sound raw out of box.
Thanks so much BRYTT. I never would have found that on my own. Got distracted from working through the REW-EQ path by Stanley cup hockey game. Will work on this (and JRiver) tomorrow. Vituix is such an awesome tool!
Thanks so much BRYTT. I never would have found that on my own. Got distracted from working through the REW-EQ path by Stanley cup hockey game. Will work on this (and JRiver) tomorrow. Vituix is such an awesome tool!
Agree its awesome tool, btw should it happen you down the road get phase more or less out of tune doing too much manual corrections of a frd/txt file think one can do two things to get it back on track, again load file into "Calculator"/"A responses" now pick either 1) "Minimum Phase A" where one also can set new stopband tails if needed or 2) pick "Real A" to get a file without any phase info. In the princip REW can also do that mirror file if one divide a response by itself which ouput a flat as pancake response with exactly same start and stop frq points (resolution) and then divide this flat new output named "A over B" with previous response we get a mirror, but problem is tail stopbands if their SPL dynamic range is large gets kind of wavy or zig zag distorted, therefor had a smile see Vituix don't care mirror huge dynamic ranges.
Last edited:
You were right it was easier said than done but not too bad. Tricky part was getting the db number right. Trick is to enter half the distance you want the display to shift.Hi Jack maybe easyer said than done but in short export that response with HF ripples and open it in "Calculator" tool under "A responses", now pick "Mirror A" and set "dB" number so that at 1kHZ point response is aproximately lowered to zero dB SPL line, hint there is a "A" button at lower left to re focus graph area. Now push "Calculate & Save" and load that into a new upstream filter of poweramp called "Transfer funchtion file" in schematic window.
.
Here is result
Attachments
Skepticism is warranted.Assuming you have uniform spacing in your array, it's easy to see that the inter-element delays (delays between neighboring drivers) at the listening position will be minimal for drivers at ear height, and maximized at the ends of the array. That's just simple geometry. That's why shading helps with the ripple, though it also decreases the directivity of the array.
Although the same EQ might address the ripple across a wide azimuthal angle, what about at elevation angles? You might not have to move far up or down to need a different EQ.
Yes, it is easy to see and has already been so observed.
Ra7 posted measurements showing response variation with height.
In vituix, mic location defaults to center of array and I don't know how to change that.
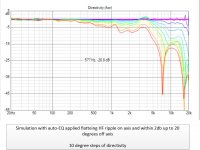
One can compare average across listening window to on axis response which would give some indication. Listening window average is the faint green line in my SPL chart, Previous chart was 20H 10V window. Stretching window to 20H, 20V gives this picture
Attachments
One further word of caution and that is I'm still not including ground or ceiling reflection in the simulation. When I try to do it, I see comb lines forming above 10 Khz but I'm not yet sure I'm simulating the reflection correctly so I don't want to post images. Without the ground plane image one sees vertical lobes in the HF - line array vertical directivity apparently fails to hold so combing should be expected. The question is how much. Probably easier to see by measurement and also to determine audibility.
Its comforting to note that effective absorption at HF can be unobtrusive - e.g. a carpet on the floor, acoustic tiles on the ceiling...
Its comforting to note that effective absorption at HF can be unobtrusive - e.g. a carpet on the floor, acoustic tiles on the ceiling...
You were right it was easier said than done but not too bad. Tricky part was getting the db number right. Trick is to enter half the distance you want the display to shift...
...
 one note for shared graph there is we get exactly same view if one right click and pick "Normalized", but this right click command will not influence all the other graphs plus it can't generate a neat IR wav file to do quick covolution EQ tests.
Looking at curve maybe my analyze and worry is wrong but that hot 3600Hz area is not looking good in relation to our hearing sensitivity in ISO 226 2003 equal loudness curve plus crosstalk interference for a stereo triangle (theoretical HRTF in REW divide a perfect IR with another perfect IR delayed about 0,27mS). Wonder if reason of hot 3600Hz area is because of shading or its design of baffle geometri (diffraction) and can be avoided some way, if we look the three axis in SBA datasheet there is no signs at 3600Hz there.
Attachments
Last edited:
I think the issue around 3600 through 4600 hz is due to merging clos mic with distance measurements when I didn't have a lot of overlap between the two. I should have done another clos mic at the same time I was taking the directional data.
If I replace the merged measurements with the distance measurements alone, without redoing the mirror filter, that region gets smoother while the LF gets bumpy
If I replace the merged measurements with the distance measurements alone, without redoing the mirror filter, that region gets smoother while the LF gets bumpy
- Home
- Loudspeakers
- Full Range
- Line array steering ?