And... nevermind! I swapped in my tube amp and all that smearing went away! So staying put with the design for now.
Thanks all.
Thanks all.
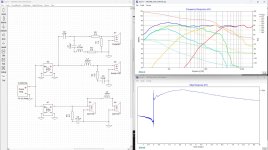
I am building a 2.5way tower using the Satori TW29DN-8 tweeter and two MW16-P midwoofers. Currently using the traced infinite baffle data for the drivers, which I loaded into both BoxSim and VituixCad. I found it easier to add the enclosure and model baffle step in Boxsim.
I just picked up an EMM6 measurement mic, but havent figured it out yet.
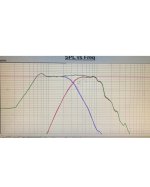
Here is my target for my first go at a crossover based on modeling from the traced data.
Other than that one 10mH inductor part, I have the rest of the components on hand to easily test.
View attachment 1331600
One thing I am a bit concerned about is that plateau between 700hz-1200hz. How would I go about trying to flatten that part?
My suggestion is to customise the low pass on your green curve. I don’t know what order the filter is but you can change the Q of the filter with some juggling of the L+C values pr damp it with a parallel resistor of say 39R on the driver.
Alternatively
I am building a 2.5way tower using the Satori TW29DN-8 tweeter and two MW16-P midwoofers. Currently using the traced infinite baffle data for the drivers, which I loaded into both BoxSim and VituixCad. I found it easier to add the enclosure and model baffle step in Boxsim.
I just picked up an EMM6 measurement mic, but havent figured it out yet.
Here is my target for my first go at a crossover based on modeling from the traced data.
Other than that one 10mH inductor part, I have the rest of the components on hand to easily test.
View attachment 1331600
One thing I am a bit concerned about is that plateau between 700hz-1200hz. How would I go about trying to flatten that part?
I don’t know where you have got to but l would look at that bump as is the driver or the baffle or the cross over?
I would initially measure the driver on a test baffle. Then compare to your loudspeaker baffle to identify the root cause.
One question is do you use objective curves overlaid on your filter response measurements to determine if the driver acoustic response or LR2, BW2 or whatever you are aiming for?
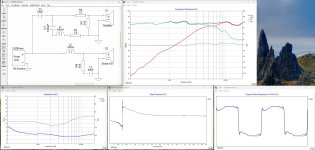
This can be accomplished by taking a voltage drive simulation of a text book passive filter into 8 ohms for the desired frequency and slope and then capturing it in a multiple windows measurement.
Attached is an example in Leap 5. Obtaining a reasonably accurate curve fit and matching the driver levels is crucial. In reverse electrical phase a uniform null should appear at the passive crossover point.
Note that a 2nd order BW filter does not sum flat. The 2nd order LR filter however does sum flat (electrical phase reversed in both cases). Read the Loudspeaker Cookbook for a complete explanation on why this is?
Unfortunately Leap 5 is no longer available so it’s obsolete for diy use which is unfortunately.
I did have a look at this
https://kimmosaunisto.net/
It’s quite a detailed and demanding application to obtain the full featured benefits from for a beginner.
Just looking at the pdf set up for different measurement Apps was very involved. Then the conversion in the simulator.
If your experienced at measurement’s using Arta or Clio and want to deep dive in the refinement of what a simulator can do go for it.
I personally can’t imagine anyone as a first time simulation user taking 14 individual measurements of both a woofer and a tweeter successfully in their listening room in addition to merging a nearfield woofer measurement. They would be completely overwhelmed.
You are far better off following the first two pages of this thread and using your ears and your smarts to figure it out.
Attachments
Last edited:
The 1.5ohm ground is not possible , from page 54 second post and schematicNot sure if I understood correctly and based on what I understood, I drew the crossover for 3 ways as attached. I added L-Pad for both Tweeter and Midrange and added Zobel circuit on Woofer. Not sure if I need to add an inductor and caps on midrange though. Hope I am not totally misunderstood.
starting to build another 3 way with minidsp 2x4HD to filter woofer and mid+tw (use passive XO). need advice any other consideration for my passive xo for Esotar 430 & Satori TW29RN? 1st order with mid zobel and tw LCR.
flat baffle with small bowl for midrange 0.4L sealed
Thanks
flat baffle with small bowl for midrange 0.4L sealed
Thanks
Attachments
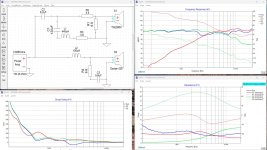
I'll take a moment to talk about phase.
Xsim doesn't show phase for the individual ranges until you enable it. Here's a small tutorial on doing that - https://www.diyaudio.com/community/threads/xsim-configuring-the-plot-window.406106/
As your two drivers sum at +3dB I would say your phase is around 90 degrees apart at the cross which is about right for a first order filter. System phase, which you are already showing is flat, which would be typical for that kind of cross. However this is only for the axis on which you have measured.
The show of square waves tells us the same as looking at the phase plot so there is nothing new there. Besides, the appearance of square waves doesn't correlate to sound.
In general I'd ask whether you feel the cross a 5.5kHz is where you want it to be. It's not a bad choice, although it may put the mid into the breakup region. it can be difficult to see breakup from a single response plot.
Thanks @AllenB for your separate thread, did not notice about this individual phase, i have selected this option for each driver and with 1st order it seems nice graph on simulation. i have modified it make lower XO for mid+tw around 3-3.5kHz
i will measure it this week with UMIK, 1st time doing this
2nd simulation to add dual woofer ported combined with sealed to make 3.5 way targeting around 800Hz xo mid woofer & midrange
however still dont understand reading step response, so many post explaining but i cant get any hint which curve shape i should aim
Attachments

Sorry, I didn'tt answer this part earlier.however still dont understand reading step response, so many post explaining but i cant get any hint which curve shape i should aim
Step response is another way of displaying the same response and phase data which you already have. Since we know what is acceptable and required with response and phase, it shouldn't be necessary to also look at step response. In that regard they are like square waves as I commented on above.
If you want a check that your amount of phase variation is within audible limits, try looking at group delay which is a measure of phase deviation by frequency.
noted @AllenB
another question, my simulation is based on FGraphtracer from datasheet. I can measure driver respon once on baffle with UMIK which for sure will be different.
but for impedance, does it vary impacted by passive parts or box response? i'm planning to buy DATS V3 but does it worthed to spend money? because still many items should be purchased, need to prioritise them
Elsinore is one of the pending items, already have 10 SB17NRX but havent bought tweeter+wg yet
The factory impedance is usually close to correct for crossing so it's a good place to start.
The box resonance does have an effect but it may not happen close to your cross. Sometimes box modes can vary the impedance a little. In any case, you can swap out the impedance file any time you have better data, while leaving everything else in place for your simulation.
The box resonance does have an effect but it may not happen close to your cross. Sometimes box modes can vary the impedance a little. In any case, you can swap out the impedance file any time you have better data, while leaving everything else in place for your simulation.
@gadut Does FGraphtracer produce a phase response curve from the magnitude-only data that is typically in the datasheet? If not, then the results of the crossover network simulation will not be accurate. There is a curve tracing tool in VituixCAD that automatically produces the phase response when a magnitude-only response is digitized.
Activate this and it will be done for you. It works for either response or impedance when you only have zeroed phase.
(Don't use it unless you have to. On a good measured response it will mess up the diffraction and timing elements)

(Don't use it unless you have to. On a good measured response it will mess up the diffraction and timing elements)
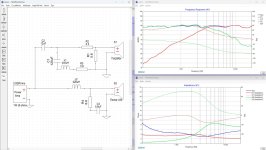
choose "derived" option but there is a drop in 2-8kHz so need to adjust xo components and so far this is best compromise, it looks like a little V shaped eQ. group delay shows above 1kHz up and down crossed among 2 drivers with not too much value differences. highest gap 150ms on 600Hz followed by 35ms on 1.7kHz
Attachments
Your system response trace (blue) has fallen below your individual sources, so it's time to invert the polarity of the tweeter.
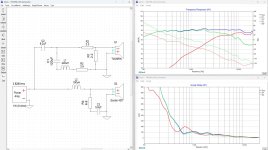
You can switch it back if you like, then you’d have to find another way to bring the phase traces closer together, preferably within 90 degrees
The basic crossover is a little bit misaligned, as the woofer and the tweeter output regions have a very large range of overlap. I don't think that's going to be ideal for the chosen crossover point of around 3.8kHz. Although its "working" from a summed-response perspective, it seems less than ideal, even though it seems like its "the best compromise". It needs a little bit more work to get the most out of these two drivers, which seem to inherently be quite good and show a lot of promise.choose "derived" option but there is a drop in 2–8kHz so need to adjust xo [crossover] components and so far this is best compromise, it looks like a little V shaped eQ.
The "derived " option gets you closer to using the true impedance value, with both magnitude and phase, which is a major improvement in the accuracy of the simulations. Of course, that's all relative to the simulation's assumptions.
If you look closely at the filtered low-frequency and high-frequency responses of the two drivers. you will find that the acoustic high-frequency driver has a roll-off rate that is approximately second order in value. That's because the high-pass filter interacts with the natural response of the high-frequency driver. Below is a quick simulation of what I am seeing:
The acoustic response of the crossover network uses what is called an asymmetric crossover design. Generally, and in this particular case, the summed response is not going to be perfectly flat. In the example above, we have a dip of around 2dB, which seems familiar.
When dealing with "textbook" theoretical crossovers, that is indeed the case. However, in your crossover design, the acoustic response of the crossover network an asymmetric crossover design. The phase response interaction is different than that of simpler complementary crossover topologies. Hence it's entirely feasible to achieve a smooth result by reversing the polarity of one of the drivers.I dont get it why invert makes it smoother? I thought invert is only for 2nd order but i will try this and listen.
Of course, for a true Butterworth 1st-order acoustic crossover design, a polarity reversal would not affect the summed response. But it would turn the response into an all-pass response that does have some phase shift, which would affect the square-wave response.
Below is a simulation of a first-order acoustic Butterworth crossover network with both drivers connected with positive polarity. The dark blue line is the phase response of the summed output, while the light blue line is the group delay of the summed output.
In the next simulation, we have a first-order acoustic Butterworth crossover network with one driver connected with reversed polarity. In this instance both the phase response and group delay are non-zero.
Last edited:
- Home
- Loudspeakers
- Multi-Way
- Introduction to designing crossovers without measurement