Have you ever heard of a High Current / Low Output Impedance / High Damping Factor amplifier ???
@Mister Audio Yeah, that's called a voltage source.
At this point I assume you're just trolling Allen's thread. 'Pretty disappointing.
Ahem.
Dave.
At this point I assume you're just trolling Allen's thread. 'Pretty disappointing.
Ahem.
Dave.
It seems there's a running joke here I wasn't aware of.
Sorry to have intruded on the thread.
Cheers,
Dave.
Sorry to have intruded on the thread.
Cheers,
Dave.
Curt Campbell- Generic XO Wayback
https://web.archive.org/web/20091027024741/http://www.geocities.com/cc00541/speakerbuilder.html
new site
https://www.speakerdesignworks.com/generic-2-way-crossover
https://web.archive.org/web/20091027024741/http://www.geocities.com/cc00541/speakerbuilder.html
new site
https://www.speakerdesignworks.com/generic-2-way-crossover
Last edited:
I am not a troll, I just like the truth ...@Mister Audio Yeah, that's called a voltage source.
At this point I assume you're just trolling Allen's thread. 'Pretty disappointing.
Ahem.
Dave.
6dB does = 4x POWER
A voltage source without current capacity sags in voltage upon load.
The "Synergy Effect" of doubling drivers on an infinite baffle = approx. 1.2dB >
and that is usually 'soaked up' by amplifier sag.
They don't have to work in synergy.. You can place two speakers in opposite corners of the room and if you put the mic between them, you'll see +6dB at that point.
"At that point" is the nature of pressure (SPL). On the other hand, power can encompass the room and if it is accounted for that way, you'll see areas of cancellation. There will be comb filtering as well as room modes.
"At that point" is the nature of pressure (SPL). On the other hand, power can encompass the room and if it is accounted for that way, you'll see areas of cancellation. There will be comb filtering as well as room modes.
EG. >
If you ever use the reactance of L & C to gain output level from of a driver,
you will always find a corresponding dip in impedance response.
Nothing is ever gained from nothing
If you ever use the reactance of L & C to gain output level from of a driver,
you will always find a corresponding dip in impedance response.
Nothing is ever gained from nothing
Mr Audio ..dB is dimensionless and physics is consistent, but I believe your units are not. I think there need to be some additional units here and whether we are talking about a voltage or a power ratio (10 log vs 20 log)
dB of what? dBV? dBP? dBSPL? dBi? dBm?
"Unless I've had a 'brain freeze', 6dB is double the voltage not double the power.?"
Hey that all depends on what your dB ratio is...it would be better to suffix your dB ratio with what you are ratio-ing.
dB of what? dBV? dBP? dBSPL? dBi? dBm?
"Unless I've had a 'brain freeze', 6dB is double the voltage not double the power.?"
Hey that all depends on what your dB ratio is...it would be better to suffix your dB ratio with what you are ratio-ing.
I hesitate to post again....but here goes.I am not a troll, I just like the truth ...
6dB does = 4x POWER
A voltage source without current capacity sags in voltage upon load.
The "Synergy Effect" of doubling drivers on an infinite baffle = approx. 1.2dB >
and that is usually 'soaked up' by amplifier sag.
Your issue is you are conflating acoustic power with electrical power.
The important thing to remember here is....acoustic power varies as the square of the pressure. So you're transitioning from one driver (1^2) to two drivers (2^2).
If they are spaced closer than approximately 1/4 wavelength apart you'll achieve.....10 * log(2^2) = +6db. (And you achieved this with 2X electrical power.)
This might seem like free lunch to you, but it's not. The physics explains this easily.
But, don't believe me or anybody else. Set yourself up a practical demonstration with two drivers next to each other on a baffle. Test one singly and test both (wired in parallel) without changing anything else in your testing scheme. You will note an approximate 6db relative acoustic difference.
Regards voltage sources: If it sags in current capacity under load, then it's not a voltage source.
Good luck.
Dave.
Last edited:
If you have speakers placed far apart then you'll also measure +6dB SPL. For example by measuring from any point on the line in the illustration, compared to turning off one speaker and measuring from the same spot.If they are spaced closer than approximately 1/4 wavelength apart
Of course with that much separation you get directivity effects, such as lobing. Lobing is where sound cancels at some angles, and it can be a good thing if wanted, or a problem if not.

@AllenB Yes, I understand. But variables become much more significant when separating the speakers by greater distances.
I'm trying to stay focused on the simple case where two drivers inhibit the (probably) the same baffle, or are much more close to each other.
Anybody with an MTM speaker would have an appreciation for this characteristic.
I'm also assuming the power amplifier is something close to a voltage source and will handle just fine two paralleled drivers.
I feel like I have to qualify everything I say here. I'm not sure why that is. I guess this is just the landscape of the forum now. 🙂
Dave.
It's a common misconception that something happens to pressure when the drivers are acoustically close, but there is no magic, no synergy. You get +6dB on a pressure measurement regardless.
@AllenB No, you will not always measure +6db.
And you've just illustrated an example. Move your microphone somewhere else other than on that line, and you will not see +6db. Variables, variables, variables.
And who said anything about magic or synergy? I don't think it was me.
This does seem a topic there is still much confusion on. 🙂
Dave.
And you've just illustrated an example. Move your microphone somewhere else other than on that line, and you will not see +6db. Variables, variables, variables.
And who said anything about magic or synergy? I don't think it was me.
This does seem a topic there is still much confusion on. 🙂
Dave.
Last edited:
Exactly my point - early on."Unless I've had a 'brain freeze', 6dB is double the voltage not double the power.?"
And who said anything about
No, it was me.synergy? I don't think it was me.
The 1.2dB of Synergy that comes from a double driver (in close proximity) scenario is created by each one finding it easier to make the pressure wave.
This is something I hope everyone does!But, don't believe me or anybody else. Set yourself up a practical demonstration with two drivers next to each other on a baffle. Test one singly and test both (wired in parallel) without changing anything else in your testing scheme.
as much as i enjoy using dsp and already barely build anything since last year, still some part of my brain want to be utilized for a new thing
i already have umik-1, planning to buy dayton dats-3, so to all of you who master passive crossover, please give me hint on which R L C values i should buy and stock to build passive xo so i can play with various xo point and slope.
no fancy part, i will start with jantzen 5W resistor, bennic/solen caps, local made inductor
prerequisite:
this passive xo only for mid+tw, woofer still use dsp. target mid hpf around 300Hz, 2nd or 4th order
i already have umik-1, planning to buy dayton dats-3, so to all of you who master passive crossover, please give me hint on which R L C values i should buy and stock to build passive xo so i can play with various xo point and slope.
no fancy part, i will start with jantzen 5W resistor, bennic/solen caps, local made inductor
prerequisite:
- mid : dynaudio esotar 410 (4 ohm)
- tw : satori tw29rn (4 ohm)
- tw (someday) : dynaudio esotar 110 (4 ohm)
this passive xo only for mid+tw, woofer still use dsp. target mid hpf around 300Hz, 2nd or 4th order
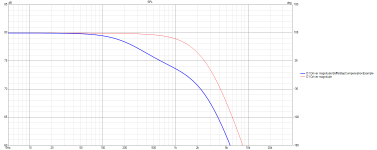
To better illustrate how the Baffle Step Compensation (BSC) circuit works, I've come up with a modification to the above circuit. The aim was to include the baffle step in the actual response of the loudspeaker driver, which is flat from 5Hz to 40kHz in a VituixCAD model. The way I accomplished this was to include a Power Amplifier component ahead of the crossover circuit. This amplifier was itself preceded by a 1st-order Active Shelving High Pass component, with its frequency set to 500Hz and amplitude set to 6dB. Using the component values from the original circuit, the resulting response is shown below. It produces a nice filter shape, with a –3dB point of about 1800Hz.BAFFLE STEP DIFFRACTION
View attachment 224838
..or you can use a BSC circuit. Here it is with the 6.2ohm resistor across the 2mH inductor, which have been added to an existing crossover. The inductor trims more of the high frequencies and the resistor limits how much extra they will be reduced. This creates a shape the opposite of the baffle step shown above.
View attachment 1091244
The VituixCAD circuit model used to produce the above is shown below.
To see what the response of the simulated baffle step is like, simply short-circuit the two inductors and open-circuit the capacitor, as shown below.
The resulting frequency response plot shows the effects of our simulated baffle step.
The filtered response without including the frequency response function of the baffle step looks like the following.
The circuit setup used to obtain the above is shown below.
A comparison of the acoustic filtered responses with (red line) and without (blue line) the baffle step in action, on the same plot, is shown below.
Attachments
Last edited:
- Home
- Loudspeakers
- Multi-Way
- Introduction to designing crossovers without measurement

