It looks to me like the ridges in the decay of the wave guide CSD correlate with the frequency response quite well, that is why I think it is interesting to know what causes the response to be different. Nothing personal.gedlee said:
So you don't think that I am honest?
There are a multitude of things that determine signal to noise, like signal level, background noise, number of averages, and even the type of averaging. I don't have a fixed procedure to lower the noise floor since its never been an issue before. But at -30 dB, as in the CSD plot, it could be an issue.
What you see in the longer times cannot be signal/system based because it basically does not decay at all. It has to be something else.
I think the two previous waterfall plots actually raise more questions than answers. I was expecting a very clean and quickly decaying plot from the waveguide. I don't see that although the intial decay seems to be quick. I hope someone will post CSD for the second waveguide impulse response.
Rob🙂
Rob🙂
Well, if it was related with mounting or baffle, then the Horn would not have it in the same way.ZilchLab said:If it's noise, the JBL "horn" was unable to reproduce it, right? 🙄
Hey, you're in Berkeley? I have relatives there.
🙂
Demo
If AI has a demo room, vendor or installation in NYC, I’d give a listen.
I didn’t see you at AES in October.
If AI has a demo room, vendor or installation in NYC, I’d give a listen.
I didn’t see you at AES in October.
Robh3606 said:I think the two previous waterfall plots actually raise more questions than answers. I was expecting a very clean and quickly decaying plot from the waveguide. I don't see that although the intial decay seems to be quick. I hope someone will post CSD for the second waveguide impulse response.
Rob🙂
Rob, why would you assume the gedlee horn would be clean and quick? I'm guessing the foam plug is taking a 108 db sensitive horn and attenuating it 6 to 9 db then he's eqing it to be flat off axis due to the big problem with reflections it has on axis. It's probably around 94 db sensitive after all that - no wonder he doesn't call it a horn. IMHO it is just another horn with bandaids. It might sound pretty good, but probably not 'better'
audiokinesis said:FlorianO, I can understand your curiosity but I'd rather not post my measurements. I'm a manufacturer, and I'd just as soon not give out data that plays an important role in my commercial design.
My comment itself probably gave out too much, but I didn't want to see Earl's revealing data lose a verbal comparison with data that I have reason to believe is less revealing.
Duke
Smart man! 🙂
gedlee said:
Could someone do the CSD for this one. It should be cleaner. I didn't look at the impulses before so I didn't notice the noise level.
Earl,
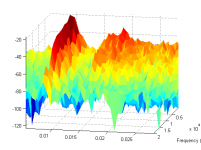
I don't use CSD, but have made some spectograms (MATLAB, Welch's method, 50% overlap, Hamming window, so you know what you're getting)
I hope I can attach some here. If so they'll be dB color scale, zoomed to show the main features in the allowed graphics size.
The initial decay is rapid, but after roughly 6ms there is a strong secondary component (as is quite easily seen in the time series). I'm sure you know what reflection that is at 2m extra path.
The first graph (here's hoping) has NFFT=64 which gives a reasonable balance of time and frequency resolution.
Ken
why did that not work? - it was an 8kB PNG.
Either my browser or you can't preview???
I'll add some more later got to do some real work.

Hello Earl,
May be I am wrong but it seems to me that the new pulse "waveguide" was digitized with a different frequency than the pulse "waveguide_00".
Can you confirm that the sampling frequency of pulse "waveguide" is 48kHz.
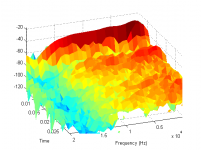
Here is, for what it worth, an output of my own Matlab routine giving the comparison between the group delay curve (expressed in equivalent distance at the speed of sound) and the response for both the JBL and OS.
Best regards from Paris, France
Jean-Michel Le Cléac'h
May be I am wrong but it seems to me that the new pulse "waveguide" was digitized with a different frequency than the pulse "waveguide_00".
Can you confirm that the sampling frequency of pulse "waveguide" is 48kHz.
Here is, for what it worth, an output of my own Matlab routine giving the comparison between the group delay curve (expressed in equivalent distance at the speed of sound) and the response for both the JBL and OS.
Best regards from Paris, France
Jean-Michel Le Cléac'h
gedlee said:It looked to me like the impulse response for the waveguide that I posted before was pretty noisy. In fact the low level stuff at later times is not decaying at all and since there is foam in the waveguide this cannot be coming from the waveguide itself. I've never looked at a CSD for these before and not sure how well my non-anechoic gating of noise will work at very low signal levels. There could be a lot of noise.
Could someone do the CSD for this one. It should be cleaner. I didn't look at the impulses before so I didn't notice the noise level.
Attachments
Hello Kurt,
here is a better spectrogram of the pulse for the OS waveguide.
(unfortunately with a linear frequency scale...)
Best regards from Paris, France
Jean-Michel Le Cléac'h
here is a better spectrogram of the pulse for the OS waveguide.
(unfortunately with a linear frequency scale...)
Best regards from Paris, France
Jean-Michel Le Cléac'h
kstrain said:figure?
Attachments
Jmmlc said:Hello Kurt,
here is a better spectrogram of the pulse for the OS waveguide.
(unfortunately with a linear frequency scale...)
Best regards from Paris, France
Jean-Michel Le Cléac'h
Could you tell us the overlap, window and fft length please?
Ken
Hello Kurt,
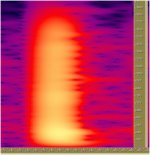
I used the spectrogram possibilities of CoolEditPro (this is now: Adobe Audition) and apply the spectrogram only to the main pulse of Earl's signal.
Settings for that spectrogram were:
windowing fucntion = Blackmann-Harris
resolution = 2048 frequency bands
window width = 5%
logarithmic energy plot
range = 140dB
Please note that the abscisse is given in samples at 48kHz on that graph. So the width is 370 samples at 48kHz and is equivalent to 7.7milliseconds.
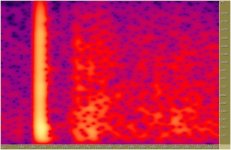
Here is, attached, another spectrogram for a larger part of Earl's signal. The second arrival you noticed is clearly visible after: 0.016s while the main arrival is at 0.009s (difference around 6milliseconds as you said).
We can see on the spectrogram of the main pulse quite the same resonances as on the CSD graph previously given.
Best regards from Paris, France
Jean-Michel Le Cléac'h
I used the spectrogram possibilities of CoolEditPro (this is now: Adobe Audition) and apply the spectrogram only to the main pulse of Earl's signal.
Settings for that spectrogram were:
windowing fucntion = Blackmann-Harris
resolution = 2048 frequency bands
window width = 5%
logarithmic energy plot
range = 140dB
Please note that the abscisse is given in samples at 48kHz on that graph. So the width is 370 samples at 48kHz and is equivalent to 7.7milliseconds.
Here is, attached, another spectrogram for a larger part of Earl's signal. The second arrival you noticed is clearly visible after: 0.016s while the main arrival is at 0.009s (difference around 6milliseconds as you said).
We can see on the spectrogram of the main pulse quite the same resonances as on the CSD graph previously given.
Best regards from Paris, France
Jean-Michel Le Cléac'h
kstrain said:
Could you tell us the overlap, window and fft length please?
Ken
Attachments
Jmmlc said:Hello Earl,
May be I am wrong but it seems to me that the new pulse "waveguide" was digitized with a different frequency than the pulse "waveguide_00".
Can you confirm that the sampling frequency of pulse "waveguide" is 48kHz.
Best regards from Paris, France
Jean-Michel Le Cléac'h
You could be correct since at times I was using 50 kHz and at other time I was using 48 kHz. When I learned that most sound cards resample to 48 kHz no matter what the sample rate is set at I just stuck with 48 kHz.
I'm not sure what you would be looking for in group delay?
Jmmlc said:
Settings for that spectrogram were:
windowing fucntion = Blackmann-Harris
resolution = 2048 frequency bands
window width = 5%
logarithmic energy plot
range = 140dB
Many thanks.
Ken
Jmmlc said:Hello Kurt,
I used the spectrogram possibilities of CoolEditPro (this is now: Adobe Audition) and apply the spectrogram only to the main pulse of Earl's signal.
Settings for that spectrogram were:
windowing fucntion = Blackmann-Harris
resolution = 2048 frequency bands
window width = 5%
logarithmic energy plot
range = 140dB
Please note that the abscisse is given in samples at 48kHz on that graph. So the width is 370 samples at 48kHz and is equivalent to 7.7milliseconds.
Here is, attached, another spectrogram for a larger part of Earl's signal. The second arrival you noticed is clearly visible after: 0.016s while the main arrival is at 0.009s (difference around 6milliseconds as you said).
We can see on the spectrogram of the main pulse quite the same resonances as on the CSD graph previously given.
Best regards from Paris, France
Jean-Michel Le Cléac'h
Jean-Michel
I had never thought of using Cool Edit like this. I can see that it is actually a better plot than CSD. I will have to use this more often.
The long ridges are quite curious but I would caution calling them resonances because they clearly don't decay. They could be caused by the algorithm or many other things. They could be nonlinearities that are aliased in the original data and come out like this. I simply don't know because I have not look at the data like this before. You can see that there are similar ridges before the impulse which again indicates that they are an anomally.
I test at very high SPL because it improves some features of the analysis, but maybe there is a linearity problem.
I do know that if you look at the impulse response you will see that it is very noisy all the way along. I had not worried too much about this low level stuff before because it isn't a problem in the Frequency domain because it is broad band, but it could be a problem in these higher resolution frequency/tiime plots.
Thanks again for this very enlightening new look at classic data. I have long been a big fan of cool edit. I don't like the linear frequency scale however. I think that I'll program up a plot like this in MathCAD so that I can look at the data like this, but using a log frequency scale. I had thought of programing a CSD, but now I see that this is much better.
PS. The ESP systems are 98 dB efficient and the foam loss is only about 1.5 dB at 10 kHz. I've stated this before on numerous occasions.
A few comments:-
the data seem to have some strange resampling (perhaps by the soundcard) shown by an apparent aliasing signature above 20 kHz (but I just ignore that as not very important).
The spectrogram time and frequency axes might be slightly wrong as a result of assuming 48kHz data.
The spectrogram I showed does not have the graphical smoothing - I find that to be a bit misleading sometimes with transient data (at least some care is needed).
Ken
Attachments
Hello Earl,
Group delay is a convenient way for me to see when phase rotation slows down or rises and is an help to analyze pulse response in order to locate problems and do the part of what is due to the driver and what is due to the horn.
(Furthermore, I choose the electrical cutoff of a driver mounted on a horn in order that the group delay will always be negligeible and will not reduce the interest of using one of my low phase distortion crossover method)
For me there is several levels of interpretation of the group delay curve:
1) slow rise in group delay due to reactance of the horn.
With your OS waveguide the rise of group delay under 2kHz can be explained by the fact that under 2kHz reactance dominates in the acoustic impedance of the waveguide. This is probably not harmful but fundamentals or harmonics components of a musical note will be delayed versus the higher harmonics and will seem coming from a 8 centimeters more distant position.
2) rapid variation of group delay (appearing as bumps or dips in the group delay curve) are interpreted as more rapid or slow phase rotation and is most probably due to interferences between direct and reflected waves inside the waveguide. The negative group delay between 4kHz and 5kHz is an example of such interaction between direct and reflected waves. The deep hole at 1,3kHz with the JBL is most probably also due to a reflected wave. (Please notice that the JBL has IMHO much more reflected waves problems than your waveguide).
As we can see both on the JBL CD horn and on the OS waveguide variation of SPl are correlated with variation in group delay and this support the view that most of the artefacts from which a measured response depart from the smoothness of the power response of the driver (as it could be measured on a plane wave tube) may be due to interferences and resonances.
(room doesn't infer here because the analysis by TFD is only down in a raised cosine window the variable period of which is 12 times the period at any frequency. Furthermore, spectrograms show that room interaction begins around 6milliseconds).
Best regards from Paris, France
Jean-Michel Le Cléac'h
gedlee said:
You could be correct since at times I was using 50 kHz and at other time I was using 48 kHz. When I learned that most sound cards resample to 48 kHz no matter what the sample rate is set at I just stuck with 48 kHz.
I'm not sure what you would be looking for in group delay?
Jmmlc said:Hello Earl,
Group delay is a convenient way for me to see when phase rotation slows down or rises and is an help to analyze pulse response in order to locate problems and do the part of what is due to the driver and what is due to the horn.
(Furthermore, I choose the electrical cutoff of a driver mounted on a horn in order that the group delay will always be negligeible and will not reduce the interest of using one of my low phase distortion crossover method)
2) rapid variation of group delay (appearing as bumps or dips in the group delay curve) are interpreted as more rapid or slow phase rotation and is most probably due to interferences between direct and reflected waves inside the waveguide. The negative group delay between 4kHz and 5kHz is an example of such interaction between direct and reflected waves. The deep hole at 1,3kHz with the JBL is most probably also due to a reflected wave. (Please notice that the JBL has IMHO much more reflected waves problems than your waveguide).
But you are doing this on a subsystem and NOT on the completed EQ'd system which will be completely different. I could see "some" merit to group delay of the completed system, but not at the transition points (ie. low end where there is a crossover) in a subsystem.
Doesn't it bother you that all studies of group delay have found it inaudible? Do you just write off this data? I am not in complete agreement with these previuos syudies either as I have found situations where GD types of effects are audible, but I would certainly never conclude that GD per see is a problem just because its there.
There is, by the way, a complex resonance, reflection in the waveguide at 4-5 kHz and this is partially corrected in the crossover. But it appear to be a resonance across the mouth - think membrane mode, which radiates both outward and back dwon the device. This mode is highly affected by the foam. It also accounts for the hole on axis. But it is not a resonance within the waveguide it is a resonace across the mouth aperature. Only a greater radius on the mouth could completely cure this, but the crossover EQ does help. I will post an EQ'd plot if you will run this same data on that.
- Status
- Not open for further replies.
- Home
- Loudspeakers
- Multi-Way
- Horn vs. Waveguide