Can the excess group delay be plotted in ARTA? Is so, I have not seen it. I think it's very useful info.
Right. In the latest version, minimum phase, excess phase and excess group delay are in the view menu. You can also change the delay for phase estimation (time of flight) in the edit menu without going back to the impulse response. It's handy to change it and see what it does to the phase and/or group delay curves.
Jean-Michel,
I like the subtraction idea! I'm going to try it in the wavelet domain and see how it turns out.
One can use reassignment after the subtraction, too 🙂
This will eventually provide an error finger print for a loudspeaker.
- Elias
I like the subtraction idea! I'm going to try it in the wavelet domain and see how it turns out.
One can use reassignment after the subtraction, too 🙂
This will eventually provide an error finger print for a loudspeaker.
- Elias
You'll find in attached files a first image representing the difference between you spectrogram for the first setup (in vicinity of a second enclosure) and the second (alone enclosure).
Then in a second image you'll see the difference between the spectrogram of the foam filled horn and withot (the spectrogram for the"alone" case).
Jean-Michel Le Cléac'h
I concluded months ago in another project that adding the rounded foam like that didn't actually "fix" anything, rather, merely altered the diffraction "signature." Comparing to a rounded over cabinet edge without the "lip" overhangs doesn't get at the answer, either, as that diffracts as well. A better standard at this level would be to flush-mount on an infinite baffle, and from what I'm seeing thus far, that would be a requisite measurement condition if we hope to distinguish among samples....
I have attached some ETC comparisons between this configuration (red) with "back 1" and "back 2"
Hello soongsc,
I think you got a shooting star there 😀
An externally hosted image should be here but it was not working when we last tested it.
An externally hosted image should be here but it was not working when we last tested it.
- Elias
Attachments
Last edited:
Hello catapult,
The group delay as being obtain by derivation from the phase is very sensible to the windowing we apply to the IR.
If a main reflection is visible in the signal window then phase suffers a lot and many peaks and dips will be seen on the group delay curves. Noticeably, if the group delay curve shows large negative values of the GD within some interval of frequency we may think about the origin of that being a main reflection.
To obtain a significative group delay curve with ARTA we must:
1) set the delay for phase estimation (after the yellow cursor) in order that at high frequency the GD tends toward 0
2) set correctly the position of the red marker before the arrival of the main refelection.
In the case the marker is correctly set then amoothing has little effect (it acts only on small delay reflections, HOMs....)
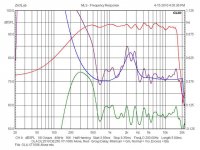
You'll see in attached file 2 group delay curves obtained using ARTA on the IR (OLA_XT1086.wav). BOth receive the same smoothing (1/24th octave)
In green the GD curve obtained without the marker set and in red, with the marker correctly set.
Best regards from Paris, France
Jean-Michel Le Cléac'h
The group delay as being obtain by derivation from the phase is very sensible to the windowing we apply to the IR.
If a main reflection is visible in the signal window then phase suffers a lot and many peaks and dips will be seen on the group delay curves. Noticeably, if the group delay curve shows large negative values of the GD within some interval of frequency we may think about the origin of that being a main reflection.
To obtain a significative group delay curve with ARTA we must:
1) set the delay for phase estimation (after the yellow cursor) in order that at high frequency the GD tends toward 0
2) set correctly the position of the red marker before the arrival of the main refelection.
In the case the marker is correctly set then amoothing has little effect (it acts only on small delay reflections, HOMs....)
You'll see in attached file 2 group delay curves obtained using ARTA on the IR (OLA_XT1086.wav). BOth receive the same smoothing (1/24th octave)
In green the GD curve obtained without the marker set and in red, with the marker correctly set.
Best regards from Paris, France
Jean-Michel Le Cléac'h
Here is the same thing plotted at 1/24 octave smoothing rather than 1/3 octave. The group delay curve is quite noisy but plotting it as excess group delay shows what is going on better IMO, removing group delay caused strictly by the frequency response.

Attachments
Last edited:
Hi,
How to transfer impulse response file from ARTA to OCTAVE
This Octave script read ARTA .txt file, skips the header, and reads the data into Octave matrix.
One plot is generated for your convenience.
### Read ARTA txt file into Octave matrix
filename = 'D:/temppi/ARTA_try.txt'
fid = fopen (filename);
fgetl (fid)
fgetl (fid)
fgetl (fid)
fgetl (fid)
data = zeros (2^18, 2);
i = 1;
while (! feof (fid) )
data (i++, 🙂 = str2num (fgetl (fid));
endwhile
fclose (fid);
data = data(1 : i - 1, 🙂;
figure (1)
plot (data🙂, 1), data🙂, 2));
- Elias
Thanks Elias - seems to work like a charm !
http://www.diyaudio.com/forums/soft...n-wavelet-analysis-available.html#post2159388
🙂
Michael
Dayton horn, Eminence driver, & felt ring test results
This is the Eminence driver with the felt ring and damping on the back of the driver as in the earlier post.
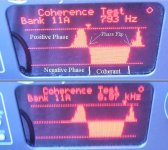
The "Coherence Test" shows bands where the horn system stays in a particular phase. Zero coherence (0) is in the center with positive on top and negative on the bottom. So what is seen is the same graph twice with the ends of the largest bands marked at 793Hz and 8.97kHz which is over a decade. Note: mounting the horn on a baffle still left us with a usable decade (I consider this very good!) but the horn is now usable over a lower frequency and still does not honk. As can easily be seen this is not a minimum phase system and any notion that horns or any other driver is minimum phase has yet to be shown to my satisfaction. I am waiting! Anyway, the bands where the brain can make sense (able to determine time frequency and energy and not just 2 out of 3) of (staying in one phase) is largest in the 793Hz to 8.97kHz band so the crossover will be designed to cross into this usable band. This band is "negative phase" which means all that is required is to exchange the polarity of the wires to end up with positive phase. Frequencies above 8.97kHz only provide phsycoacoustic energy information (2 out of three- no time available) and are not used by the brain to determine harmonic structures. Even though this band has coherence the phase flip (labeled on graph) prevents the ear/brain from using it as harmonic structure and uses the band as energy and frequency band (based on bark intervals)content only. We were hoping for 10kHz on the baffle but it did not happen. (kHz will have to do.🙂
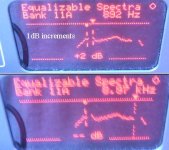
The second graph of "Equalizable Spectra" shows the actual frequency response of the horn system again with the band ends marked. Notice the gaps in the spectra please. These gaps are where coherence falls toward zero and equalization does not work and is therefore not shown. It is completely useless to try and equalize in this region because the output is effectively chaos so, why bother? Sometime we notch these bands out as these bands add nothing but chaos (mud by another name) to the sound. Looks like a low Q parametric will make this horn pretty flat in the useful band.
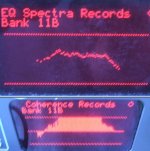
The last image is the graph of the mid that is being used with the horn. I know the frequencies are not marked but the frequencies range is the same so a match between the mid and the horn should be very possible. Nice mid, ehy?
I am pretty happy with this but really wish to try the Selenium D220ti-16 as it looks to possibly be a better driver. This horn will play like 126dB and we do not need that much as the mid only goes to 121dB so the Selenium may be fine.
This is the Eminence driver with the felt ring and damping on the back of the driver as in the earlier post.
The "Coherence Test" shows bands where the horn system stays in a particular phase. Zero coherence (0) is in the center with positive on top and negative on the bottom. So what is seen is the same graph twice with the ends of the largest bands marked at 793Hz and 8.97kHz which is over a decade. Note: mounting the horn on a baffle still left us with a usable decade (I consider this very good!) but the horn is now usable over a lower frequency and still does not honk. As can easily be seen this is not a minimum phase system and any notion that horns or any other driver is minimum phase has yet to be shown to my satisfaction. I am waiting! Anyway, the bands where the brain can make sense (able to determine time frequency and energy and not just 2 out of 3) of (staying in one phase) is largest in the 793Hz to 8.97kHz band so the crossover will be designed to cross into this usable band. This band is "negative phase" which means all that is required is to exchange the polarity of the wires to end up with positive phase. Frequencies above 8.97kHz only provide phsycoacoustic energy information (2 out of three- no time available) and are not used by the brain to determine harmonic structures. Even though this band has coherence the phase flip (labeled on graph) prevents the ear/brain from using it as harmonic structure and uses the band as energy and frequency band (based on bark intervals)content only. We were hoping for 10kHz on the baffle but it did not happen. (kHz will have to do.🙂
The second graph of "Equalizable Spectra" shows the actual frequency response of the horn system again with the band ends marked. Notice the gaps in the spectra please. These gaps are where coherence falls toward zero and equalization does not work and is therefore not shown. It is completely useless to try and equalize in this region because the output is effectively chaos so, why bother? Sometime we notch these bands out as these bands add nothing but chaos (mud by another name) to the sound. Looks like a low Q parametric will make this horn pretty flat in the useful band.
The last image is the graph of the mid that is being used with the horn. I know the frequencies are not marked but the frequencies range is the same so a match between the mid and the horn should be very possible. Nice mid, ehy?
I am pretty happy with this but really wish to try the Selenium D220ti-16 as it looks to possibly be a better driver. This horn will play like 126dB and we do not need that much as the mid only goes to 121dB so the Selenium may be fine.
Attachments
Thanks Elias - seems to work like a charm !
http://www.diyaudio.com/forums/soft...n-wavelet-analysis-available.html#post2159388
🙂
Michael
Thanks to both of you, I can now do my own pretty wavelets!! 😀
This is the Eminence driver with the felt ring and damping on the back of the driver as in the earlier post.
What does it look like without the modifications??
Rob🙂
What does it look like without the modifications??
Rob🙂
Okay, if I get the chance will post "stock" test in this cabinet.
It really honks without the mods though and am not hearing or seeing honk with the mods. The mod does cause a change in polarity of output. Energy went higher but the phase kept flipping over making a mess up in the higher frequencies.
I believe the honk in this horn is mostly attributable to the bad match between the screw on driver and the horn throat. There is even a gap between the end the the threaded driver and the throat. Also the throat changes from serious metallic material of the driver to soft plastic of the horn. Metal to plastic is clearly a mismatch, the gap is a mismatch, the flare rate of the driver to the throat of the horn is a mismatch, and it is mismatch named as one of the reasons horns honk. The felt ring changed the delay time and IMO causes the wave to be re-emitted as a source at the felt ring into a horn without any of those changes mentioned above. Believe this stops the honk and gives the one usable band.
I remember at Altec in Anehiem for the large drivers to multi-cell horn adapters there was a tool that machined the bolt on (not screw on) compression driver to the horn adapter so it fit perfectly and had a continuous curve of similar material all along the throat. I ask about that and the engineer there just said it had to be that way and I needed to talk to "Roy." Roy was out the times I was there. These were factory assembled large horns with drivers.
sumaudioguy, did you explain what the damping mod on the back of the horn is?
btw, thank you for the extra work and measurements!!
btw, thank you for the extra work and measurements!!
Last edited:
I had the same gap in screw on Selenium horns and drivers. I filled it with rope caulk (window putty). Also smoothed the whole transition. Not sure it made any difference.
Might have to test it again.
Might have to test it again.
sumaudioguy, did you explain what the damping mod on the back of the horn is?
btw, thank you for the extra work and measurements!!
That damping on the back is EAR SD063 self adhesive. Energy Absorbing Research =EAR
You are welcome for the testing. Apologies for it taking so long as there are many other things going on than testing. Will get to it though.
Hi,
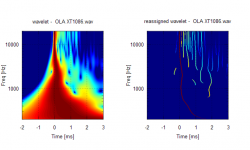
Here's some analysis of the 18sound XT1086 in ZilchLab's product.
Wavelet is calculated at 200Hz-20kHz showing the nice measurement environment with all those reflections 😀
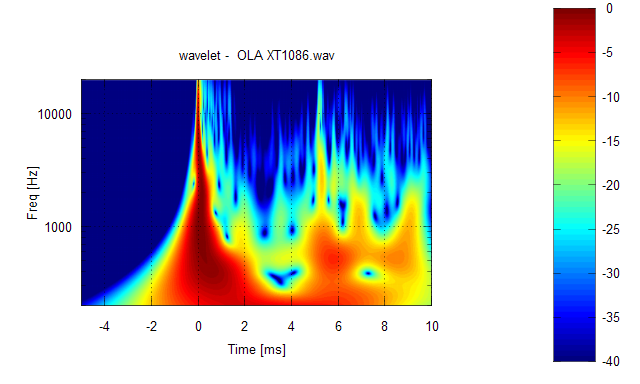
The reassigned wavelet points the 1-2ms reflections/diffractions that seem to be so typical to the horns/waveguides in this thread 🙂 I'm yet to see a horn OR a waveguide + driver combination without this pre 2ms garbage!! DOES ONE EXIST?? 😕
From the reassignment one can have the most natural group delay by looking the dark red curve. This is the delay that the energy undergoes when travelling through the system.

- Elias
Here's some analysis of the 18sound XT1086 in ZilchLab's product.
Wavelet is calculated at 200Hz-20kHz showing the nice measurement environment with all those reflections 😀
The reassigned wavelet points the 1-2ms reflections/diffractions that seem to be so typical to the horns/waveguides in this thread 🙂 I'm yet to see a horn OR a waveguide + driver combination without this pre 2ms garbage!! DOES ONE EXIST?? 😕
From the reassignment one can have the most natural group delay by looking the dark red curve. This is the delay that the energy undergoes when travelling through the system.
- Elias
Attachments

Last edited:
Yes, the HF polarity is inverted to compensate in part for the offset acoustic centers of the drivers. I'd say that is responsible for the "jog" except that it is occurring well above the 1.5 kHz acoustic crossover frequency.
Measuring the horn and filter independently might answer this question; maybe I do that. We know that some of the reflections are the cabinet edges.
[Do you see my beer bottle there...? 😛 ]
Measuring the horn and filter independently might answer this question; maybe I do that. We know that some of the reflections are the cabinet edges.
[Do you see my beer bottle there...? 😛 ]
Last edited:
- Status
- Not open for further replies.
- Home
- Loudspeakers
- Multi-Way
- Horn Honk $$ WANTED $$