Hello Soongsc,
IMHO the ideal pulse shows perfectly on the 2 graphs how the Q of the wavelets pulse evolve with frequency.
If you brose through the discussions on wavelets you may nevertheless find few examples of the same Impulse Response having been analyzed with a "continuous wavelets method" or with a "Bark wavelets method".
From memory you can see "Bark wavelets graph" ; "continuous wavelets graph" and even "multiresolution wavelets" graph for the "Ideal Reflections" test pulse
Best regards rfom Paris, France
Jean-Michel Le Cléac'h
Wouldn't it be better to compare non ideal data?
Hi,
The Bark critical bandwidth matches constant Q log-log linear bandwidth only around 2kHz. Below and above 2kHz Bark has relatively wider bandwidth than constant Q.
- Elias
The Bark critical bandwidth matches constant Q log-log linear bandwidth only around 2kHz. Below and above 2kHz Bark has relatively wider bandwidth than constant Q.
- Elias
Let's consider Elias wavelets tranform graphs of an ideal pulse (Dirac):
1) based on a Bark window
http://i952.photobucket.com/albums/ae6/_E_P_/diyaudio/Ideal_impulse_50-20kHz_Barkwavelet.png
2) based on a constant Q window
http://i952.photobucket.com/albums/ae6/_E_P_/diyaudio/Ideal_impulse_50-20kHz_constantQwavelet3.png
Despite the different horizontal scales, we can see that there is nearly no difference of shape ( between the 2 graphs above 900Hz. (which is the range of frequency that interest us when we use compression drivers and horns (most of...).
For a fractional bandwith around .7 there will be no difference at all.
Best regards from Paris, France,
Jean-Michel Le Cléac'h
Ideal conditions are too simple to see certain differences. I have seen the posts, and still think it's interesting to see these in real application.Hello Soongsc,
IMHO the ideal pulse shows perfectly on the 2 graphs how the Q of the wavelets pulse evolve with frequency.
If you brose through the discussions on wavelets you may nevertheless find few examples of the same Impulse Response having been analyzed with a "continuous wavelets method" or with a "Bark wavelets method".
From memory you can see "Bark wavelets graph" ; "continuous wavelets graph" and even "multiresolution wavelets" graph for the "Ideal Reflections" test pulse
Best regards rfom Paris, France
Jean-Michel Le Cléac'h
Hello,
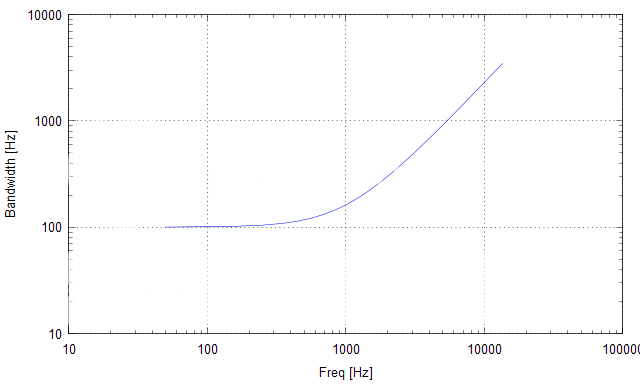
An engineer will say that the constant Q approximation (blue line on the attached graph) above 900Hz of the Bark Q curve as it induces max variation of 50% or so on the Q value between 900Hz and 10000Hz is very good and sufficient for most analysis.
See attached graph.
Best regards from Paris, France
Jean-Michel Le Cléac'h
Attachments
It could be, but I'd rather have hands on problem identification experience to determine whether I agree or not.😉
Hello,
Another engineer would consider what would be the benefit of constant Q over Bark, but he didn't find an answer? 😀
- Elias
Another engineer would consider what would be the benefit of constant Q over Bark, but he didn't find an answer? 😀
- Elias
Hello,
An engineer will say that the constant Q approximation (blue line on the attached graph) above 900Hz of the Bark Q curve as it induces max variation of 50% or so on the Q value between 900Hz and 10000Hz is very good and sufficient for most analysis.
See attached graph.
Best regards from Paris, France
Jean-Michel Le Cléac'h
Hello Elias,
Dont' think that I am opposed to the use of the Bark windowing in wavelets tranforms. It is just that I don't think they are universal and that IMHO they benefit to be used in the analysis of long duration signals as (e.g.) the response of a complete multiways system inside a listening room.
The constant Q wavelets transform operates on a fixed number of periods at every frequency and then shows the spreading of the acoustical energy in the time/frequency field with the same precision whatever is the frequency and with no modification based on psychoacoustics theories. In that sense the constant Q wavelets is a better undistorted illustration of what is the signal.
We can do a parallel with the burst decay graph (but that one has IMHO far less resolution as it distorts the time scale).
Best regards from Paris, France
Jean-Michel Le Cléac'h
Hello Jean-Michel,
I never think anything negative about you, certainly not. Constant Q is very good analysis, I'm using it since long time. But on the other hand I didn't find it ultimate for the end result, because it does not include the human perception.
I think another remarkable feature of Bark wavelet is that it is possible to present the whole audio band (50-20kHz) in a very compact form with a short time scale. Whereas for a constant Q wavelet, bass requires much longer time scales which makes it hard to observe high freq details at the same picture because of long time scale.
- Elias
Hello Elias,
Dont' think that I am opposed to the use of the Bark windowing in wavelets tranforms. It is just that I don't think they are universal and that IMHO they benefit to be used in the analysis of long duration signals as (e.g.) the response of a complete multiways system inside a listening room.
The constant Q wavelets transform operates on a fixed number of periods at every frequency and then shows the spreading of the acoustical energy in the time/frequency field with the same precision whatever is the frequency and with no modification based on psychoacoustics theories. In that sense the constant Q wavelets is a better undistorted illustration of what is the signal.
We can do a parallel with the burst decay graph (but that one has IMHO far less resolution as it distorts the time scale).
Best regards from Paris, France
Jean-Michel Le Cléac'h
New version of WTF-Package available
http://www.diyaudio.com/forums/soft...wavelet-analysis-available-2.html#post2492095
Have fun !
Michael
http://www.diyaudio.com/forums/soft...wavelet-analysis-available-2.html#post2492095
Have fun !
Michael
Hi all,
I've just found this thread while looking information about measuring horn reflections for another thread Measuring horn reflections back into the throat
I found Elias GNU Octave script from his homepage and tried to output some measurements with it but I don't know if the measurement technique could work or not ( see post #28) to identify some reflections back to the driver that could possibly be counteracted with a preconditioning filter. If it works, I don't know how to analyze the data or how to develop a preconditioning filter. Since there hasn't been much participants in the other thread maybe some of you could comment? Thanks!
- Status
- Not open for further replies.
- Home
- Loudspeakers
- Multi-Way
- Horn Honk $$ WANTED $$