If compare this to the jzagaja's JMLC horn, this is much cleaner.
The driver/horn integration seems to have a key role here!?
From these measurements and mine, it certainly seems so! The TAD on the good horn is so much cleaner than any other.
I'm going to try 4 different drivers on the 811 horn and will post the results. All Altec drivers, but different magnets, diaphragms, etc. Should be interesting to see what the noodles reveal!
Wavelet analysis are very interesting and powerful tool, however I really think the impedance curve is a better way to characterize horn (with "mic" calibration).
Will text work?Hello ZilchLab,
Can you post the IR file? 🙂
Edit: Hmmm, appears to be the FR. I don't see a means to export the IR other than the CLIO file, which is 240k, even zipped....
Attachments
Last edited:
ALtec 811 sweeps
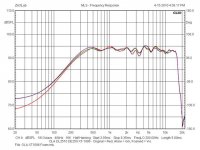
As promised, here are 3 new sweeps of the Altec 811B horn.
Sweeps have an active 250Hz HP (Butterworth)
I ran thru 3 pairs of drivers (6 total) and picked the best looking sweep for each pair.
Included are:
Output of amp across voltage divider for reference
806A aluminum fram
802-8? Aluminum fram
802-8D Symbiotic fram
All on the same horn, same amp, same drive level. Voltage divider of 8R series, 8R shunt. HOLMImpulse calibrated with amp output across voltage divider.
This may help show the difference drivers can make on the same horn. And these are all Altec alnico drivers made for this horn.
Attachments
Hello soongsc,
I think you got a shooting star there 😀
- Elias
I think you got a shooting star there 😀
An externally hosted image should be here but it was not working when we last tested it.
An externally hosted image should be here but it was not working when we last tested it.
- Elias
Hope this is close enought to 48KHz sampling.
Will text work?
Edit: Hmmm, appears to be the FR. I don't see a means to export the IR other than the CLIO file, which is 240k, even zipped....
Clio cannot export IR file to any format but Clio propriatery?
I can try to crunch the Clio binary format with Octave, it should work if it's not crypted.
- Elias
That appears to be the only option.Clio cannot export IR file to any format but Clio propriatery?
I can try to crunch the Clio binary format with Octave, it should work if it's not crypted.
Attachments
Sandbag Removal:
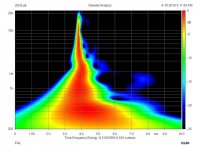
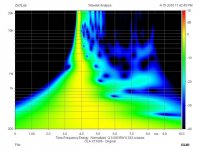
Let's see how some obvious changes are reflected in the wavelet. Here's the original rendering with the full 5ms windowed bandwidth:

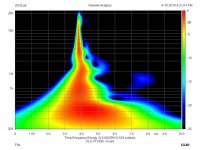
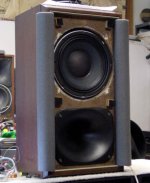
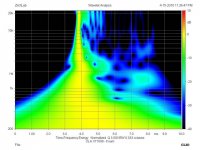
Now, remove the second developmental speaker that was sitting next to it:

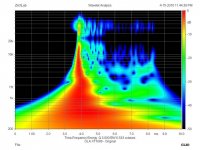
Finally, put foam insulation on the protruding edges of the cabinet, making them more prominent, actually, but rounded:


The FRs under these three conditions:

Let's see how some obvious changes are reflected in the wavelet. Here's the original rendering with the full 5ms windowed bandwidth:
Now, remove the second developmental speaker that was sitting next to it:
Finally, put foam insulation on the protruding edges of the cabinet, making them more prominent, actually, but rounded:
The FRs under these three conditions:
Attachments

Well, we should know pretty soon. The real thing is sitting there waiting to be measured.Hello soongsc,
I think you got a shooting star there 😀
An externally hosted image should be here but it was not working when we last tested it.
An externally hosted image should be here but it was not working when we last tested it.
- Elias

Would you mind doing some more on simulation impulse data of some configurations I posted in the Geddess web? It's easy for me to re-run the simulations.
Last edited:
Can you show the data in a 40db range instead of 25?
and use normalization please too...
Not a lot of work involved -- I'm just clickin' buttons here. 😉
Great button clickin' you are doing here
😀
The wavelets are not normalized; I can do that, but all it does is bump up the falloff at 20 kHz.
There's stuff happening up at 40 - 50 kHz, but that's gotta be aliasing, because the data was acquired at 48 kHz, no?
If so we would be in serious trouble, I guess – but most certainly its just simple cone break up from the compression driver we see here...
🙂
State your hypothesis as to where it is appearing in the wavelet and we'll test that out.
[There's a bigger sandbag, tho.... 😉 ]
Ha ha - the “sandbag” of diffraction alignment
🙂
Michael
Last edited:
Ups, run out of time for editing...
If so we would be in serious trouble, I guess – but most certainly its just simple cone break up from the compression driver we see here plus reflections at very short structures from the phase plug
🙂
Remember that in the department of cone breakup not all parts or the diaphragm are excited at the same time – meaning there is time delay involved very similar to reflections.
This is gonna being an interesting field of further research with wavelet analysis besides the quarter wave honk, I'd say...
So – don't cut out this department – we can learn from displaying the “defects” of our speakers happening
Michael
The wavelets are not normalized; I can do that, but all it does is bump up the falloff at 20 kHz.
There's stuff happening up at 40 - 50 kHz, but that's gotta be aliasing, because the data was acquired at 48 kHz, no?
If so we would be in serious trouble, I guess – but most certainly its just simple cone break up from the compression driver we see here plus reflections at very short structures from the phase plug
🙂
Remember that in the department of cone breakup not all parts or the diaphragm are excited at the same time – meaning there is time delay involved very similar to reflections.
This is gonna being an interesting field of further research with wavelet analysis besides the quarter wave honk, I'd say...
So – don't cut out this department – we can learn from displaying the “defects” of our speakers happening
Michael
Last edited:
By Popular Request:
For starters, you math heads can figure out what's happening up there above 20 kHz; CLIO max sampling rate is 48 kHz for this version:

Here's the three, normalized, to -40 dB:


For fun, open them in separate tabs and click among them.... 😉
For starters, you math heads can figure out what's happening up there above 20 kHz; CLIO max sampling rate is 48 kHz for this version:
Here's the three, normalized, to -40 dB:
For fun, open them in separate tabs and click among them.... 😉
Attachments

Last edited:
The "bigger" sandbag was the second speaker sitting right next to the DUT.Ha ha - the “sandbag” of diffraction alignment.... 🙂
[It's been instructive, tho....
 ]
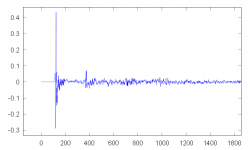
]That worked like a charm! IR looks like this, the x-axis is in samples.
Can you tell the sampling frequency, so I can write WAV file and post here?
I can post an Octave script that converts Clio IR exported .mls file to WAV.
Can you tell the sampling frequency, so I can write WAV file and post here?
I can post an Octave script that converts Clio IR exported .mls file to WAV.
That appears to be the only option.
Attachments
Last edited:
I can post an Octave script that converts Clio IR exported .mls file to WAV.
Oh yes ! - under GNU license please.
Have an easy way to import ARTA *.wav date file as well ?
I didn't have time to figure this out - as the easy way on direct matrix assignment ( [matrix] = load("file"); ) fails due to non-consistent row count.
Michael
Hello Zilchlab,
I did some image analysis treatments of your spectrograms.
You'll find in attached files a first image representing the difference between you spectrogram for the first setup (in vicinity of a second enclosure) and the second (alone enclosure).
Then in a second image you'll see the difference between the spectrogram of the foam filled horn and withot (the spectrogram for the"alone" case).
As we can see the presence of a second enclosure or whatever piece of furniture is visible on the spectrogram over 5kHz and for delay above 1,2ms .
We can see also that the foam filling is important over 4kHz and for short delay (less than 2 ms).
An important thing to notice is the removal of some short delays reflections (bright green spots - may be HOMs) for delay less than 0.6ms and frequency over 3kHz (roughly).
Best regards from Paris, France
Jean-Michel Le Cléac'h
Here's the three, normalized, to -40 dB:
IMG]http://www.diyaudio.com/forums/attachment.php?attachmentid=167183&stc=1&d=1271401509[/IMG]
Attachments
Hi,
I don't understand your description what you would like to do? Import what from where to where? 😀
- Elias
I don't understand your description what you would like to do? Import what from where to where? 😀
- Elias
Have an easy way to import ARTA *.wav date file as well ?
I didn't have time to figure this out - as the easy way on direct matrix assignment ( [matrix] = load("file"); ) fails due to non-consistent row count.
Michael
- Status
- Not open for further replies.
- Home
- Loudspeakers
- Multi-Way
- Horn Honk $$ WANTED $$