In other words... it will be really hard to correct using DSP...
Still a set of real world measurements would be helpful. Looking at the scale on the dB side of the Edge plot shows a less deep 'predicted' dip than in reality. A ~1 dB downwards swing compared to at least 5 dB measured. Leaving the lower bump out of the picture for now which is 2 to 2.5 dB.
Still a set of real world measurements would be helpful. Looking at the scale on the dB side of the Edge plot shows a less deep 'predicted' dip than in reality. A ~1 dB downwards swing compared to at least 5 dB measured. Leaving the lower bump out of the picture for now which is 2 to 2.5 dB.
Last edited:
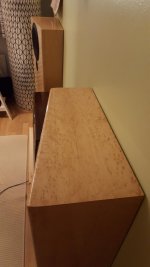
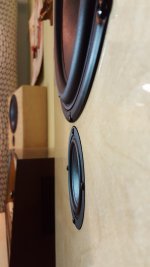
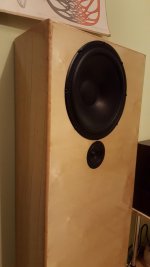
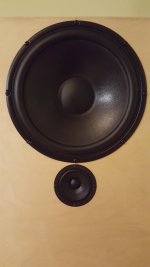
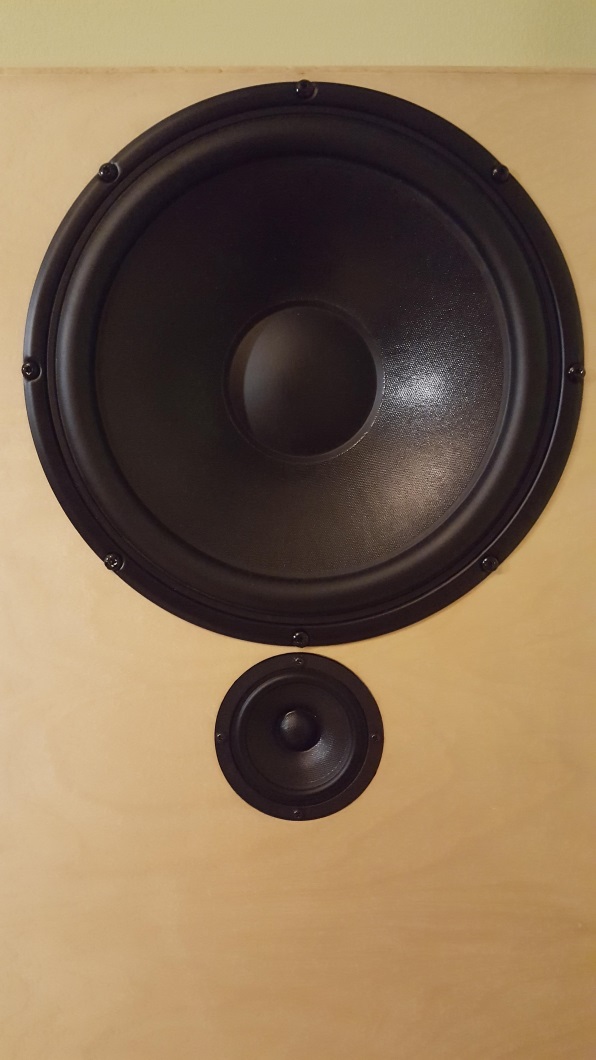
Well, that's a blow. Everything was sailing so smoothly already. Have to take some measurements at listening spot to see how it works in there. Anyhow, here are some pictures of the speakers themselves. The surface is Baltic Birch plywood on the front baffle, sides are veneered with Birds Eye Maple. Surface is high-gloss lacquer. The mess of wires is my placeholder amplifier, two Sanwu TDA7948 driven by 24V 5A bricks and the MiniDSP. The radio on the middle is inheritance from my grandpa. Still has the original receipt with it, too bad the warranty has already expired.
Attachments


Last edited:
In other words... it will be really hard to correct using DSP...
Year except at one position so diffraction seems better to avoid with example 2-3 inch radius round-overs which brings humps down to almost nothing and also having driver in middle center of baffle ensure a move from one side to the other have same response.
Or, in this case, where a lot of effort was put into the enclosure, judging by these latest pictures, EQ the average of multiple sweeps in a wider listening space.
That would still be better than doing nothing. It would be quite heart-breaking to add round overs now 😉.
Does Dirac Live do multiple measurements over the planned listening spot?
That would still be better than doing nothing. It would be quite heart-breaking to add round overs now 😉.
Does Dirac Live do multiple measurements over the planned listening spot?
Last edited:
This is actually exactly what Dirac does. You measure around the listening chair/sofa/place on positions the program suggests, then it calculates the average response and modifies the filters accordingly. Already calibrated it today, and makes a world of difference. Will measure it as well when I get a next good chance of doing it.Or, in this case, where a lot of effort was put into the enclosure, judging by these latest pictures, EQ the average of multiple sweeps in a wider listening space.
That would still be better than doing nothing. It would be quite heart-breaking to add round overs now 😉.
Or, in this case, where a lot of effort was put into the enclosure, judging by these latest pictures, EQ the average of multiple sweeps in a wider listening space.
That would still be better than doing nothing. It would be quite heart-breaking to add round overs now 😉.
Think that sounds clever suggestion and remind me when Raimonds guided me take his scripted multi sweep to base correction on.
Yes, I remembered Dirac does something similar. APL's way of averaging is a sort of advanced way of doing just that as well. It'll be fine, I'm sure. The one thing you might want to work on to get the best you can is the crossover between woofer and 10F. I'd make that a textbook Harsh crossover by EQ-ing the (acoustic) slope to fit into ideal roll off behaviour.
Then run Dirac on top of that. You can make some target slopes with RePhase I guess. Get that hand-off between the drivers just right and let Dirac do the rest.
Then run Dirac on top of that. You can make some target slopes with RePhase I guess. Get that hand-off between the drivers just right and let Dirac do the rest.
Yep, that's what I'm planning on doing with the crossover. The 350Hz was just based on the measured distortion figures from internet.
By the way, if anyone wants to give Dirac a go and uses PC based audio, they have a free trial on their software:
Dirac Live room correction - improves your audio system ? Dirac
By the way, if anyone wants to give Dirac a go and uses PC based audio, they have a free trial on their software:
Dirac Live room correction - improves your audio system ? Dirac
Last edited:
It's not for me, I trust in my own way of doing things 🙂. Taking the DIY level a notch up by doing everything myself, to learn. I've looked at it a long time ago though to figure out what it was they actually do. Just to learn from it.
I'd love to see before and after REW measurements in the exact sweet spot though.
I'd love to see before and after REW measurements in the exact sweet spot though.
Last edited:
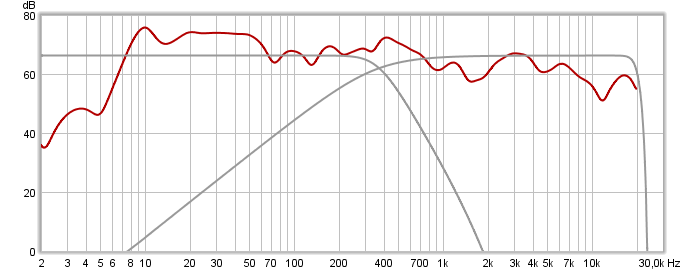
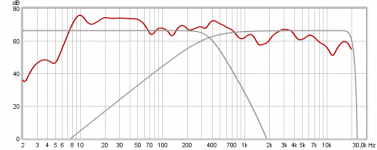
One of Jeff Bagsby's speadsheets can count in the roundovers so did a rough quick and dirty example for offcenter 10F on 50x120cm baffle with 0/1/2/3 inch round-overs and exported as frd files to have them presented overlaid in REW, first plot is at 2 feet distance and second is 8 feet distance.
Attachments
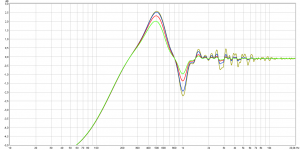
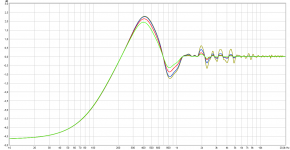
This does show improvements. But again the scale of it is between -2 dB and plus 2.5 dB and round overs does win you quite a bit (about half of the total value) on the dip.
It also shows us why you'd want to measure at the listening position or at least at listening distance.
It also shows us why you'd want to measure at the listening position or at least at listening distance.
This does show improvements. But again the scale of it is between -2 dB and plus 2.5 dB and round overs does win you quite a bit (about half of the total value) on the dip.
It also shows us why you'd want to measure at the listening position or at least at listening distance.
If I remember right from exercises in past having a baffle that is not so wide means the broad and lowest in frq high peak goes away transfering into a more gentle roll off point and then if combined 1-3 inch round over, diffraction and baffle step will look very smooth almost perfect and acceptable.
Good point about measure at listening position or distance, we could also go crazy steering that as long there is only one person listening he wear a position censor so as DSP dynamic will correct based on feedback where listener is placed, but to keep CPU cool and sound staedy don't put sensors to more than one person 😀.
Alright, measurements on the listening seat are done. There might have been a miniscule change in mic orientation between the results, but should be very very close to eachother. I have Dirac Live running on 20Hz-2,5kHz area in the "Dirac ON" measurement. To me, the change from having no DSP to having DSP on doesn't seem too significant.
https://www.dropbox.com/s/rowat0rzo01purt/seat.zip?dl=0
EDIT: I misslabeled them, ON=OFF 😀
https://www.dropbox.com/s/rowat0rzo01purt/seat.zip?dl=0
EDIT: I misslabeled them, ON=OFF 😀
Last edited:
Hi Mayuri,
Think target is to have at listening position (not near field) the precise ACOUSTIC slopes as for harsch XO. This way diffraction and baffle step errors is then ironed out at your favorit chair : )
Think we will have to hope get wesayso to help, he have great knowhow how to window and filter measurement what can be corrected with IRR and and what can be corrected with FIR and what not to touch at all at listening position. Maybe he will feed you with actual corrections to make listening position perfect or maybe he share correction process, will set back and enjoy myself.
Attach textbook Harsch XO at 350Hz in form of IR-wav files that can be imported to REW as target curves and then offset to actual SPL area.
Attachments
Just looked at both measurements and the "Dirac off" curve is slightly better than the "dirac on" one, but there isn't a huge difference between the two.
One thing to notice at the listening spot is the very early reflections in the IR. I don't know if you can solve any of that passively but it would make quite a difference. As it stands the FR is quite hot at 3 KHz, a dip at 2 KHz and that will determine the sound of voices. Why did you cut off Dirac at 2.5 KHz? There is enough to fix up there and the EQ I tried works on both measurements.
Another thing to note is the "off" curve was flipped 180 degree.
There's a pretty huge "problem" I can't fix at ~4.6 KHz if I start to apply some EQ. The rest clears up nicely with some simple IIR.
One thing I have to ask just to be save: This is a single speaker with a Harsch crossover in place right?
Fire up REW and load the EQ settings from the file I attached (Hit EQ button... click on EQ Filters and load these settings once you unzip them (To load, click on folder within EQ window). Look at the FR curve and generate the early waterfall in the split window below it. Time Range 3 ms, Window 3 ms and Rise time 0.1 ms.
There's a clear difference in the early waterfall and also an improvement in the IR.
This is just quick and dirty, we did not check if these trends we see hold true slightly off axis.
And of course listen to it and tell us if you hear that change, with or without Dirac on (preferably with it on)...
Attachments
Last edited:
If you can add these PEQ's, try and record another measurement with it in place. Just to see what it does. Before firing up the EQ button in REW click on the IR Windows and set it to 6 cycles in the Frequency dependent window. If you don't my edits seems to make things worse.
Disclaimer: chances are the baffle shape will be responsible for the dip we see at 2 the KHz area. So this might not work in a wider area.
If it's too much, try the one attached in this post.
Disclaimer: chances are the baffle shape will be responsible for the dip we see at 2 the KHz area. So this might not work in a wider area.
If it's too much, try the one attached in this post.
Attachments
Last edited:
...Another thing to note is the "off" curve was flipped 180 degree...
I'm just enjoyed here and listen Treetop Flyer 🙂 by the way have you noted below and renamed Mayuri's mdats : )
.....EDIT: I misslabeled them, ON=OFF 😀
Yes I know, the Off is slightly better and has Dirac help I suppose...
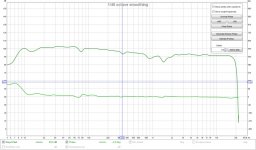
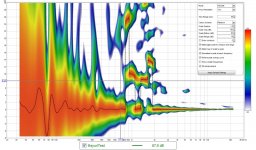
I tried my Line Array FIR recipe on this RAW measurement and it looks like this: (that's the one labelled "On", prediction of the results)

I guess I still like my own recipe's 😀
But it's good to note the dip at 2 KHz didn't get fixed by my "usual" FIR recipe. But look at that phase plot 😉
The wavelet of that prediction:

I tried my Line Array FIR recipe on this RAW measurement and it looks like this: (that's the one labelled "On", prediction of the results)
I guess I still like my own recipe's 😀
But it's good to note the dip at 2 KHz didn't get fixed by my "usual" FIR recipe. But look at that phase plot 😉
The wavelet of that prediction:
Attachments
Last edited:
- Status
- Not open for further replies.
- Home
- Loudspeakers
- Full Range
- Hi-End Full-Range project