Techland, can you repeat this test with 24bit and compares RTX6001 and AP?
I saw a big difference (680ps vs 260ps) in a dac btw 16-24bit measurement on our RTX.
I saw a big difference (680ps vs 260ps) in a dac btw 16-24bit measurement on our RTX.
Also the lower limit of 2.21 ps with the 48 kHz 24 bit test signal, perfectly transmitted digitally (zero jitter), seems questionable. It should be 0...
Right it should be at last 0 FS

Also, the D-Jitter was developt many for SPDIF source where the DAC receiver (as in the old days) hat issues to track/recover the underlying SR clock. So the LSB toggle was sensitive for the PLL loop filter.
Real jitter would be measured & calculated by phase noise & artefacts (side peaks). Also using any ADC & DAC with equal master clock should be clean as possible. Also in that measurement you do not know the jitter of the ADC or DAC or whether is gets reduced by the ADC/DAC combination.
In other words without having a jitter-less (HW) reference, its hard to distinguished to fiddle out the culprit.
hp
Virtins, HPW has a point here. Using a pure 1/4 sf sine (no LSB toggling) makes sense in many cases (maybe even most), and would reduce the measured base jitter with your method at 16 bit significantly. So it might make sense to offer the J-Test psf also without the JD modulation.
jitter or the time version of phase noise would need to be untangled form the base system random noise.
Then you need to separate random jitter from deterministic jitter to start to get useful information. The jitter will wrap around the reference tone (in this case 1/4 X Fs). You could conceivably do the following- first take a baseline noise measurement. This would be the system's floor. Then take one sideband of the reference tone fold it over the other sideband and multiply them (to increase the SNR since they are both the same if you are looking at phase noise) and then you could work out a mapping of that to phase noise and then convert the phase noise to jitter.
Seems like a lot of fuss if all you are getting is bragging rights. What you want is useful info to:
a) find and reduce jitter sources
b) see how much its degrading audio content.
c) separate deterministic jitter sources (much more likely to be audible)
d) address random noise affecting system timing.
Since Delta Sigma DAC's have different jitter sensitivities from R2R Dacs you can't easily compare simple numeric measurements.
Also its hard to find evidence that jitter in modern systems is in any way audible. The sidebands usually are 100 dB below carrier or more and even octaves away 100 dB below loud noise is still hard to accept as audible degradation. A pro audio tape machine might have .1% wow and flutter (or sidebands 60 dB below carrier) and it was considered acceptable.
Last edited:
I agree that it is not about audibility (see the posted examples - if all jitter is noise or buried at -150 dBFS - who cares...) but number throwing, and comparison. Now if there is a software that spits out values in picoseconds then these values should have at least some relevance and usability. The current method, taking all noise into account, is not much more than a THD+N value converted to ps, it seems.
Total & Periodic RMS Jitter Measurement Panel Setting Files
Thank you all for the interesting discussion above.
In additional to the Total RMS jitter calculation, the periodic RMS jitter calculation for the second highest peak (assuming it is a sideband of periodic jitter) is added here in the attached PSF files. A minor correction has also been made for the total RMS jitter formula in Post #491 (changed “227” to “224”, i.e. 3dB difference, or a difference by a factor of 0.707 in the final result).
So now we have two RMS jitter calculation formulae:
1. Total RMS Jitter
POW(10,(224-[f1RMS_A(EU)]+[NoiseLevel_A(EU)])/20)/[f1Freq_A(Hz)] ---------(1)
2. Periodic RMS Jitter
POW(10,(227-[f1RMS_A(EU)]+[f2RMS_A(EU)])/20)/[f1Freq_A(Hz)] -----------(2)
Where:
[f1Freq_A(Hz)] is the DDP for the (peak) signal frequency (in Hz).
[f1RMS_A(EU)] is the DDP for the RMS of the (highest peak) signal frequency (in dB here)
[f2RMS_A(EU)] is the DDP for the RMS of the (second highest peak) sideband (in dB here)
[NoiseLevel_A(EU)] is the DDP for the RMS of the total noise level (in dB here)
POW is the power function.
The following should be noted when interpreting the results:
1. Total RMS jitter contains both random and deterministic jitter. It is calculated based on the ratio of signal level to the total noise level, i.e. SNR, as indicated by “-[f1RMS_A(EU)] + [NoiseLevel_A(EU)])”. In reality, the total noise level is contributed by jitter, thermal and quantization. Therefore, this formula is only meaningful if the noises are mainly caused by jitter. If you are able to measure the noise level without jitter before the jitter measurement. Then this formula can be modified to remove that part of noises, leaving only jitter induced noises for the calculation.
Moreover, if a JTEST signal instead of a pure sinewave is used as the stimulus, its residue will not be removed and will be calculated as a part of the jitter noises. This residue is very small and the JTEST signal is supposed to stimulate the worst-case data jitter of a much higher level than its residue.
2. Periodic RMS Jitter is calculated here using only one of its two sidebands. The software will use the second highest peak in the spectrum as the side band for periodic RMS jitter calculation without checking whether it has a pairing sideband (the third highest peak, by right) on the other side of the test signal. Replace “f2RMS_A(EU)])” with “fnRMS_A(EU)])” to calculate periodic RMS jitter for the nth highest peak. Up to 100 peaks can be detected in MI.
3. As indicated in Section 4.3.1.9.2.1 of the software manual, the JTEST signal is mainly for stimulating worse-case jitter over an AES3 digital audio connection. The above formulae can also be used when the test signal is not a JETST signal but a pure sinewave. You can change to use a pure sinewave from the signal generator panel of MI.
The above formulae can be derived from phase modulation. There are also good references on the internet such as:
1.Audio Precision Application Note #5: Measurement Techniques for Digital Audio.
2. ADI, Converting Oscillator Phase Noise to Time Jitter
Some test examples will be given below.
Attachments
One test example of the above Jitter Measurement Panel Setting
The signal generator of MI supports phase modulation. It is thus handy to simulate a jitter signal with a known frequency and amplitude and then measure them against the theoretical values as well as other reliable references such as those from AP.
The relationship between the max. phase deviation (in degree) and RMS jitter level (in second) can be derived as follows:
A pure sine wave signal can be written as: y(t) = sin(2 * pi * fc * t). If jitter presents, it will be phase-modulated by the jitter signal as follows:
y(t) = sin(2 * pi * fc * (t + Jpp / 2 * sin(2 * pi * fj * t)))
where fc is the carrier frequency, fj the jitter frequency, Jpp the peak-to-peak jitter.
The max. phase deviation (in radian) is then: 2 * pi * fc * Jpp / 2 = pi * fc * Jpp
The max. phase deviation (in angle) is then: fc * Jpp *180 = fc * Jrms * 2.828 *180 = 509 * fc * Jrms (degree), where Jrms is the RMS Jitter level.
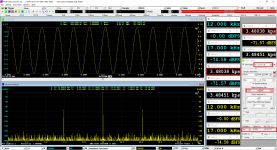
Now, let’s generate a 12kHz sine wave signal that is phase-modulated by a jitter frequency of 5kHz and a RMS jitter level of 3.5ns (i.e. 509 * 12000 * 3.5 * (1E-9) = 0.021378 degree), and sampled at 48kHz, 24 bits. MI is set to software loopback mode "iA=oA, iB=oB".
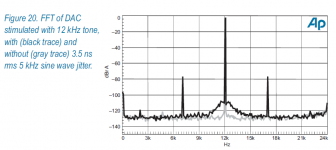
It can be seen from the attached screenshot, the measured RMS jitter level is 3.48ns, which agrees well with the theoretical value. You can also find the same simulation from Fig. 20 in Audio Precision Application Note #5: Measurement Techniques for Digital Audio (see attached picture from this AP document, the document download link can be found in the above post).
By the way, ordinary phase modulation generates multiple pair of sidebands. Jitter level is usually very small compared with the test signal period. So only the highest sideband pair becomes prominent in the spectrum. This make it look like amplitude modulation.
The signal generator of MI supports phase modulation. It is thus handy to simulate a jitter signal with a known frequency and amplitude and then measure them against the theoretical values as well as other reliable references such as those from AP.
The relationship between the max. phase deviation (in degree) and RMS jitter level (in second) can be derived as follows:
A pure sine wave signal can be written as: y(t) = sin(2 * pi * fc * t). If jitter presents, it will be phase-modulated by the jitter signal as follows:
y(t) = sin(2 * pi * fc * (t + Jpp / 2 * sin(2 * pi * fj * t)))
where fc is the carrier frequency, fj the jitter frequency, Jpp the peak-to-peak jitter.
The max. phase deviation (in radian) is then: 2 * pi * fc * Jpp / 2 = pi * fc * Jpp
The max. phase deviation (in angle) is then: fc * Jpp *180 = fc * Jrms * 2.828 *180 = 509 * fc * Jrms (degree), where Jrms is the RMS Jitter level.
Now, let’s generate a 12kHz sine wave signal that is phase-modulated by a jitter frequency of 5kHz and a RMS jitter level of 3.5ns (i.e. 509 * 12000 * 3.5 * (1E-9) = 0.021378 degree), and sampled at 48kHz, 24 bits. MI is set to software loopback mode "iA=oA, iB=oB".
It can be seen from the attached screenshot, the measured RMS jitter level is 3.48ns, which agrees well with the theoretical value. You can also find the same simulation from Fig. 20 in Audio Precision Application Note #5: Measurement Techniques for Digital Audio (see attached picture from this AP document, the document download link can be found in the above post).
By the way, ordinary phase modulation generates multiple pair of sidebands. Jitter level is usually very small compared with the test signal period. So only the highest sideband pair becomes prominent in the spectrum. This make it look like amplitude modulation.
Attachments
For example the Miller measures the 16 bit JD test signal at around 120 ps, but that is peak to peak! Using the above new J-Test psf at 44.1 kHz, your MI measures them at around 620 ps rms, which equals a whopping 1753 picoseconds (digital to digital test, bit-perfect).
Thanks for this information. I have done a search on the internet and found that the 120 ps you mentioned probably came from this stereophile article “A Case of the Jitters”. I quote the relevant description in the article as follows:
“However, the NI cards that are the basis for the Miller Analyzer use 16-bit A/D converters. Although the Miller software uses extensive signal averaging to lower the contribution of these converters' self-noise, it limits the system's resolution to around 120 picoseconds of jitter, which is higher than the jitter of the very best digital audio products now available. “
The lowest measurable RMS jitter “120 ps” above is due to the noise level of the hardware, not the total residual RMS jitter of the 16-bit JTEST signal itself. The apparent wideband noise level can be brought down by increasing FFT size (together with Record Length) in order to make those submerged periodic jitter sidebands to show up. It looks like that “120 ps” is limited by the max. FFT size supported. Just a guess...
Although the total residual RMS jitter of the 16-bit JTEST signal sampled at 44100kHz is 439 ps (see attached). It does not mean the lowest measurable RMS jitter is 439 ps. Attached screenshot illustrates this idea. The residue will only hide about 13 ps RMS jitter sidebands located exactly at the place of the residual sidebands. Although the left most residual sideband has a RMS jitter level of about 558 ps, but the right most "pairing" residual sideband has a RMS jitter level lower than 13 ps. Therefore, any periodic RMS jitter level higher than 13 ps will still show up even if they overlap with the residual sidebands. In this screenshot, the apparent noise level is below 150dB in between the residual sidebands, leaving a plenty of head room for random and periodic jitter to show up.
Attachments
@douggoldberg
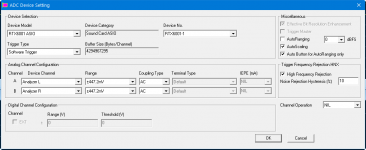
During this test plan configuration, we released that it would be much more efficient for the auto-ranging algorithm to work in the Device Test Plan if the instruction SIR (Set Input Range) supports variables. Currently in V3.8.4.0, only predefined numbers are supported in SIR. Still need a few days to release a minor version upgrade together and the test plan…Thank you for your patience in advance.
During this test plan configuration, we released that it would be much more efficient for the auto-ranging algorithm to work in the Device Test Plan if the instruction SIR (Set Input Range) supports variables. Currently in V3.8.4.0, only predefined numbers are supported in SIR. Still need a few days to release a minor version upgrade together and the test plan…Thank you for your patience in advance.
Virtins, really phenomenal work, and then in such a short time - bravo!
You know what's coming now, don't you? 😀
We need a Jitter field in ps within the generator panel, instead of the phase one (switch between both). Nobody wants to use the calculator all the time...much too cumbersome...
Now, let’s generate a 12kHz sine wave signal that is phase-modulated by a jitter frequency of 5kHz and a RMS jitter level of 3.5ns (i.e. 509 * 12000 * 3.5 * (1E-9) = 0.021378 degree), and sampled at 48kHz, 24 bits. MI is set to software loopback mode "iA=oA, iB=oB".
You know what's coming now, don't you? 😀
We need a Jitter field in ps within the generator panel, instead of the phase one (switch between both). Nobody wants to use the calculator all the time...much too cumbersome...
Your effort to improve the process is great, my congratulations!
I tried to understand well all of these Virtins' information and take a little time to apply them.
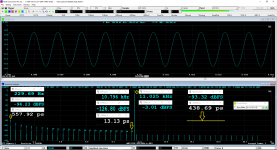
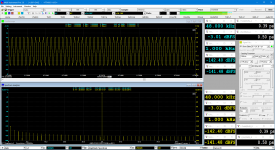
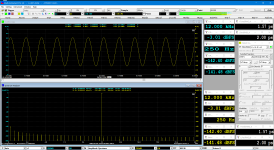
Here three attachments, the first and second was an internal RTX loopback (24bit) at 44.1K & 192K sampling.
There is no zero measurement, but the 192KHz wants a little to be perfect.
Another, is that the f2Freq was the 250Hz for the 48KHz sampling and 1K for the 192KHz sampling.
I can't to find the way to measure the exactly sideband of the fundamental freq. I tried with the F3...fn but the software count other freq.
Then I tried with the external RTX loopback with SE->XLR connection, this is the third capture, the bigger Periodic Jitter due to 2nd freq. measurement that was the peak of 673mHz.
I tried to decrease the X-Axis with the mark of "Start with 20Hz" but it hasn't worked, the same with the 20-20000Hz range.
The search for the second peak done all over the X-range and you can not to set it to a limit range.
I think, it would be very useful to can manually limit the X-range that the software search for the second peak.
I found the post of #507 very interesting. Probably a way to test the capability of a DAC to eliminate the Jitter that we introduce to the digital signal, is int' it?
I tried to understand well all of these Virtins' information and take a little time to apply them.
Here three attachments, the first and second was an internal RTX loopback (24bit) at 44.1K & 192K sampling.
There is no zero measurement, but the 192KHz wants a little to be perfect.
Another, is that the f2Freq was the 250Hz for the 48KHz sampling and 1K for the 192KHz sampling.
I can't to find the way to measure the exactly sideband of the fundamental freq. I tried with the F3...fn but the software count other freq.
Then I tried with the external RTX loopback with SE->XLR connection, this is the third capture, the bigger Periodic Jitter due to 2nd freq. measurement that was the peak of 673mHz.
I tried to decrease the X-Axis with the mark of "Start with 20Hz" but it hasn't worked, the same with the 20-20000Hz range.
The search for the second peak done all over the X-range and you can not to set it to a limit range.
I think, it would be very useful to can manually limit the X-range that the software search for the second peak.
I found the post of #507 very interesting. Probably a way to test the capability of a DAC to eliminate the Jitter that we introduce to the digital signal, is int' it?
Attachments
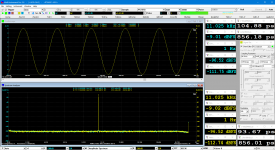
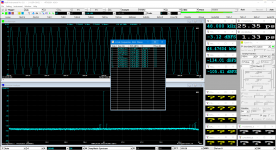
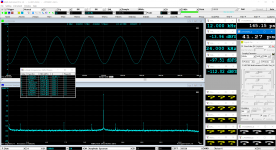
I catch at this capture the side peak of the 48KHz.
I saw that the 46KHz side peak was the 7nth peak from the DDP Array and I replace the 2nd freq. with the 7nth freq. at the Per.Jitter measurement formula.
A 1.33ps was the Periodic Jitter approximately.
I saw that the 46KHz side peak was the 7nth peak from the DDP Array and I replace the 2nd freq. with the 7nth freq. at the Per.Jitter measurement formula.
A 1.33ps was the Periodic Jitter approximately.
Attachments
I found the post of #507 very interesting. Probably a way to test the capability of a DAC to eliminate the Jitter that we introduce to the digital signal, is int' it?
Not at all. You are giving the DAC an audio signal with a specific content and it plays it. All DACs will do identical. You are NOT modulating the sample rate or any clock...
I agree that we giving a signal with a specific content but some DAC manufacturers claim that their own DAC's have an anti-jitter technology inside.
From this point of view, with this method can't we to test how jitter correction the specific DAC can be?
For example, I open two MI instants, the first plays the signal as the Virtin's signal example at the post #507, via my usb receiver (Arta4all driver) without ADC capturing enabled, the second MI instant has the role of ADC capturing that is the output of a specific DAC with anti-jitter technology, without generator enabled.
At the 2nd instant, this of Jitter measurement, I see that the Periodic jitter (modified measurement -> 4th peak, as the example) is a much less (almost 40ps) a far away from the input.
Am I wrong or something has gone from my mind ?
Attachments
Last edited:
I agree that we giving a signal with a specific content but some DAC manufacturers claim that their own DAC's have an anti-jitter technology inside.
Every SD-DAC has. Additionally some DACs have anti-jitter technology for external clocking, like via SPDIF or AES (for USB you don't need that, it runs on internal clock). Either in the chip itself (ESS) or externally in the clock circuits.
From this point of view, with this method can't we to test how jitter correction the specific DAC can be?
No, because that requires you to modulate the SPDIF input, or internal clock that drives the DAC.
For example, I open two MI instants, the first plays the signal as the Virtin's signal example at the post #507, via my usb receiver (Arta4all driver) without ADC capturing enabled, the second MI instant has the role of ADC capturing that is the output of a specific DAC with anti-jitter technology, without generator enabled.
At the 2nd instant, this of Jitter measurement, I see that the Periodic jitter (modified measurement to the side peaks next to 12KHz) is a much less (almost 25-30ps) a far away from the input.
Am I wrong or something has gone from my mind ?
I don't understand your example. And to see a DAC signal in MI you need an ADC, whose exact jitter behaviour is unknown to you...
You have right that I haven't used a SPDIF.
Also, I am looking more carefully at the Virtins' example and I have done a terrible error in my example.
I haven't use a PM Modulation but a FM! Completely wrong all my example!
Also, I am looking more carefully at the Virtins' example and I have done a terrible error in my example.
I haven't use a PM Modulation but a FM! Completely wrong all my example!
I can't to find the way to measure the exactly sideband of the fundamental freq. I tried with the F3...fn but the software count other freq.
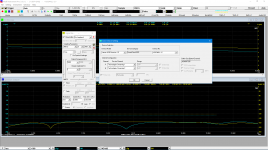
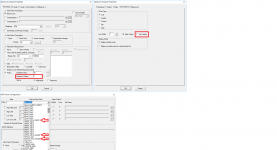
From your later posts, it looks like that you have already found the way to pick the correct frequency, amplitude, and Phase DDPs of any peaks. Here is the summary (see attached):
1. To put the spectrum analyzer in peak detection mode, right click the spectrum analyzer and select [Spectrum Analyzer Processing]>”Parameter measurement”>”Peaks”. You can specify the Deadband (minimum distance between two peaks in Hz) and number of peaks (up to 100) to detect. You can also specify whether these peaks to be sorted according to magnitude or frequency. These peaks can be labelled automatically if you right click the spectrum analyzer and select [Spectrum Analyzer Chart Options] and tick “Mark Peaks” and “with Labels”.
2. You can access the frequency and amplitude DDPs for the first seven peaks via f1Freq_A(Hz) ~ f7Freq_A(Hz), f1RMS_A(EU) ~ f7RMS_A(EU).
You can access the frequency, amplitude and phase DDPs for all the peaks via DDP arrays: fnFreq_A(Hz)_Array[0], fnRMS_A(EU)_Array[0], fnPhase_A(D)_Array[0]. Replace “[0]” with the array index which starts from zero. For example, if you want pick the 99th peak, replace"[0]" with “[98]”.
Then I tried with the external RTX loopback with SE->XLR connection, this is the third capture, the bigger Periodic Jitter due to 2nd freq. measurement that was the peak of 673mHz.
I tried to decrease the X-Axis with the mark of "Start with 20Hz" but it hasn't worked, the same with the 20-20000Hz range.
The search for the second peak done all over the X-range and you can not to set it to a limit range.
I think, it would be very useful to can manually limit the X-range that the software search for the second peak.
You can use the frequency compensation function of the spectrum analyzer to do that. For example, if you only want to detect the peaks within 20Hz ~20kHz, in the frequency compensation file ( a CSV text file), enter the following two lines:
1,20,0
2,20000,0
Which means that 20Hz gains 0dB and 20000Hz gains 0dB, and the software will perform linear interpolation in between automatically. Outside the range defined by the first line and last line, a gain of -1000dB will be assigned by the software. Please refer to Section 3.3.2.8.1.2 of the software for details.
I found the post of #507 very interesting. Probably a way to test the capability of a DAC to eliminate the Jitter that we introduce to the digital signal, is int' it?
Data content can cause jitter in the recovered clock over an AES3 link. The JTEST signal is already represents the worst case.
Reducing jitter in the data content (not clock) probably can only be done through post processing based on the content coherence (if any). For example, some software can remove wow and flutter in music that has been mechanically recorded on medium based the coherence of musical notes.
Attachments
Post #507 is probably a convenient way to test the audibility of various periodic jitters, as one can adjust the jitter frequency and amplitude easily.
Yes, I have already found the way to pick the correct frequency, amplitude, and Phase DDPs of any peaks, Virtins....thanks for the tip with Array [0]
I have a problem with a compensation file yet, with the fcf type...I have done a try with a CSV file via excel but is not recognized from MI software.
I am looking how to change a csv to fcf type.
But, I think that it could be nice to the future to setup a range that you want to find the MI software the peaks, without this to be a general compensation file to all sampling area.
I don't understand this...how this works? An example with real music, perhaps?
I have a problem with a compensation file yet, with the fcf type...I have done a try with a CSV file via excel but is not recognized from MI software.
I am looking how to change a csv to fcf type.
But, I think that it could be nice to the future to setup a range that you want to find the MI software the peaks, without this to be a general compensation file to all sampling area.
Post #507 is probably a convenient way to test the audibility of various periodic jitters, as one can adjust the jitter frequency and amplitude easily.
I don't understand this...how this works? An example with real music, perhaps?
Last edited:
- Home
- Group Buys
- GB for Virtins MI Pro for RTX6001 autoranging/autoscaling & for soundcard end users