Would it be easy to change the vertical scaling for distortion to dBR, or mabe both dBR and percentage? When the zeros start multiplying the numbers become hard to work with.
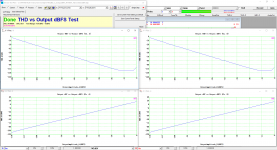
Yes. Just replace the DDPs: "THD_A(%)" and "THD_B(%)" with DDPs: "THDDB_A(dB)" and "THDDB_B(dB)", and then change the Y scale of the corresponding graphs. Here is the new DTP and the test result of RTX6001's own DAC @20dBV.
Attachments

The output dBV values in the above post and Post #536 were obtained from the DDPs: "RMS_A(dBV)" and "RMS_B(dBV)", which represent the total energy of the measured signals including the fundamental, harmonic distortions and noises. At the low end of output dBFS, the measured total energy contains mostly the noises from RTX6001 DAC and ADC which are not test signal related. As a result, the output dBV vs output dBFS curve deviates significantly from the straight line at the low end of output dBFS. If these narrow-banded DDPs: "f1RMS_A(EU)" and "f1RMS_B(EU)", which represent the energy at the test frequency only, are used for output dBV instead, then the graph will look very much linear even at the low end of output dBFS. Attached is the new DTP and the test result of RTX6001's own DAC @20dBV.
Attachments
Thanks Virtins for the new DAC test.
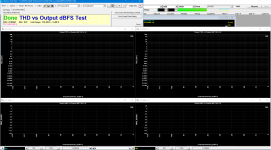
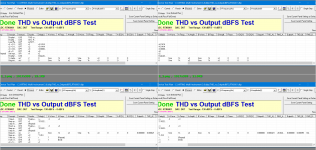
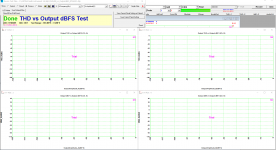
I tried the test of 536 post but I have a problem that I make me to laugh!
The test is Done but I haven't any graph on Display!
Here the screen captures.
What I have wrong?
I tried the test of 536 post but I have a problem that I make me to laugh!
The test is Done but I haven't any graph on Display!
Here the screen captures.
What I have wrong?
Attachments

You can use [help=>[About] to check whether you are using V3.8.5.2.
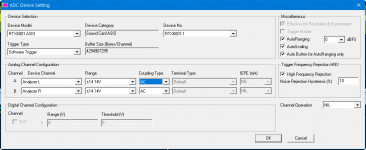
Also, do not tick "Auto Ranging" and "Auto Scaling" in [Setting]>[ADC Device]. "Auto Ranging" is done within the script in Device Test Plan. Just use the default setting.]%[/help]
Also, do not tick "Auto Ranging" and "Auto Scaling" in [Setting]>[ADC Device]. "Auto Ranging" is done within the script in Device Test Plan. Just use the default setting.]%[/help]
Last edited:
I had already installed the V3.8.5.2
I tried without "Auto Ranging" and "Auto Scaling" in [Setting]>[ADC Device].
I had a suspicious that correlated with my MI-Pro package, for this reason I tried and with trial version that including everything.
The relays click OK, the ADC varies OK but...
Unfortunately, same behavior.
Is there any other member with success?
Attachments
Last edited:
small problem; In dont have device test plan in my software. Do I have the wrong version?
The function "THD vs output dBFS" and "Output dBV vs Output dBFS" is now available in V3.8.5.2. You can load the Device Test Plan named "THD_vs_OutputdBFS_RTX6001.dtp" to perform the test. It can be used to measure a DAC using RTX6001's ADC. This device test plan is configured using variables and is able to perform RTX6001 input autoranging based on -3 dB criterion. The step from -130dBFS to 0dBFS output is also configured as 3 dB. There are only 20+ test steps in total. So these parameters can be easily found and modified.
Please note that in this test plan:
1. [Setting]>[ADC Device]>"Device Model" should be set to "RTX6001 ASIO" or "RTX6001 MME".
2. [Setting]>[DAC Device]>"Device Model" should be set to "Sound Card ASIO" or "Sound Card MME" and the DAC under test should be selected in "Device No." selection box.
3. [Setting]>[Calibration]>"Sound Card Output Calibration Factor">"Range (V)" should remains as "±1V" (the default value). It is used as the 0 dBFS reference in this test plan.
The following is the test result of RTX6001's own DAC @20dBV. (It was switched to the 20dBV gain setting when [Setting]>[DAC Device]>"Device Model" = "RTX6001 ASIO". After that, let [Setting]>[DAC Device]>"Device Model" = "Sound Card ASIO" and "Device No." = "RTX ASIO Driver"). During this test, the input range of RTX6001 will automatically changed from ±141.4mV to ±44.72V as the output dBFS steps up from -130dBFS to 0dBFS.
small problem; In dont have device test plan in my software. Do I have the wrong version?
Hello Doug,
Virtins MI software doesn’t come automatically with the add-on entitled “Device Test Plan,” please see Multi-Instrument, a powerful multi-function virtual instrument software - Virtins Technology and the add-ons pull-down menu where you’ll see it cost $99.95 as an add-on module to MI and Multi-Instrument - Device Test Plan by Virtins Technology for the specific details on what this add-on module does. Of course anyone is free whenever they want to purchase additional add-ons to MI via their main website.
V/R,
MI Pro
Thanks Virtins for the new DAC test.
I tried the test of 536 post but I have a problem that I make me to laugh!
The test is Done but I haven't any graph on Display!
Here the screen captures.
What I have wrong?
I am OK now, I had to uninstall and reinstall the MI-Pro.
THD vs Output diagram and DAC Linearity are very useful DAC tests.
I think that the DAC Section has completed.
I have a proposal for the next DUT Test, for the power supplies.
What about for PSRR !
Is that a challenge?
@lemon
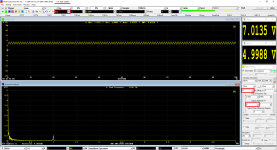
The bottom right process window in your Post #544 shows that the data for OutputAmplitude_A(dBFS), THD_A(%), RMS_A(dBV), OutputAmplitude_B(dBFS), THD_B(%), RMS_B(dBV) are 0, 0.000421, -20.024, 0, 0.000351, NA respectively. The "NA" is the problem. You can move the DTP window and X-Y Plots aside in order to show the oscilloscope, spectrum analyzer and multimeter windows behind and find out why the RMS_B(dBV) is not available. It should be shown in the multimeter window.
The bottom right process window in your Post #544 shows that the data for OutputAmplitude_A(dBFS), THD_A(%), RMS_A(dBV), OutputAmplitude_B(dBFS), THD_B(%), RMS_B(dBV) are 0, 0.000421, -20.024, 0, 0.000351, NA respectively. The "NA" is the problem. You can move the DTP window and X-Y Plots aside in order to show the oscilloscope, spectrum analyzer and multimeter windows behind and find out why the RMS_B(dBV) is not available. It should be shown in the multimeter window.
@lemon
Glad to know the problem has been solved. I did not notice that you have already solved it.
Glad to know the problem has been solved. I did not notice that you have already solved it.
Yeap, the problem is solved 🙂
Now, we are waiting for the another Device Test Plan with suggestion to the PSU PSRR.
Now, we are waiting for the another Device Test Plan with suggestion to the PSU PSRR.
Bode Plot and PSRR Measurements
Putting how to inject the AC stimulus into the DC power supply aside, PSRR measurement is just like the gain measurement in a Bode plot. The gain is obtained by measuring the ratio of the DUT's output AC voltage caused by the DUT's input stimulus to the input stimulus AC voltage.
There are a few ways to measure a Bode plot in Multi-Instrument. There is a button labelled “BodePlot” in the Hot Panel Setting Toolbar (the third toolbar from the top). Once clicked, it will load a pre-configured panel setting file for Bode plot measurement. The spectrum analyzer will be set to Transfer Function measurement mode. This mode uses a dual-FFT method to measure the gain and phase plot (Bode plot). The input Ch. B should be used to measure the stimulus sending to the DUT and the response from the DUT should be measured by the input Ch. A. PSRR is usually defined as the reciprocal of the gain. In this case, just feed the stimulus to Ch. A and the response to Ch. B.
The “BodePlot” button uses white noise as the stimulus. But other wideband stimuli can also be used such as frequency sweep and MLS, etc.. You can change the stimulus in the signal generator panel of MI.
If a frequency sweep is used, be sure to set the sampling duration of the oscilloscope to be the same as the sweep duration, and the oscilloscope trigger parameters properly such that the entire sweep process will be captured in one oscilloscope frame. The FFT size of the spectrum analyzer should be equal to or greater than the number of samples (Record Length) in the oscilloscope. Rectangle window should be used so as not to suppress any frequency component in the sweep.
Frequency stepped sinewave stimulus can also be used. But this will have to be done using the Device Test Plan. One advantage of this method is that auto-ranging can be configured in the test steps to maximize the measurement accuracy should the gain / attenuation span a very big range as the test frequency changes.
Last edited:
How to inject an AC stimulus into the DC power supply?
For PSRR measurements, the DUT can be a power supply, an amplifier, etc.. Different stimulus injection methods exist including LC summing node to sum DC and AC, AC and DC summing amplifier, injection transformer, etc.. Under some situations, it may be possible to use RTX6001 to output DC+AC directly to measure PSRR. When designing the measurement setup, just remember that its output impedances for balanced and unbalanced output are 100 ohms and 50 ohms respectively. This will limit the current it can supply and cause a voltage drop as well.
The following example shows a 6 VDC + 1 VAC (1kHz) output by RTX6001's single-ended output with Multi-Instrument. As RTX6001’s input cannot measure DC (even if DC coupling is selected), VT DSO-2A20E was used instead to measure this signal.
Attachments
Last edited:

Putting how to inject the AC stimulus into the DC power supply aside, .... PSRR is usually defined as the reciprocal of the gain. In this case, just feed the stimulus to Ch. A and the response to Ch. B.
....
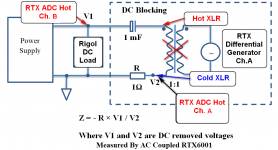
I followed the diagram that previous I had attached, but I am afraid that something goes wrong!
Attachments

If you are following your sketch the - drive from the RTX is shorted to ground or across the 1 Ohm resistor? The RTX has differential input and depending on what you are trying to measure you could measure across the series resistor for current into the load and across the power supply to see the voltage change vs current. That would be a measure of the impedance vs frequency at a given current.
If you are trying to get PSRR you would need to add the disturbing voltage in series with the supply (this is where transformers cannot be beat) vs. voltage change in the output.
The real limitation for these measurements is the 95 KHz max frequency of the RTX or almost any soundcard. The plot you show with a 2 MHz bump shows a potential problem with stability at that frequency which should be addressed.
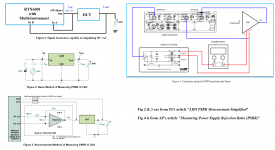
PSRR disturbing AC voltage injection methods
The power supply Zo & Phase measurements completed previously inject the disturbing AC voltage to the power supply's output, whereas in the power supply PSRR tests here, the disturbing AC voltage should be injected to the power supply's input.
The attached picture shows four methods to inject the stimulus. Figs. 2&3 are extracted from TI's article "LDO PSRR Measurement Simplified" at
http://www.ti.com/lit/an/slaa414a/slaa414a.pdf. Fig. 4 is from AP's article: "Measuring Power Supply Rejection Ratio (PSRR)". Fig. 1 is simple but with a limited output current and voltage.
in the PSU Bode Test can I used the diagram that we used at the Zo & Phase measurement (as the attachment)?
The power supply Zo & Phase measurements completed previously inject the disturbing AC voltage to the power supply's output, whereas in the power supply PSRR tests here, the disturbing AC voltage should be injected to the power supply's input.
The attached picture shows four methods to inject the stimulus. Figs. 2&3 are extracted from TI's article "LDO PSRR Measurement Simplified" at
http://www.ti.com/lit/an/slaa414a/slaa414a.pdf. Fig. 4 is from AP's article: "Measuring Power Supply Rejection Ratio (PSRR)". Fig. 1 is simple but with a limited output current and voltage.
Attachments
Post #555 showed an example of outputting 6 VDC + 1 VACpeak (1kHz) by RTX6001. The signal can be used as frequency stepped sinewave excitation through Device Test Plan in Method 1 described in the above post .
The signals in the following two examples can be used with the Bode Plot function in Method 1.
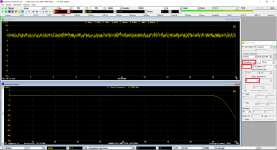
(1) 6 VDC + 1VACpeak (white noise) output by RTX6001 and measured by VT DSO-2A20E
(2) 6 VDC + 1VACpeak (10Hz~96kHz linear frequency sweep) output by RTX6001 and measured by VT DSO-2A20E
Both graphs actually reflect the frequency response of the RTX6001 signal generator.
The signals in the following two examples can be used with the Bode Plot function in Method 1.
(1) 6 VDC + 1VACpeak (white noise) output by RTX6001 and measured by VT DSO-2A20E
(2) 6 VDC + 1VACpeak (10Hz~96kHz linear frequency sweep) output by RTX6001 and measured by VT DSO-2A20E
Both graphs actually reflect the frequency response of the RTX6001 signal generator.
Attachments

- Home
- Group Buys
- GB for Virtins MI Pro for RTX6001 autoranging/autoscaling & for soundcard end users