I can go wider and extend H control lower but as you said its already large; OTOH what is another 4" on top of the initial 20"
Looking at response vs height instead of just the polars, I see I might want to restore some of that narrowing in the vertical circa 500 Hz
Looking at response vs height instead of just the polars, I see I might want to restore some of that narrowing in the vertical circa 500 Hz
Attachments
Perhaps not. Your comment triggered some thinking that led to this. I set out to smoothen and flatten the power response and DI curves instead of simply trying to narrow the vertical window circa 500 Hz.
I have a global EQ to which I've added a low Q PEQ at 40 Hz. This PEQ allows me to season the bass response to taste. I flattened the axial response and then pulled down at 40 Hz leaving the room and power responses that you see. The power response follows the iroom response in the bass. As I claimed before, for a corner speaker the room response curve is more representative of what one hears as the direct response in the bass.
This was after changing the TC9 vertical position to represent waveguide rim slots and optimizing the XO frequencies and slopes. I high pass the TC9s at 600 Hz before their response widens too much and low pass the 5FEs at 926 2nd order so their response above 600 Hz narrows the vertical response. I've set Vituix options to "corner" and have all reflections enabled. The listening window is set to +/- 20 degrees, H & V.
As can be seen in the power response and DI, I still have some directivity mismatch in my overlap and cross-over regions but I hope they are not so large as to ruin the response as there doesn't seem to me much more that I can do about them. Above 1200 Hz, the power response curve is all waveguide. It may be the slight hump there can be dealt with in ATH; I only ran enough ATH iterations to get the aspect ratio I was looking for.
Attachments

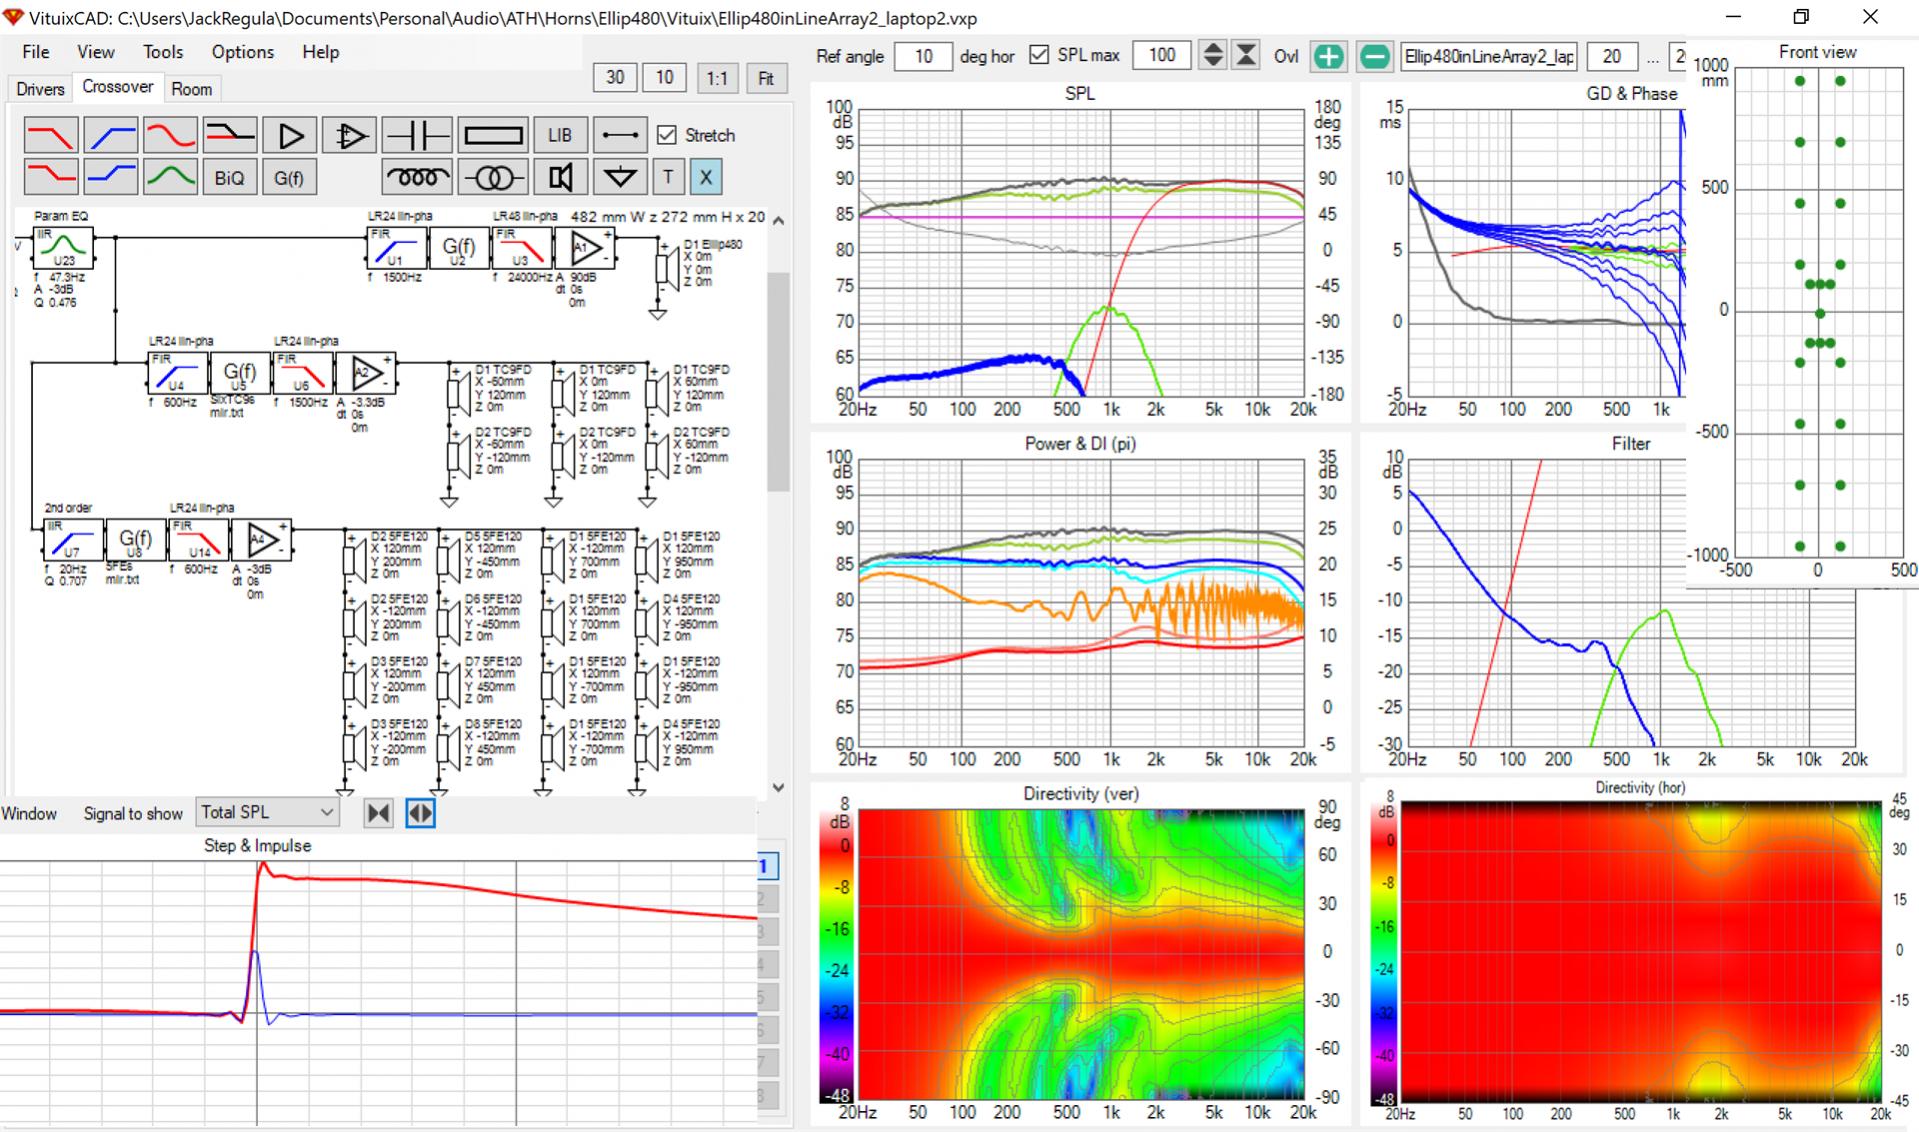
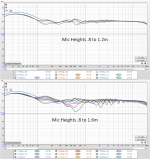
Here are plots of the room response vs height both on axis and 10 degrees off axis with the speaker toed in 45 degrees, placed tight into a corner and all reflections enabled. Absorption is 2 db on all surfaces.
On axis, Vituix doesn't include any wall contributions because directivity extends only to 90 degrees. This is clearly wrong but Vituix knows it can't get it right so it doesn't include it. Off axis, we get a contribution from the closer wall that shifts the response.
The upper group is the response on axis. The anomalous trace is for a vertical offset of zero. Except for the 700 mm offset trace (mic ht of 1.7m, which is over my head), the entire set is within a 5 db window.
Just 10 degrees off axis, the zero offset curve is no longer anomalous. That is good because that is where I would listen and equalize. I think the off axis results are relatively trustworthy; Vituix has difficulty with the on axis set because the directivity data extends only to +/-90 degrees where walls are encountered.
This is better than anything I've ever simulated and it makes the effort worthwhile.
Attachments
It may seem like I'm chasing my tail in a circle but what I hope is happening is that I'm spiraling in on a really good solution 🙂
The light went on overnight when I realized that the reason I had so little vertical variation of the room response was that I had done very little equalization of the room response. I've known for a long time but often lose sight of the fact that any equalization of a signal that is a composite of multiple source is position dependent. Any improvement made by driver overlap will be position dependent as will any equalization of the room response. Arraying reduces positional dependency by averaging multiple drivers.
In removing the overlap, I had to squeeze driver pairs together to get a wide enough H response outside the waveguide. A small dip at XO remains. Changing H position affected the vertical. Thus another iteration.
What to do about wall reflections and Vituix's inability to calculate them from only 90 degree data? Best for now to model enough - 8 db - wall absorption so they don't matter.
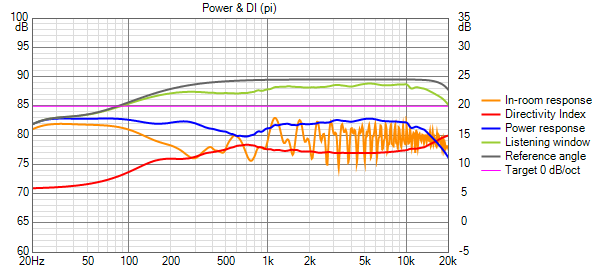
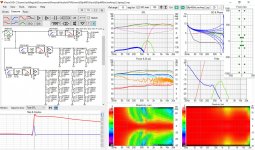
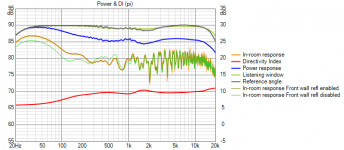
Finally,I had Vituix calculate power and DI on a cylindrical surface limited to corner response. With all that, this is what I got:
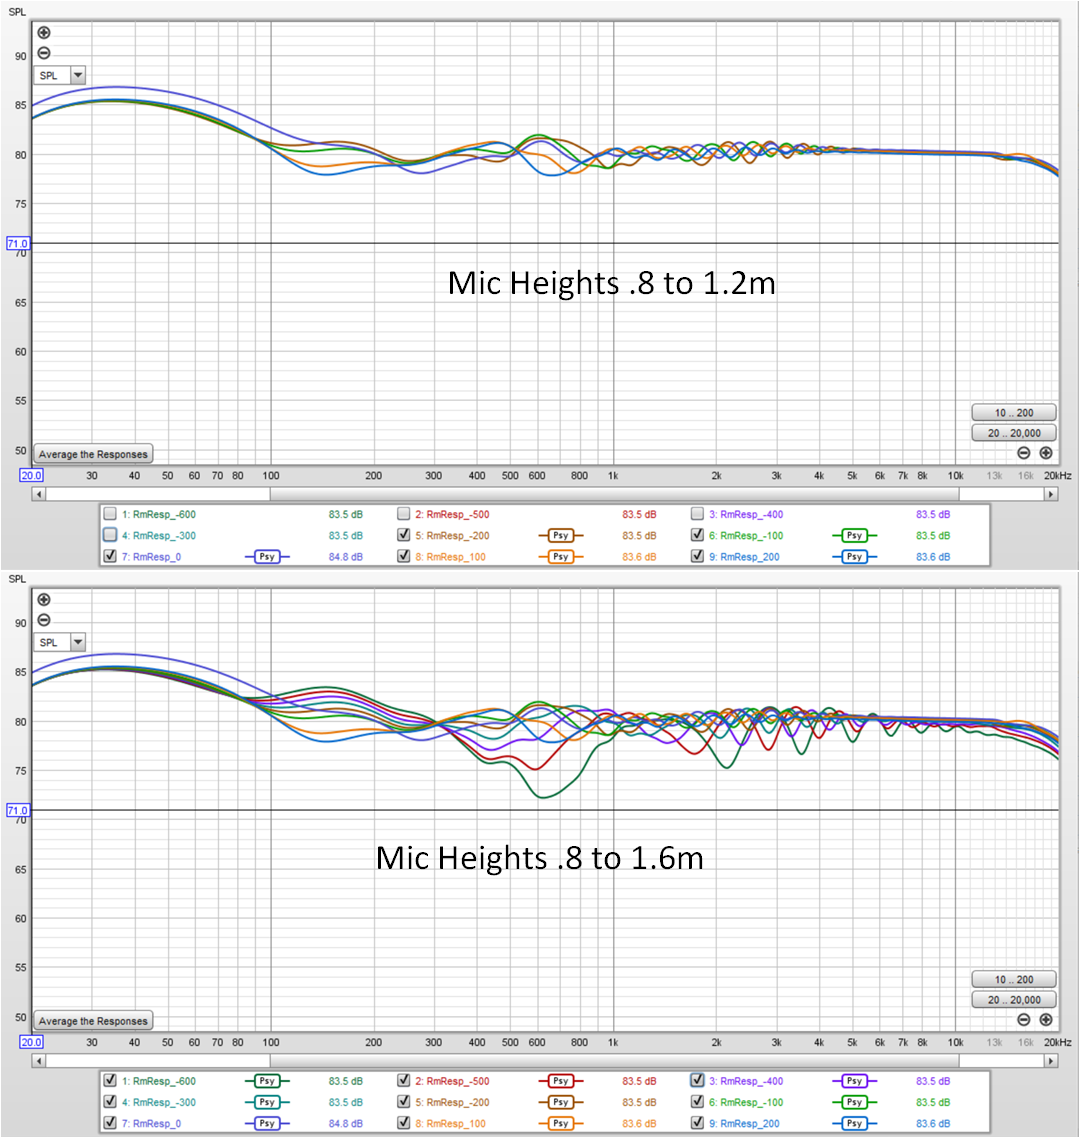
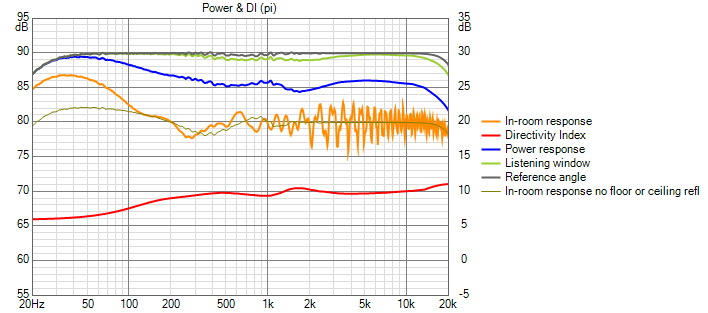
A low Q -3db PEQ at 47 Hz flattened the power response and resulted in a room ressponse, which I take as the actual direct response, with an elevated bass that is likely to suit my taste. The DI is slowly and smoothly rising with minor undulations. Except in the bass and for the combing with floor and ceiling the room response is nearly flat. Floor reflections increase the response variation with height in the 500 Hz to 1 kHz range.
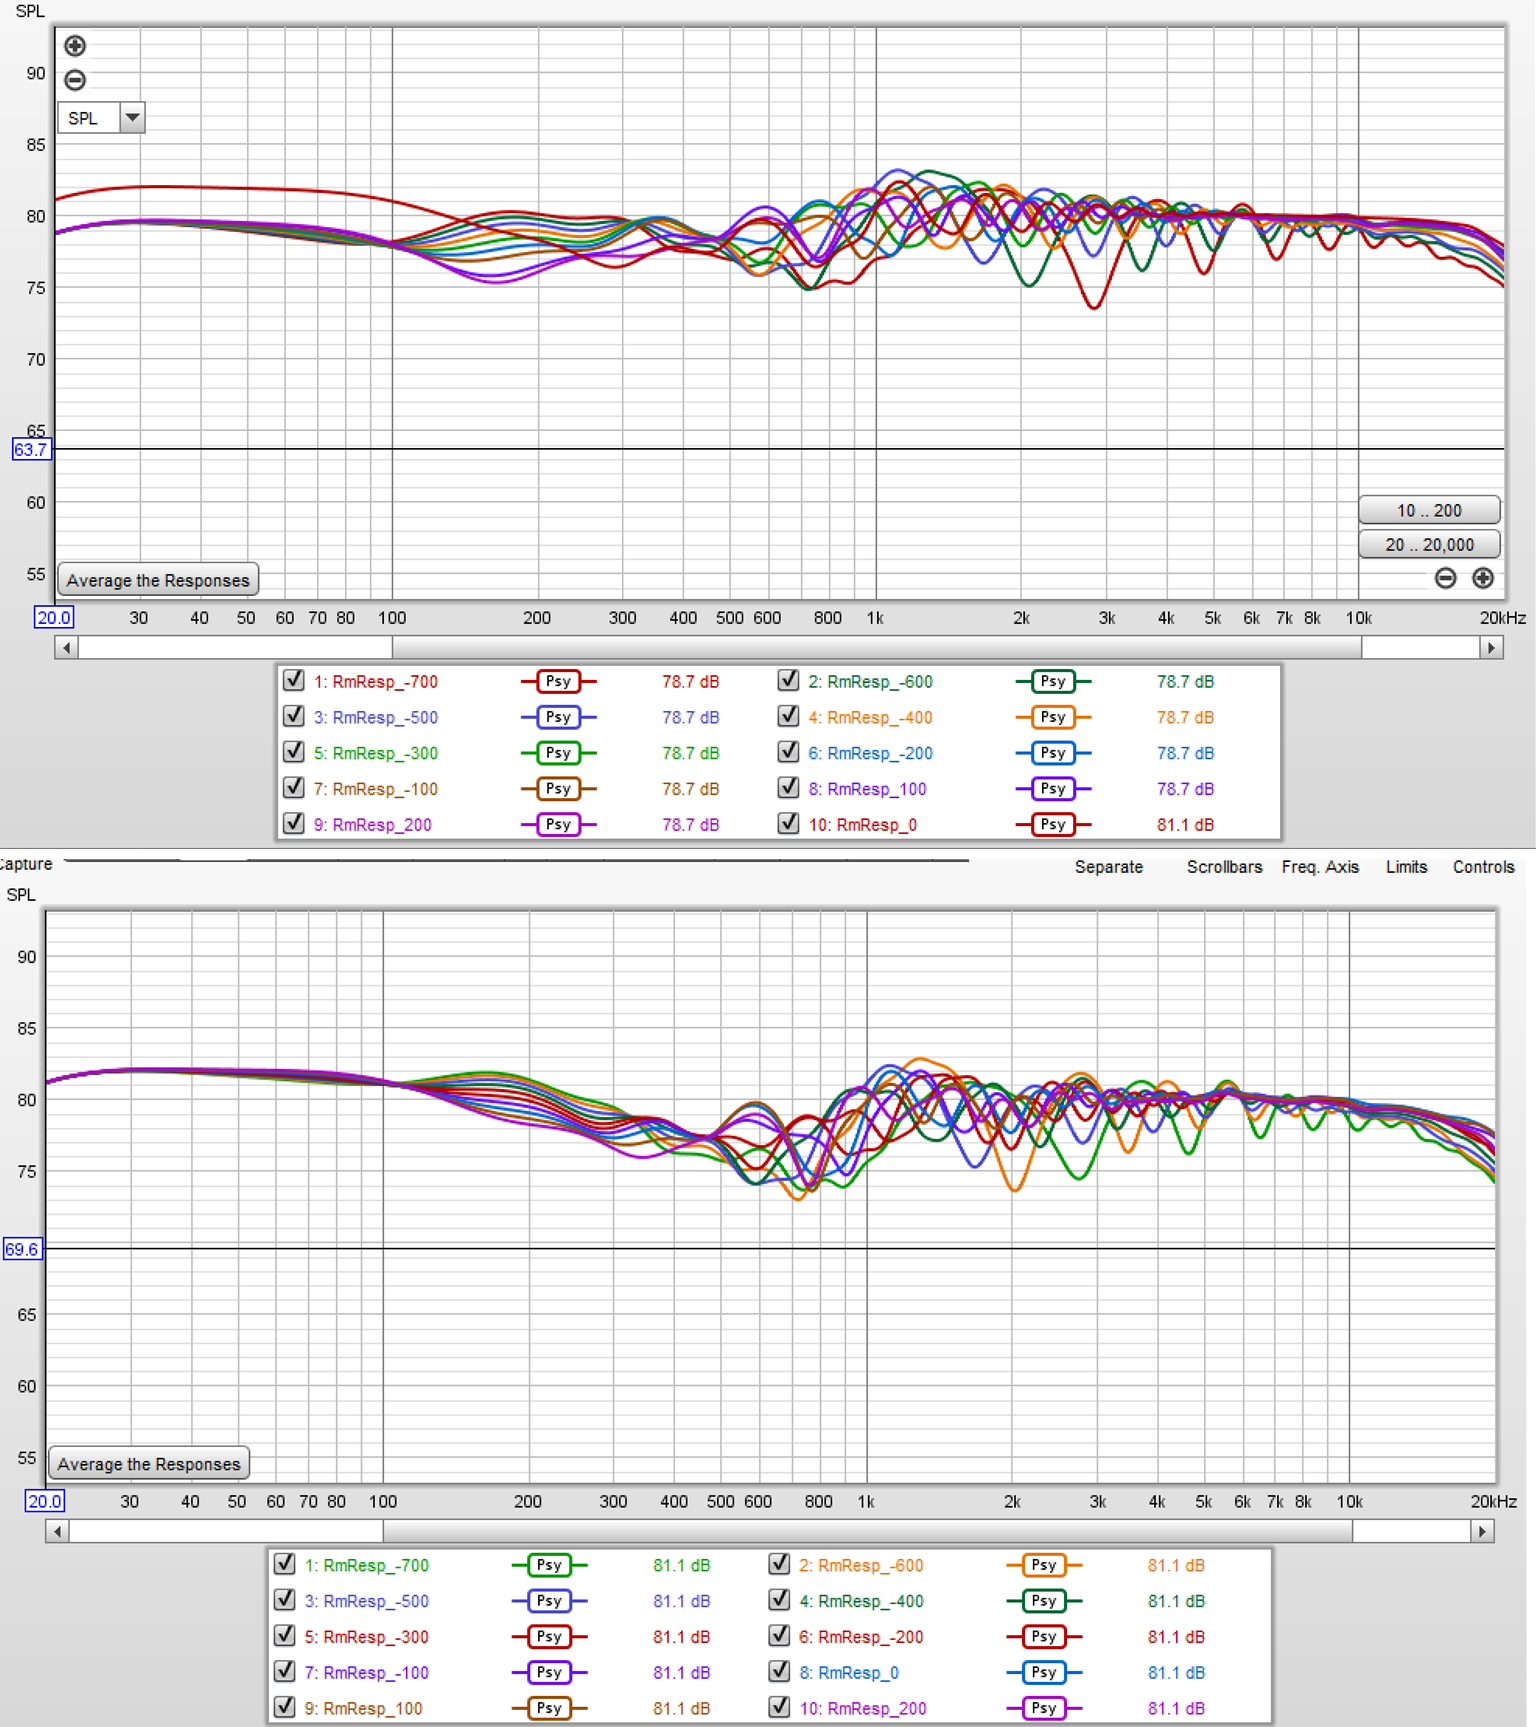
Here is the room response vs vertical offset
The upper group is responses from a mic height of .8m to 1.2m corresponding to seated height. The lower group extends up to 1.6m, which is the outlier curve below all the others circa 800 Hz.
One caveat is that the TC9 vertical offset ended up inside the waveguide. With response limited to 600 Hz++ that should not be a problem, as shown in earlier simulations. The number of TC9s reduced to 6. They may well become DMA45s before I'm done.
The light went on overnight when I realized that the reason I had so little vertical variation of the room response was that I had done very little equalization of the room response. I've known for a long time but often lose sight of the fact that any equalization of a signal that is a composite of multiple source is position dependent. Any improvement made by driver overlap will be position dependent as will any equalization of the room response. Arraying reduces positional dependency by averaging multiple drivers.
In removing the overlap, I had to squeeze driver pairs together to get a wide enough H response outside the waveguide. A small dip at XO remains. Changing H position affected the vertical. Thus another iteration.
What to do about wall reflections and Vituix's inability to calculate them from only 90 degree data? Best for now to model enough - 8 db - wall absorption so they don't matter.
Finally,I had Vituix calculate power and DI on a cylindrical surface limited to corner response. With all that, this is what I got:
A low Q -3db PEQ at 47 Hz flattened the power response and resulted in a room ressponse, which I take as the actual direct response, with an elevated bass that is likely to suit my taste. The DI is slowly and smoothly rising with minor undulations. Except in the bass and for the combing with floor and ceiling the room response is nearly flat. Floor reflections increase the response variation with height in the 500 Hz to 1 kHz range.
Here is the room response vs vertical offset
The upper group is responses from a mic height of .8m to 1.2m corresponding to seated height. The lower group extends up to 1.6m, which is the outlier curve below all the others circa 800 Hz.
One caveat is that the TC9 vertical offset ended up inside the waveguide. With response limited to 600 Hz++ that should not be a problem, as shown in earlier simulations. The number of TC9s reduced to 6. They may well become DMA45s before I'm done.
Attachments

I reran the abec sim to get 96 frequencies at a mesh frequency of 2000 and got smoother curves.

I repositioned the six TC9s just outside the waveguide edge without ill effect. I had been wanting to try frequency shading the 5FE120 array to see if that improved the vertical directivity. Passive shading didn't work out but I got an incremental improvement by cutting off the outermost 3 rows of 5FEs at ultimately 486 Hz, with a lower slope. Comparing vertical line charts, this brought the 10 degree line 1db closer to the axis in the dip near 500 Hz. The 15 degree line moved 2 db closer to the axis. The 20 degree line dips so deep that 20 degrees is (just?) outside the vertical listening window.
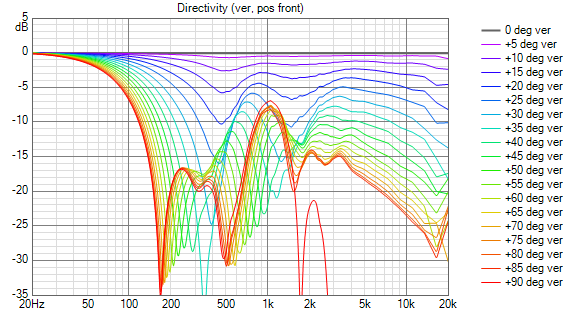
The benefit of the extra "way" in terms of reduction in vertical variation is only .5 db in the seated range. ofsets of 0+/- 200mm, so I question its worth.
I repositioned the six TC9s just outside the waveguide edge without ill effect. I had been wanting to try frequency shading the 5FE120 array to see if that improved the vertical directivity. Passive shading didn't work out but I got an incremental improvement by cutting off the outermost 3 rows of 5FEs at ultimately 486 Hz, with a lower slope. Comparing vertical line charts, this brought the 10 degree line 1db closer to the axis in the dip near 500 Hz. The 15 degree line moved 2 db closer to the axis. The 20 degree line dips so deep that 20 degrees is (just?) outside the vertical listening window.
The benefit of the extra "way" in terms of reduction in vertical variation is only .5 db in the seated range. ofsets of 0+/- 200mm, so I question its worth.
Attachments


The results shown in the previous post had equalization of only the axial response and that was just to compensate for the overlap of the two partitions of the 5FE120 array.
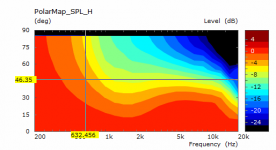
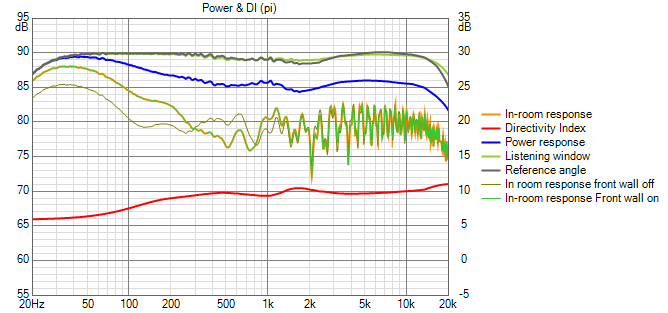
wall reflections were enabled at -8db. Floor and ceiling were at -2 db. Vituix doesn't show wall reflection nulls on axis but if the reference angle is changed it will. Enabling/disabling the left wall reflection doesn't affect the picture. Vituix can't handle the case of the point of reflection being behind the baffle. It also apparently needs directivity data to extend beyond 90 degrees to to handle a reflection of a precisely 90 degree wave. Here the angle to the reflection point is just under 90 degrees.

The above was captured with a 15 degree ref angle, a movement of the mic towards the front wall.
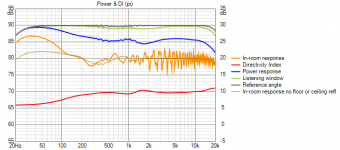
Here is the same picture with only 2 db of wall absorption, which makes it clear absorption is required despite the waveguide.
wall reflections were enabled at -8db. Floor and ceiling were at -2 db. Vituix doesn't show wall reflection nulls on axis but if the reference angle is changed it will. Enabling/disabling the left wall reflection doesn't affect the picture. Vituix can't handle the case of the point of reflection being behind the baffle. It also apparently needs directivity data to extend beyond 90 degrees to to handle a reflection of a precisely 90 degree wave. Here the angle to the reflection point is just under 90 degrees.
The above was captured with a 15 degree ref angle, a movement of the mic towards the front wall.
Here is the same picture with only 2 db of wall absorption, which makes it clear absorption is required despite the waveguide.
Attachments

The vertical is nicely controlled but the Horizontal needs some work in the waveguide. You can't EQ it successfully (because it isn't the same at all angles) which is why your listening window is taking on the same shape.I reran the abec sim to get 96 frequencies at a mesh frequency of 2000 and got smoother curves.
I agree; was waiting to see if it would be worth the effort to work on the waveguide. I got that shape on the 2nd try after optimizing parameters in about 8 runs of a circsym waveguide.
I think a bi-radial style of design like the Arai horns or something similar will work better if the aspect ratio needs to be very different. Aragorus showed an interesting variant in mabat's horn thread.
Acoustic Horn Design – The Easy Way (Ath4)
If yours was morphed to rectangular it might look similar
Acoustic Horn Design – The Easy Way (Ath4)
If yours was morphed to rectangular it might look similar
The vertical is nicely controlled but the Horizontal needs some work in the waveguide. You can't EQ it successfully (because it isn't the same at all angles) which is why your listening window is taking on the same shape.
but that LW drop is only by a db
I cross over to the TC9s at 1500 Hz avoiding most of the narrowing
still its worth fixing if I can find the right formula
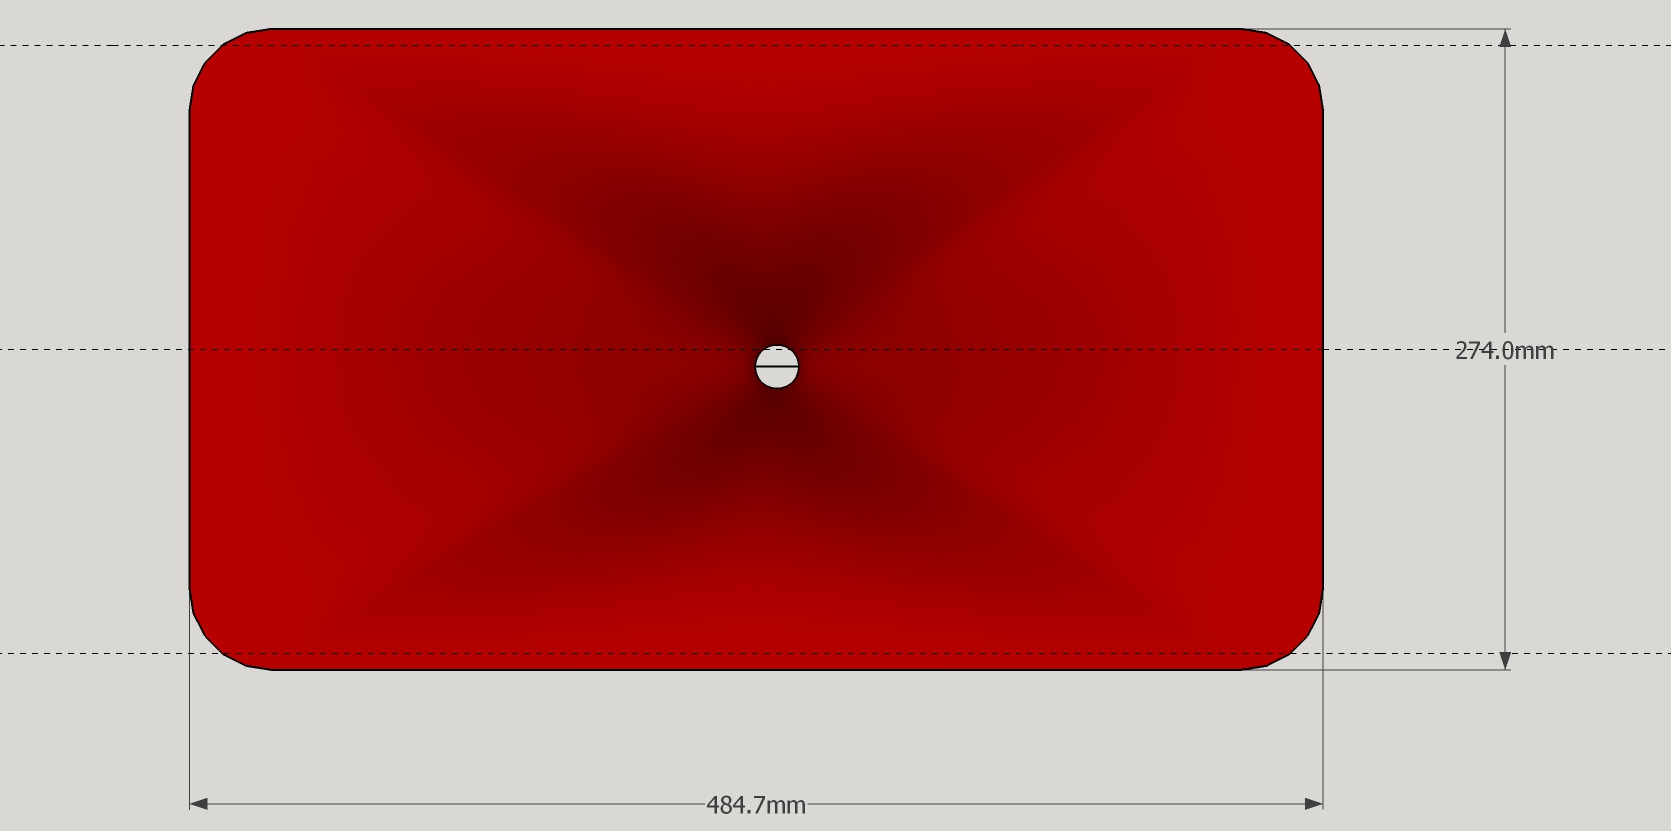
I got a new and better waveguide essentially by asking ATH to morph the shape from elliptical to rectangular. It came out slightly larger but the waistbanding is gone.
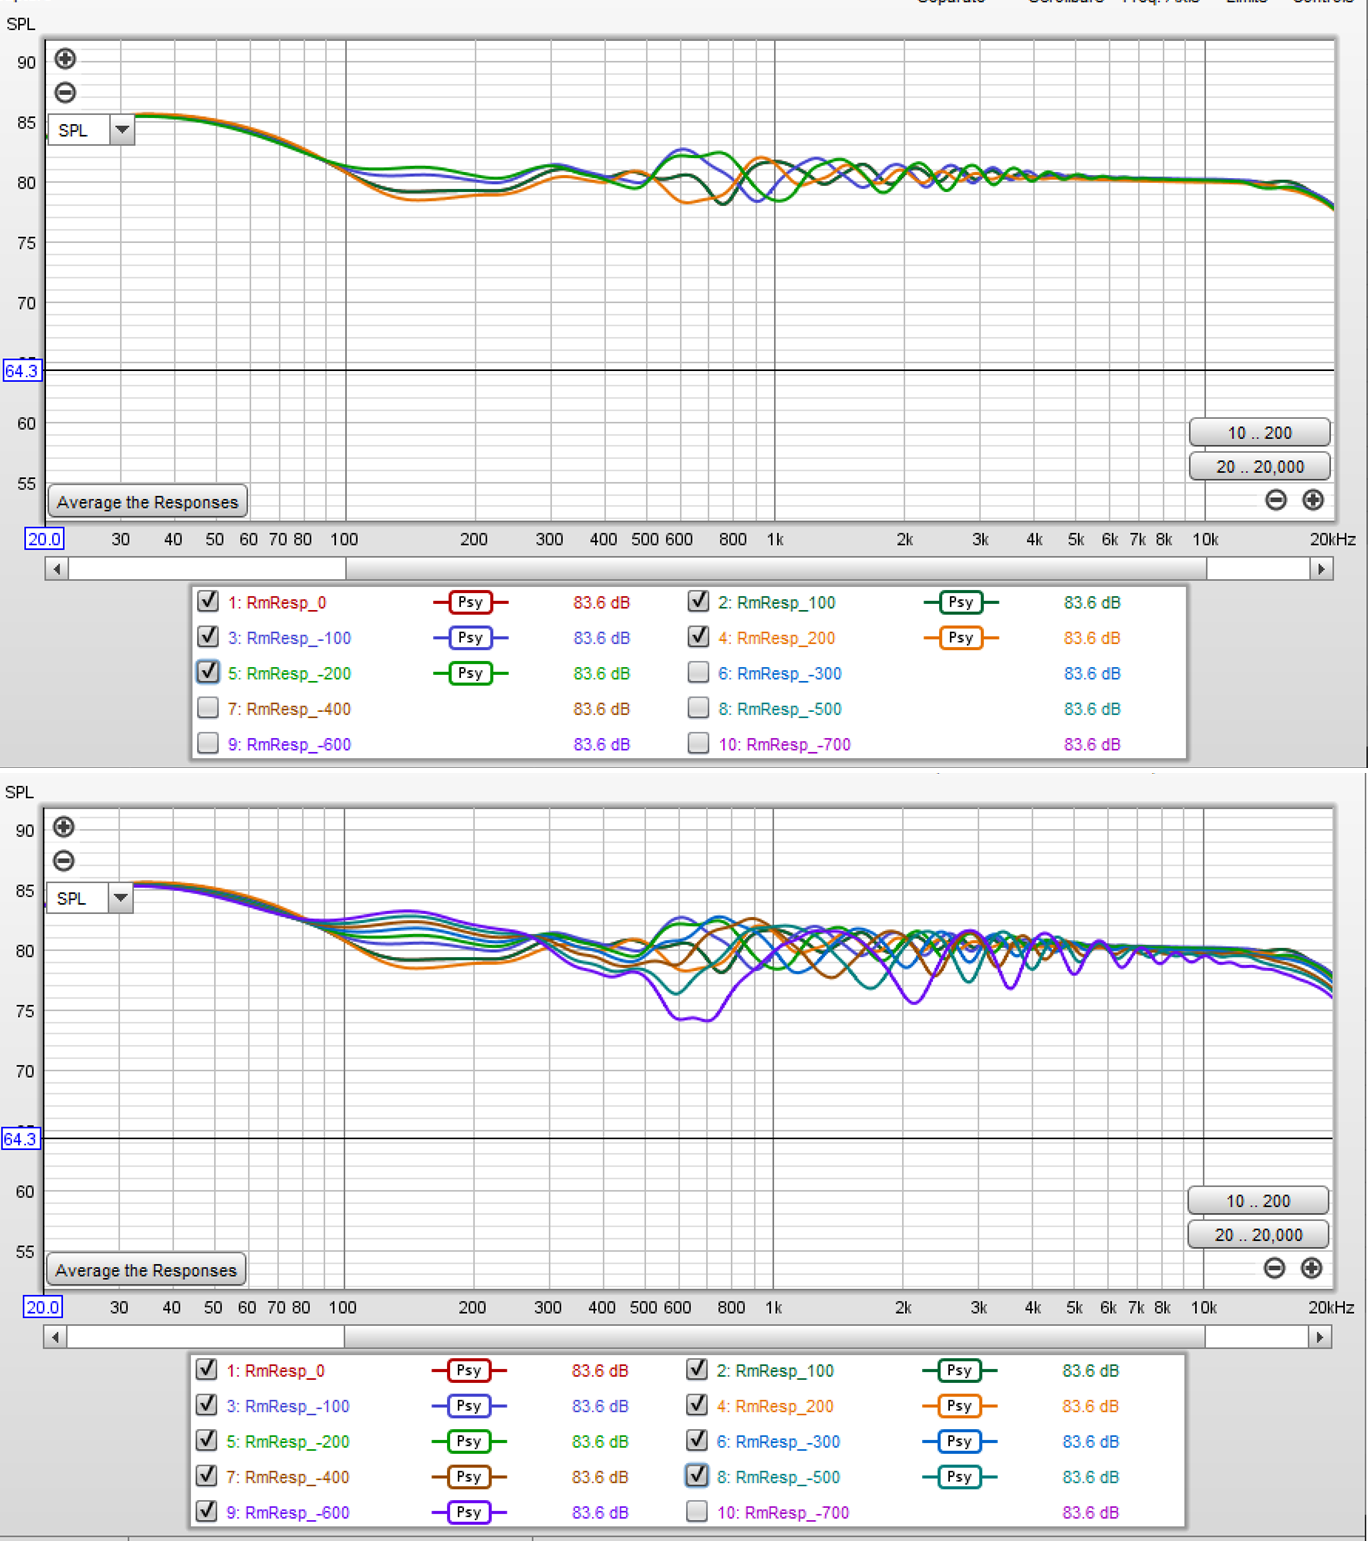
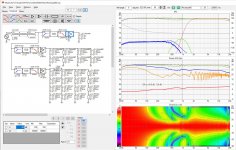
I've incorporated the new waveguide into the Vituix simulation:
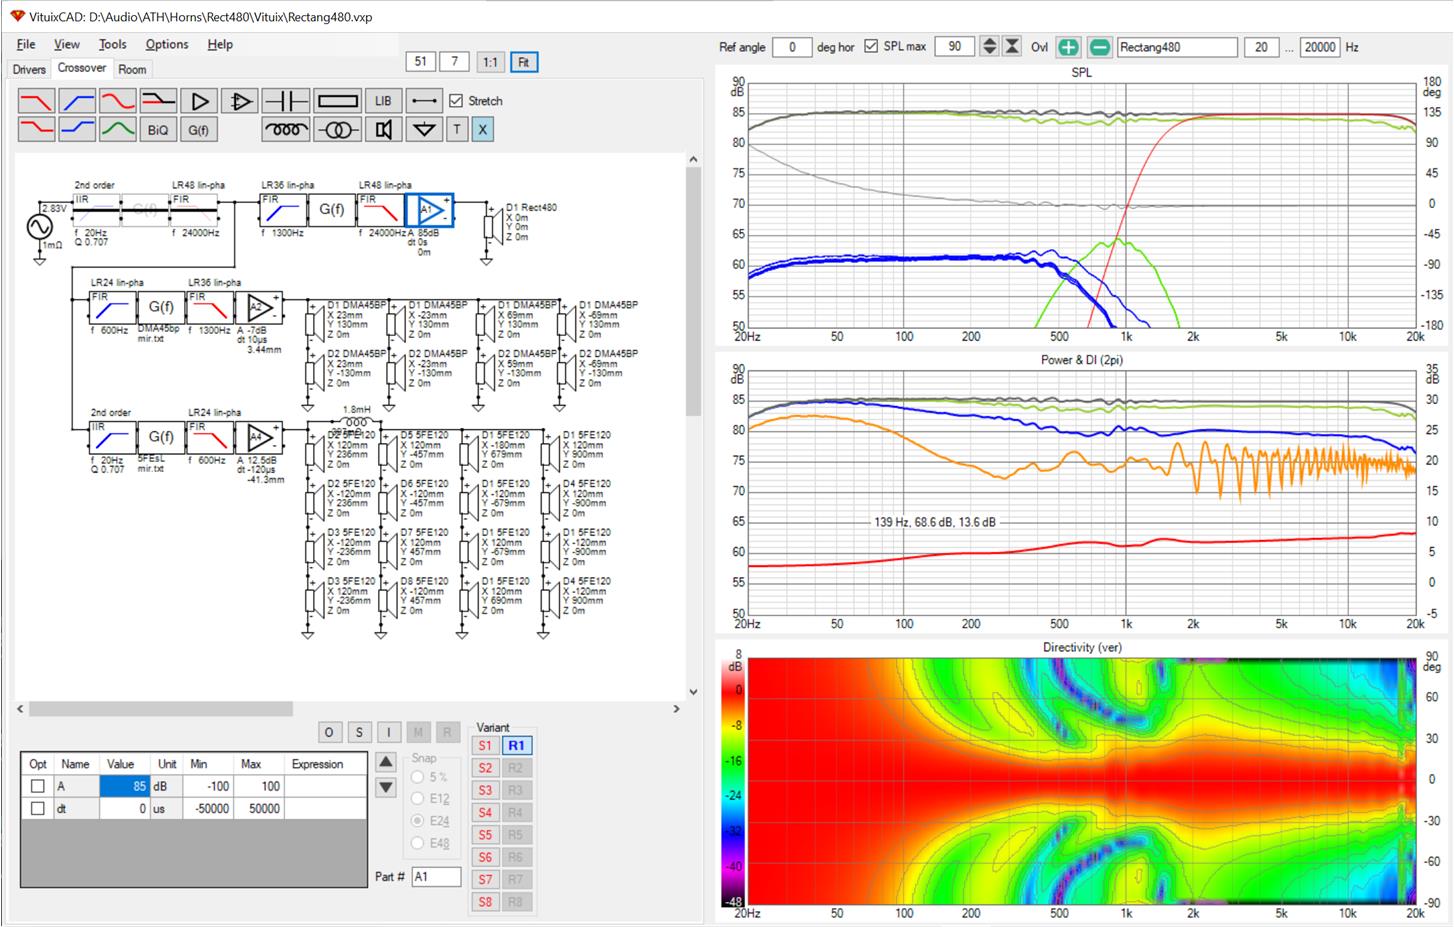
I changed the TC9s to DMA45s since they now need to be just inside the waveguide rim, modelling them with 8mm diameter bandpass ports. The Vituis listening window is set to 20H, 20V. Compared to previous versions, the in-room response remains relatively free of floor effects past 1500 Hz.
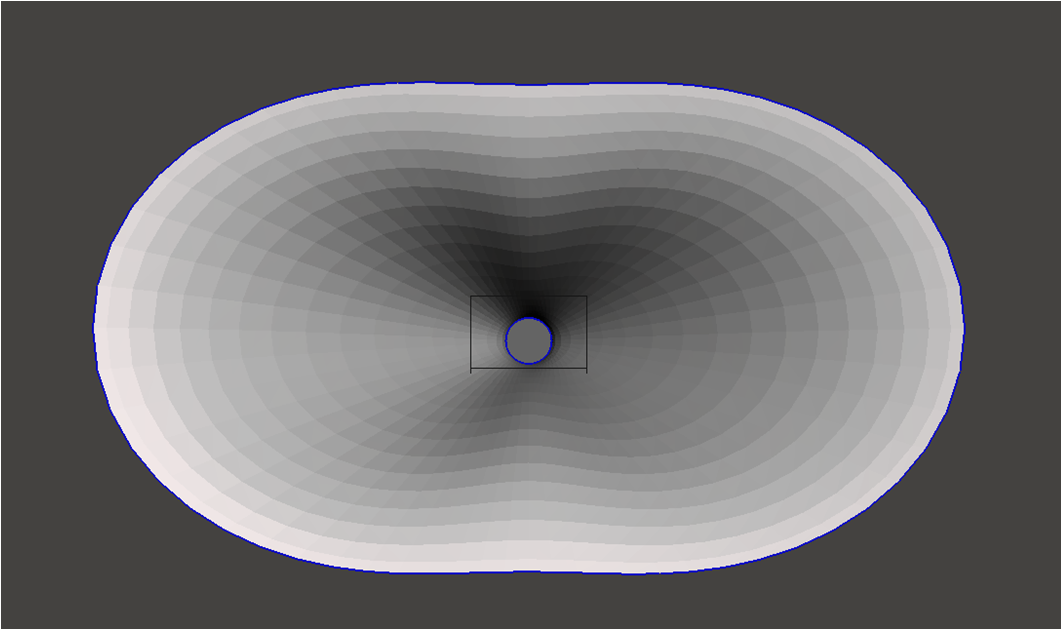
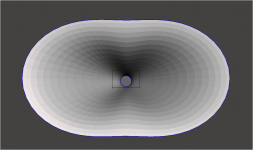
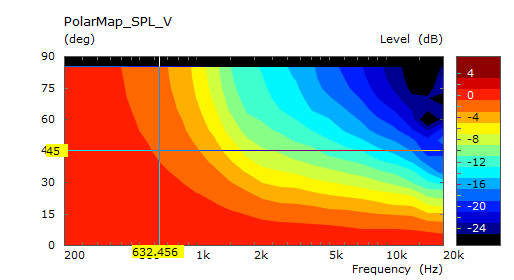
The polar maps deserve a closer look. Below I'm showing the response for waveguide, waveguide+mids, waveguides +mids+woofers to show how they combine
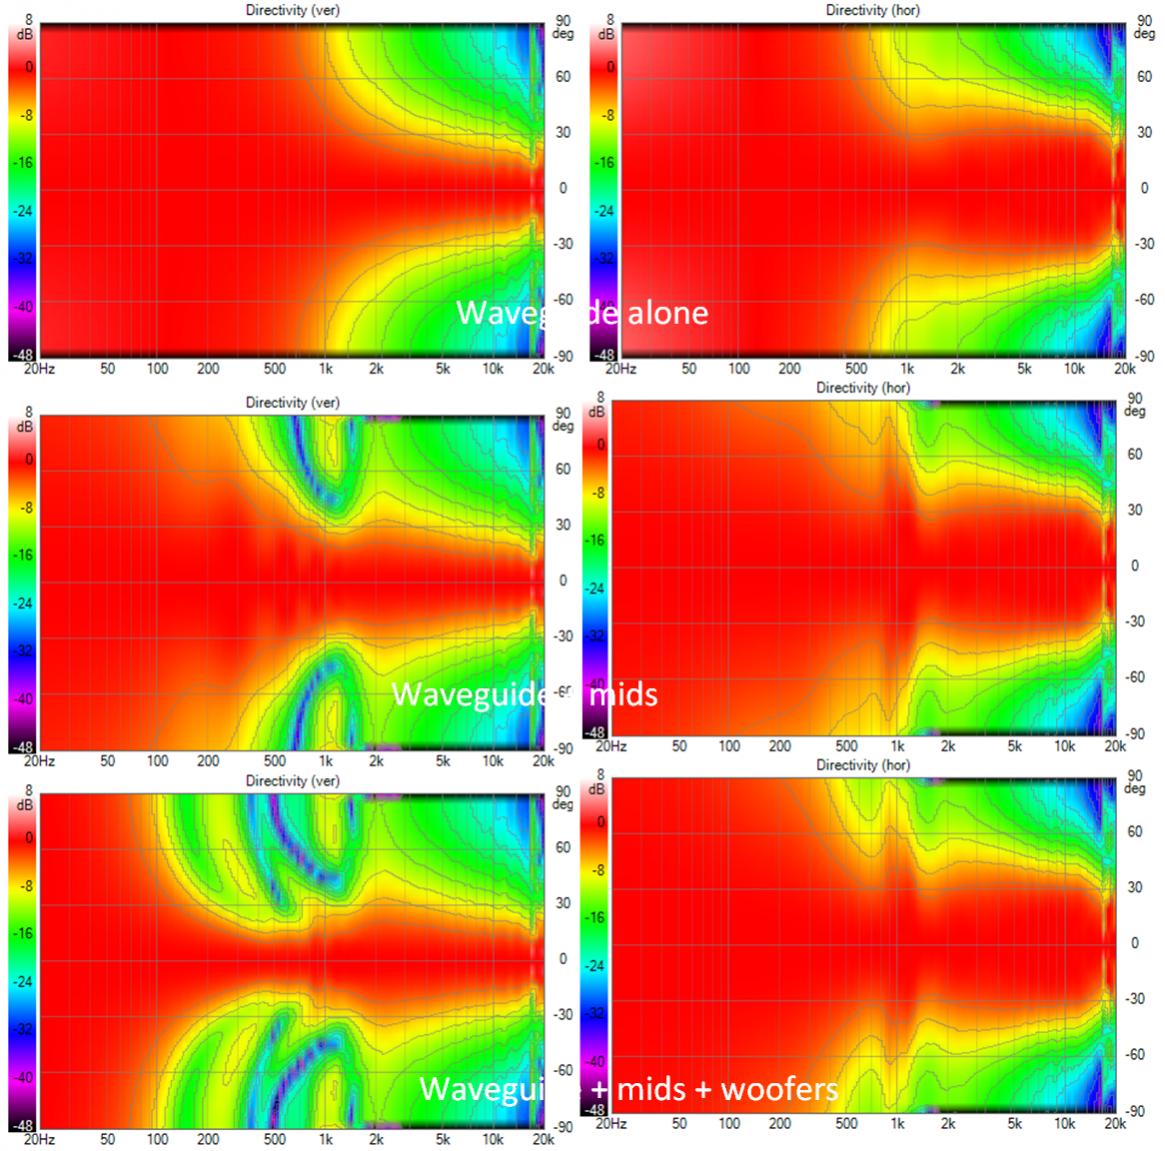
Below XO, the narrowing mids+woofer contend with the widening waveguide. The supporting drivers dominate in the vertical but the waveguide shows defiance in the horizontal. That unfortunate widening in the H is somewhat masked when I switch Vituix option from half-space to corner and I get what appears to be a good response over a +/- 30 degree window. The original pattern target was 80H, 40V; this seems close enough given how I'm going to use it.
But if build the polar maps from the floor up, I see how they might be improved, or at least what is limiting performance.
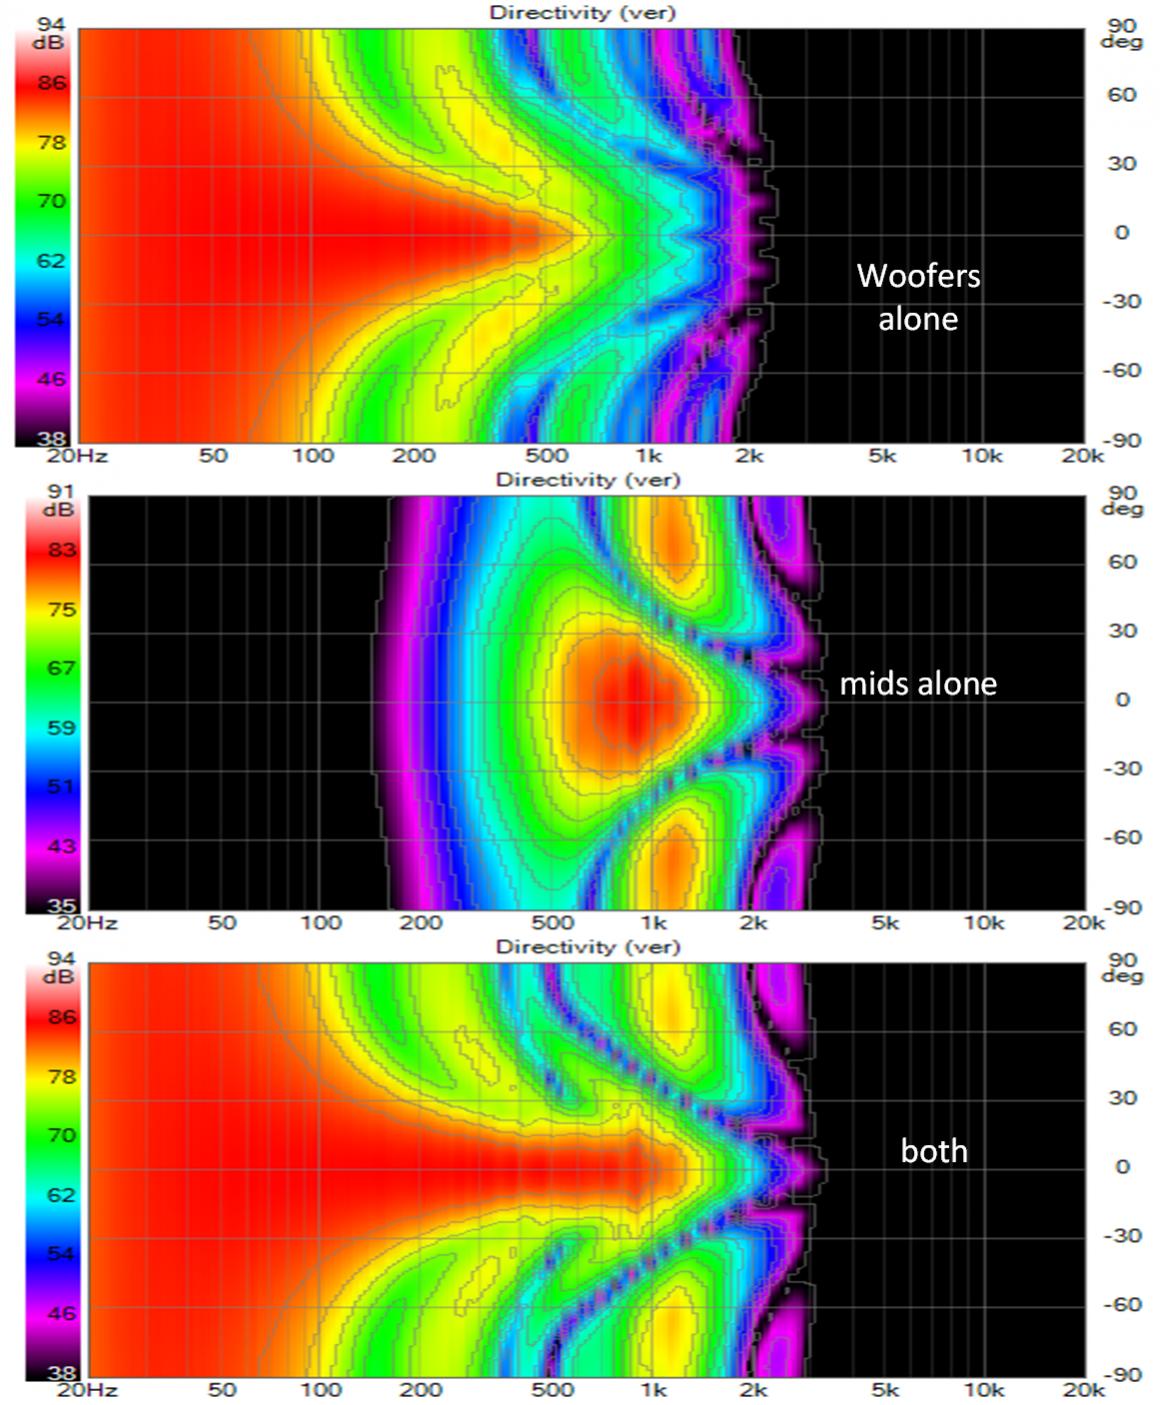
The DMA45 mids have significant sidelobes on the upper edge of their passband. Lowering the XO excludes them but widens the vertical response below XO so that floor reflections increase. Reducing CTC brings them further into the waveguide, which I'd like to avoid for potential disturbance of the HF response and construction difficulties. Nevertheless, reducing CTC seems in order.
I've incorporated the new waveguide into the Vituix simulation:
I changed the TC9s to DMA45s since they now need to be just inside the waveguide rim, modelling them with 8mm diameter bandpass ports. The Vituis listening window is set to 20H, 20V. Compared to previous versions, the in-room response remains relatively free of floor effects past 1500 Hz.
The polar maps deserve a closer look. Below I'm showing the response for waveguide, waveguide+mids, waveguides +mids+woofers to show how they combine
Below XO, the narrowing mids+woofer contend with the widening waveguide. The supporting drivers dominate in the vertical but the waveguide shows defiance in the horizontal. That unfortunate widening in the H is somewhat masked when I switch Vituix option from half-space to corner and I get what appears to be a good response over a +/- 30 degree window. The original pattern target was 80H, 40V; this seems close enough given how I'm going to use it.
But if build the polar maps from the floor up, I see how they might be improved, or at least what is limiting performance.
The DMA45 mids have significant sidelobes on the upper edge of their passband. Lowering the XO excludes them but widens the vertical response below XO so that floor reflections increase. Reducing CTC brings them further into the waveguide, which I'd like to avoid for potential disturbance of the HF response and construction difficulties. Nevertheless, reducing CTC seems in order.
Attachments


I found that reducing the CTC on the mids doesn't help. Instead of side lobes, the main beam is widened, filling in the null between the former side lobes. This actually makes things worse.
Given that a reduced CTC didn't help, I speculated that a larger CTC wouldn't hurt and found that to be the case. I was able to move the DMA45 ports just outside the waveguide edge as 6mm x 34 mm slots.
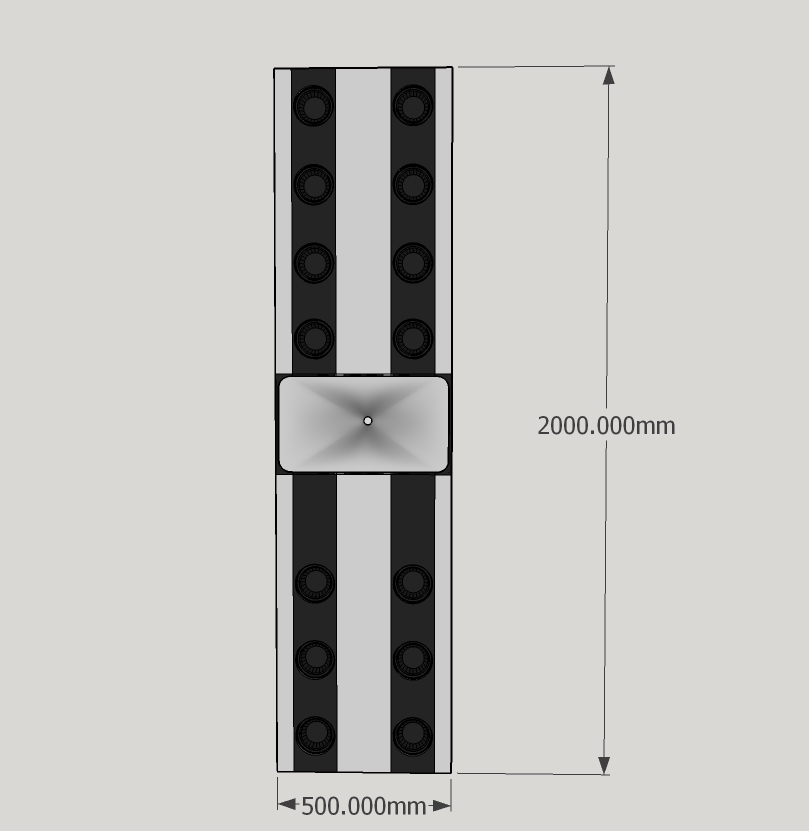
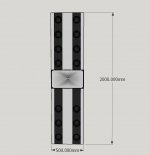
The mid slots hide in that black band surrounding the waveguide. The 5FE120s hide in the vertical bands. Those black bands do emphasize the height. I'm not yet sure if that is good or bad aesthetically. I think aesthetics are a challenge so its good I plan to hide these in corners. It would likely hide best with a wall covered grill cloth over the whole thing...
I managed to get a modicum of passive shading to work. By varying an inductor that low passes the feed to all except the innermost 5FE120s, I can control the vertical window width in the 500 Hz to 1 khz region to some extent. You can see the improvement in the vertical line charts
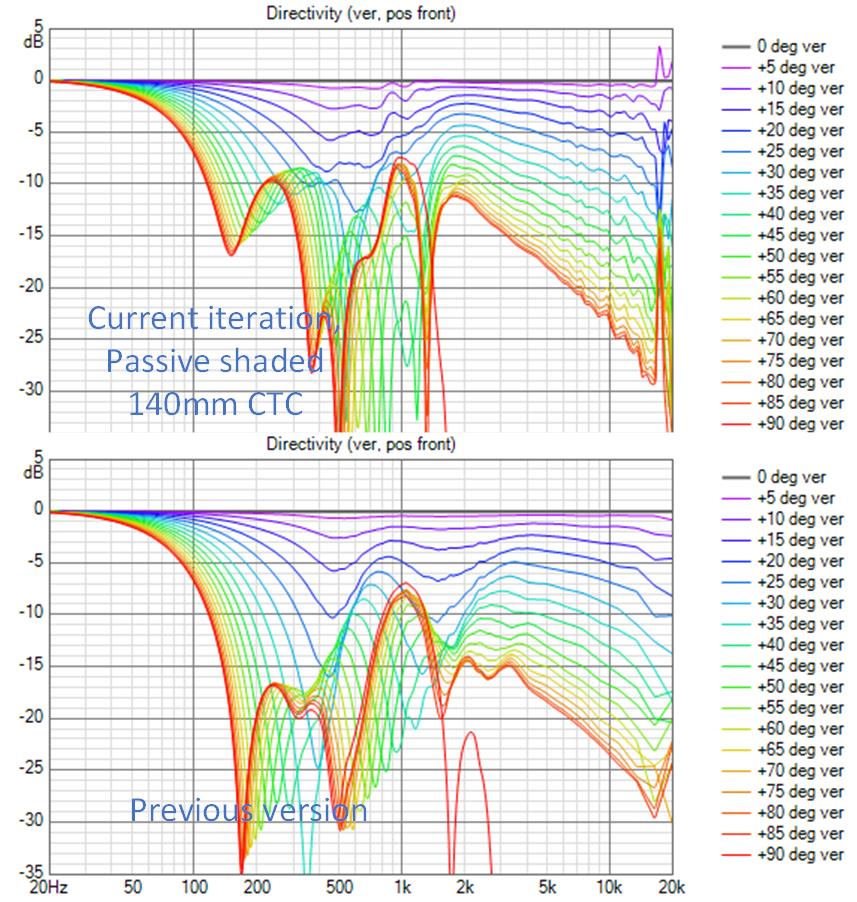
As I look at it, I see its improved below 1 khz and not quite as good above. The newer line chart shows what I have regarded as an ABEC simulation problem - the peaking circa 18 khz. What bothers me that this doesn't go away with higher simulation resolution. I simulated with MeshFrequency=16000 and it didn't go away.
This change didn't result in a huge improvement in vertical response variation but I think it reduced the worst case seated by perhaps .5 db and the standing a bit more

The mid slots hide in that black band surrounding the waveguide. The 5FE120s hide in the vertical bands. Those black bands do emphasize the height. I'm not yet sure if that is good or bad aesthetically. I think aesthetics are a challenge so its good I plan to hide these in corners. It would likely hide best with a wall covered grill cloth over the whole thing...
I managed to get a modicum of passive shading to work. By varying an inductor that low passes the feed to all except the innermost 5FE120s, I can control the vertical window width in the 500 Hz to 1 khz region to some extent. You can see the improvement in the vertical line charts
As I look at it, I see its improved below 1 khz and not quite as good above. The newer line chart shows what I have regarded as an ABEC simulation problem - the peaking circa 18 khz. What bothers me that this doesn't go away with higher simulation resolution. I simulated with MeshFrequency=16000 and it didn't go away.
This change didn't result in a huge improvement in vertical response variation but I think it reduced the worst case seated by perhaps .5 db and the standing a bit more
Attachments
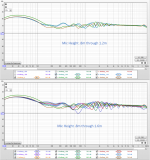
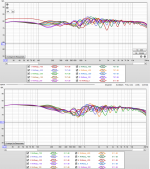
What else is left to do? Well before doing that, let's look at results of an N-way approach with separate amps and filters for each pair of rows of 5FE120s, except for the outer most two rows that share an amp.

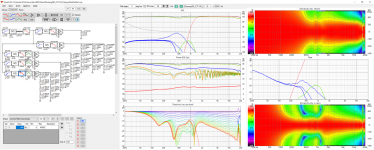
The approach I took to shading the 5FE array was first to step down the low pass cut off frequency for paired rows as they moved away from center. Then I added a PEQ in each row to pull up the off axis dip at 450 Hz that can be seen in previous versions. This drastically improves the vertical line chart, compared to previous versions shown a post or two ago. The room response overlays in the middle graph are for offsets of +/-200 mm from array center. The deviation is just a hair over +/-1.6 db below 1500 Hz, which is about .4 db better than the previous version - an expensive fraction of a db but these are also the smoothest power response and DI curves I've had.
The approach I took to shading the 5FE array was first to step down the low pass cut off frequency for paired rows as they moved away from center. Then I added a PEQ in each row to pull up the off axis dip at 450 Hz that can be seen in previous versions. This drastically improves the vertical line chart, compared to previous versions shown a post or two ago. The room response overlays in the middle graph are for offsets of +/-200 mm from array center. The deviation is just a hair over +/-1.6 db below 1500 Hz, which is about .4 db better than the previous version - an expensive fraction of a db but these are also the smoothest power response and DI curves I've had.
Attachments
Are you getting serious about something like this? I do wonder if you couldn't do some of it passively to simplify it, less amplifiers needed.
The performance is becoming compelling - line array like vertical directivity, single 1" driver top end, and controlled directivity - but whenever I seriously contemplate building it I go back to my weight estimate that currently stands at 140 lbs, 80 of which are plywood. At this stage in my life, that would be difficult for me to handle; the younger me would have had no trouble with it. I guess what I need to do is look into lightweight plywood alternatives 🙂. At least its only 2m tall, not full floor to ceiling.
Passive would be a compromise but, per prior iterations would likely get within a db for seated listening. The active shading is for >=10 degrees off axis. If you zoom in to the filter curves, you will see that shading filters that yield the superb vertical control 200 Hz to 1 khz have sharper slopes than would be practical passively.
This system with multiple subs can be done with 3 4-channel amplifiers. 4 channels of Puriifi are available from VTV Amplifiers for $1700, 4 channels of Hypex or Pascal for only $950. If you don't like class D, consider DIY based on Neurochrome Modulus-186. I already have the amps and DAC and a PC to dedicate so that isn't an impediment for me.
140 lbs, that's about 63.5 Kg right? lol
My arrays are about ~75 Kg each. No fun moving them from living room to garage or back, but usually they would just stand tall and proud in one place. 😀
My arrays are about ~75 Kg each. No fun moving them from living room to garage or back, but usually they would just stand tall and proud in one place. 😀
- Home
- Loudspeakers
- Full Range
- Full range line array for wall or corner placement