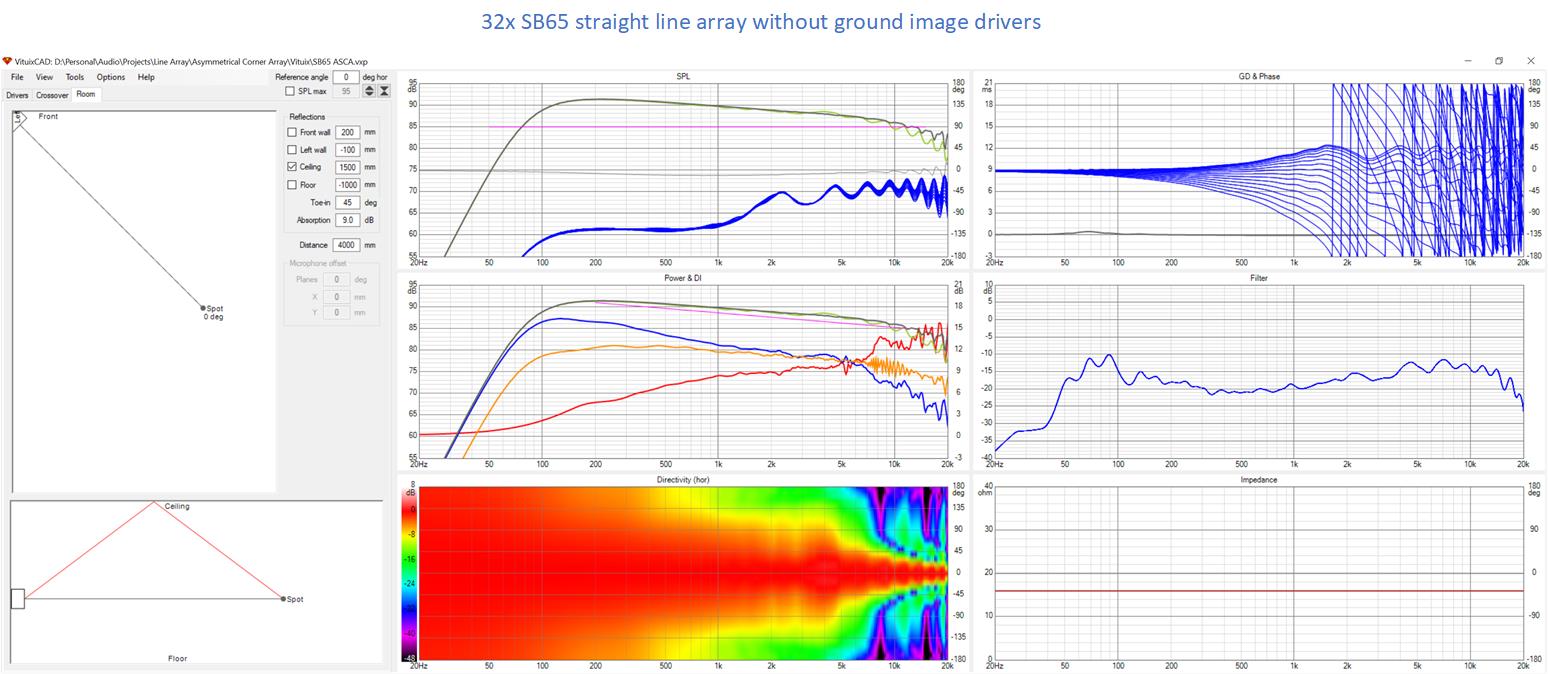
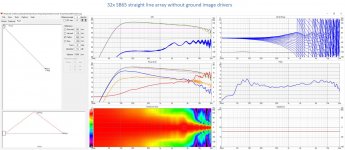
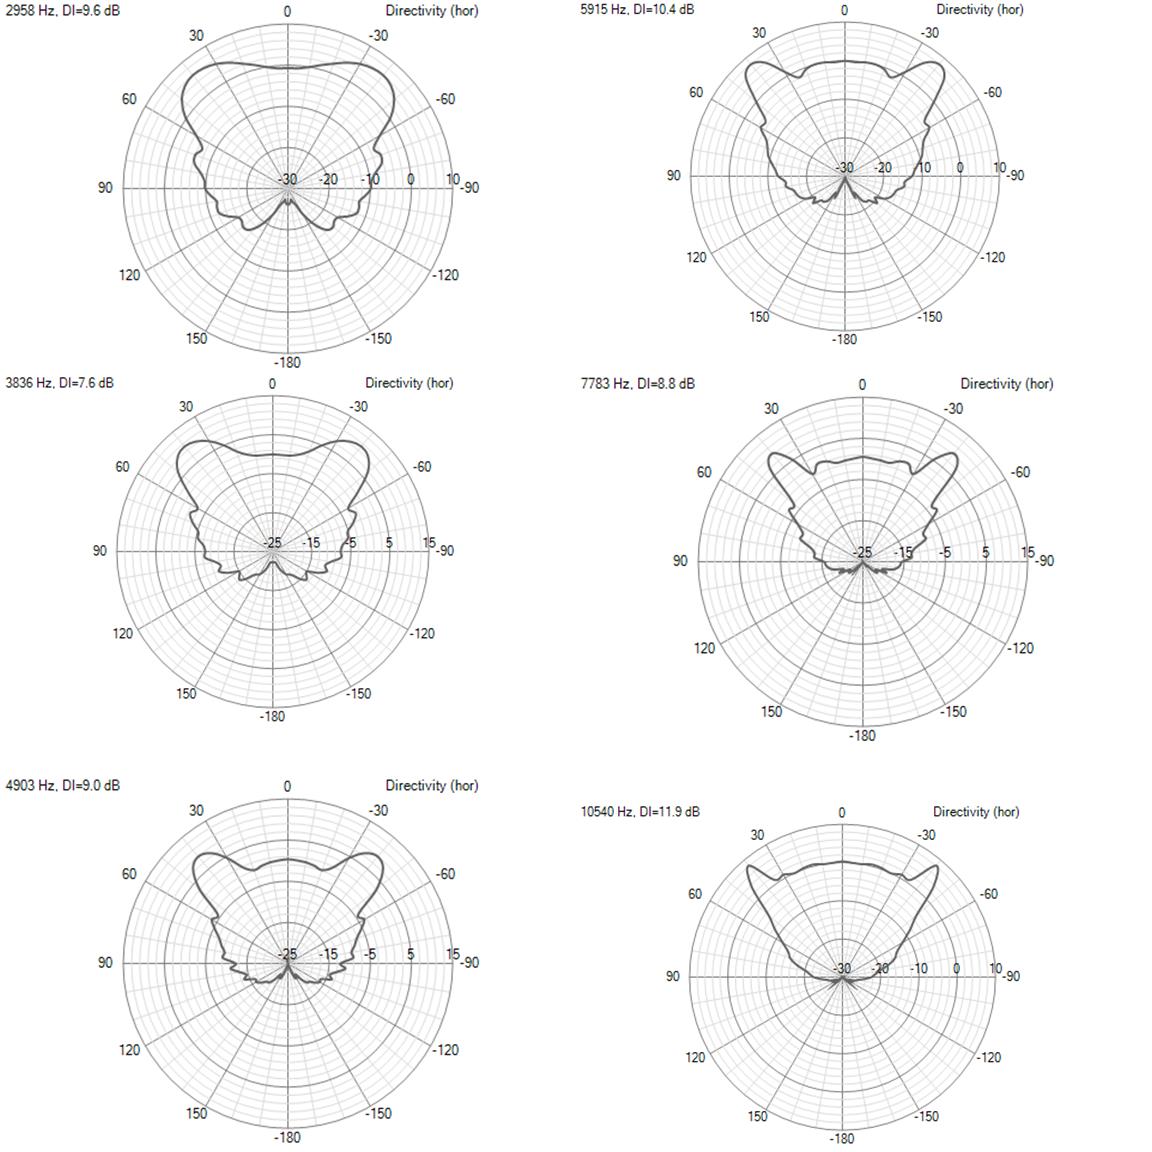
This morning I've got a DMA45 CBT simulation to show off
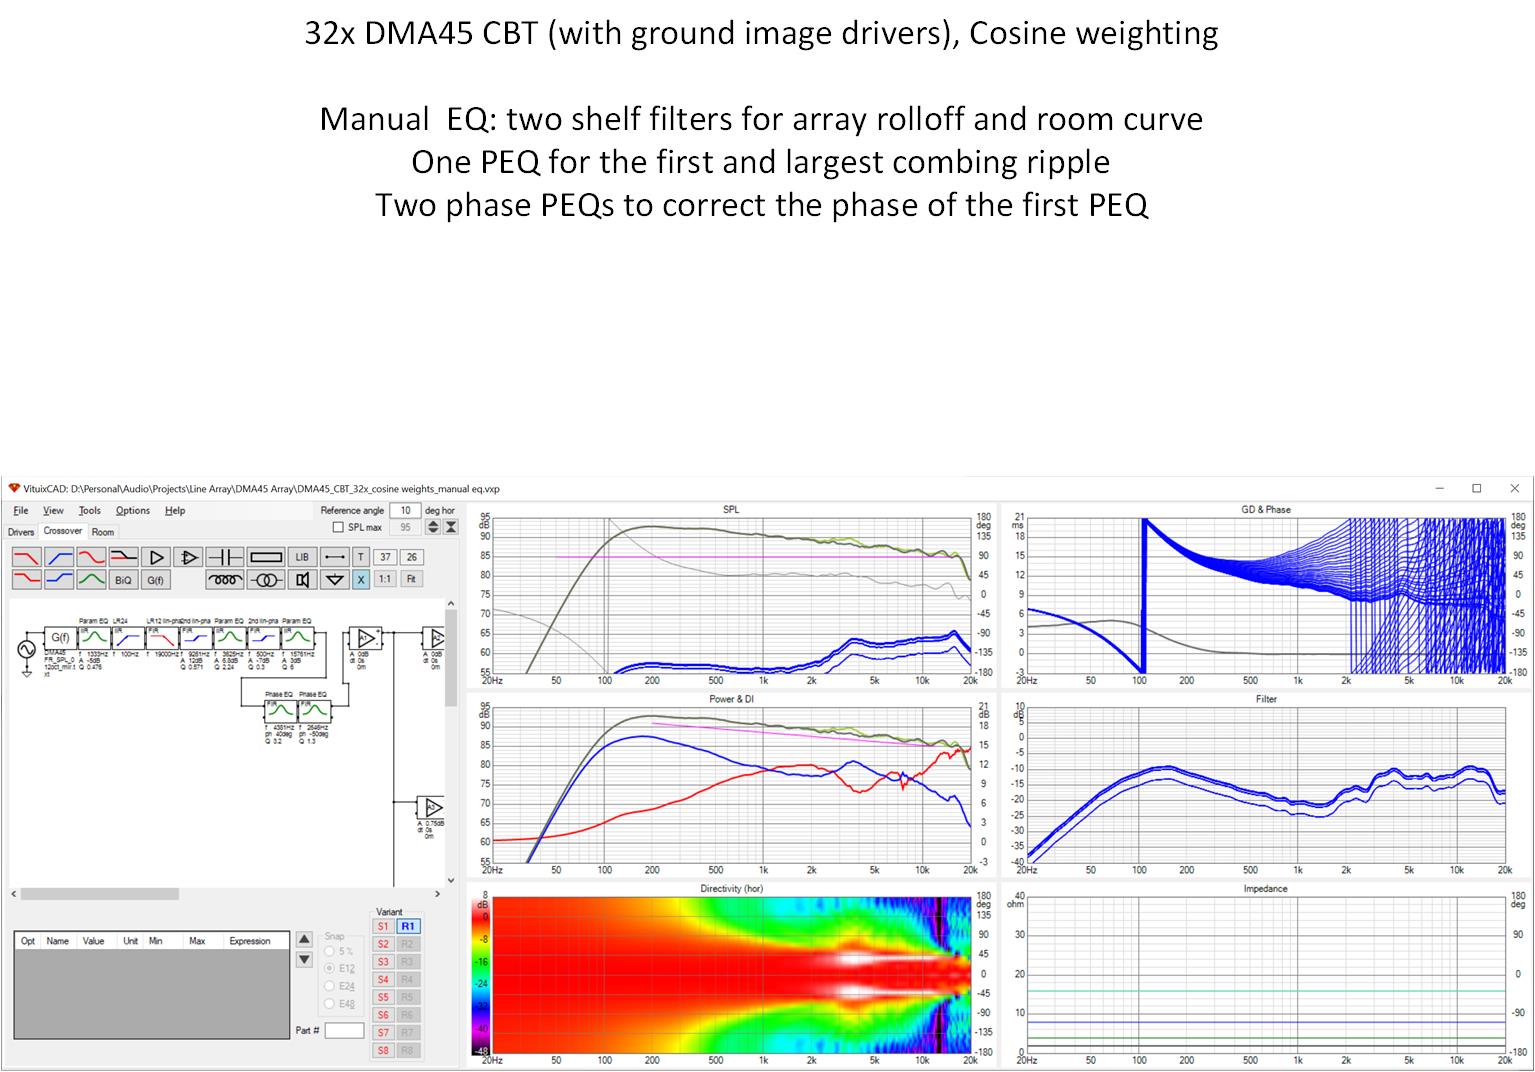
I manually EQed for the array rolloff and combing ripple to give myself more control. I just flattened the first such ripple, which except in the area of that correction left the listening window very close to the axial response but still had that concerning peak in the power response.
However, I'm beginning to be convinced that its a computational/simulation artifact and not a real thing. For one the white bars in the polar map are just to straight. For another, the size of the peak depends on how the power response is calculated. Vituix has two options, with on a cylindrical surface intuitively seeming more appropriate for line arrays:
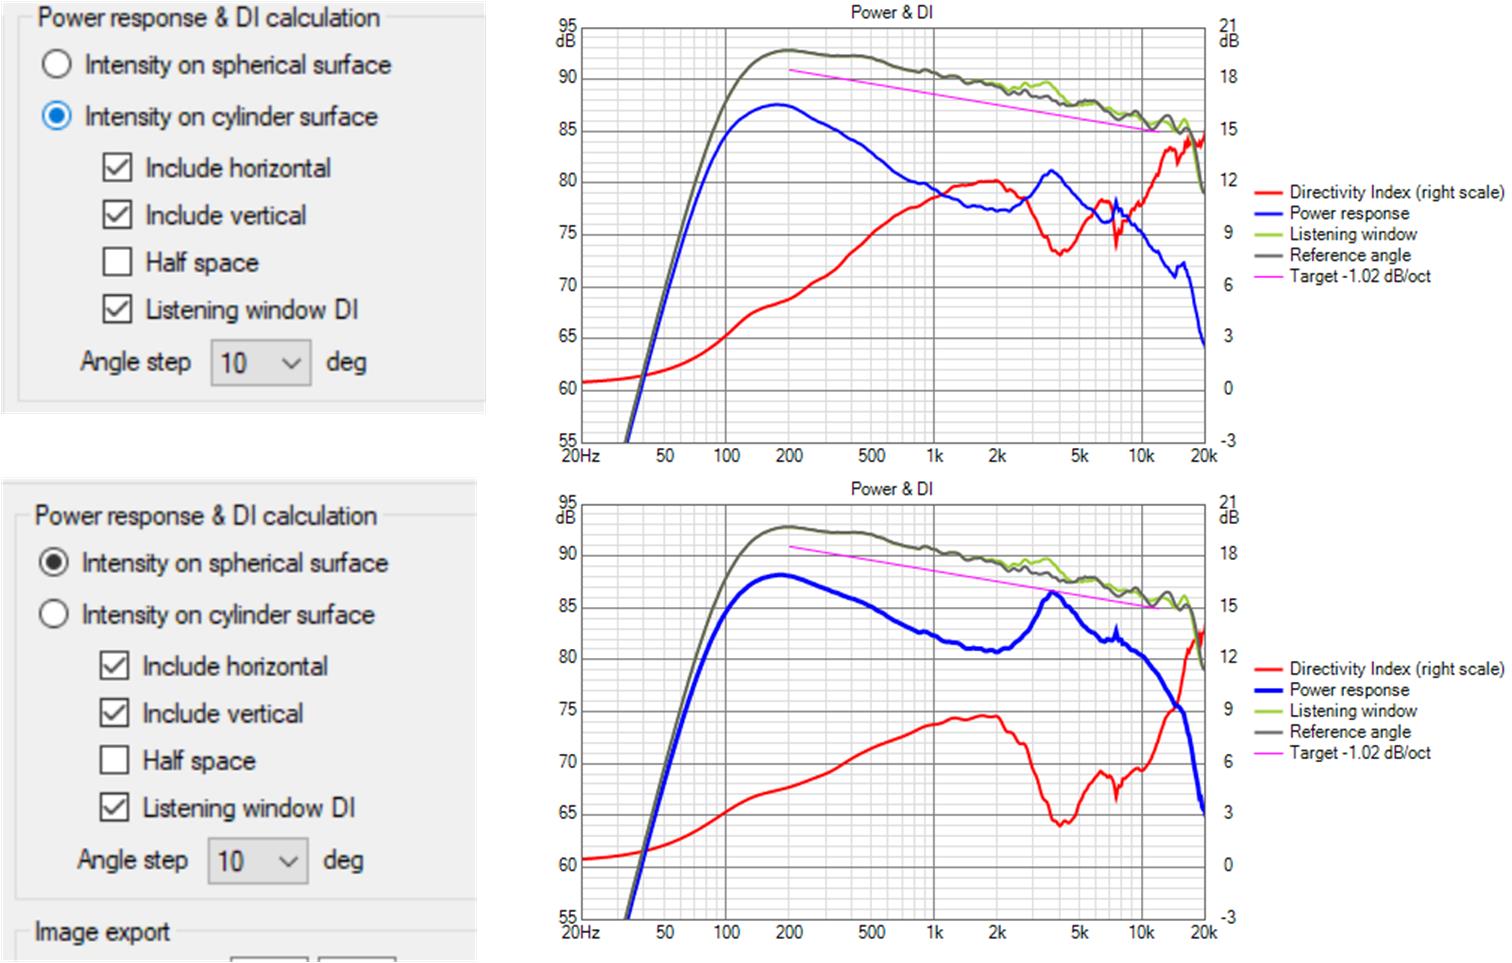
The responses also change not dramatically but still significantly with angle step options. I'm assuming 5 degrees is most accurate but keep in mind that my directivity data is somewhat artificial - its been extrapolated from a measured (by Dayton) axial response based on piston size and baffle width.
Finally, there is no sign of the Vituix H Polar Map blooming in Don Keele's CBT directivity balloons for a similar CBT:

I manually EQed for the array rolloff and combing ripple to give myself more control. I just flattened the first such ripple, which except in the area of that correction left the listening window very close to the axial response but still had that concerning peak in the power response.
However, I'm beginning to be convinced that its a computational/simulation artifact and not a real thing. For one the white bars in the polar map are just to straight. For another, the size of the peak depends on how the power response is calculated. Vituix has two options, with on a cylindrical surface intuitively seeming more appropriate for line arrays:
The responses also change not dramatically but still significantly with angle step options. I'm assuming 5 degrees is most accurate but keep in mind that my directivity data is somewhat artificial - its been extrapolated from a measured (by Dayton) axial response based on piston size and baffle width.
Finally, there is no sign of the Vituix H Polar Map blooming in Don Keele's CBT directivity balloons for a similar CBT:
Attachments

Last edited:
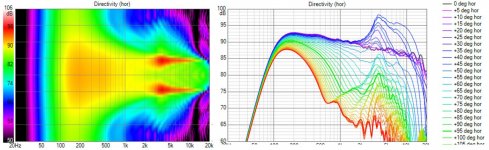
In the polar map the response seems to hold intensity strongly and drop off a cliff too quickly.
There should be more of a spread between the red and green colours in reality.
There should be more of a spread between the red and green colours in reality.
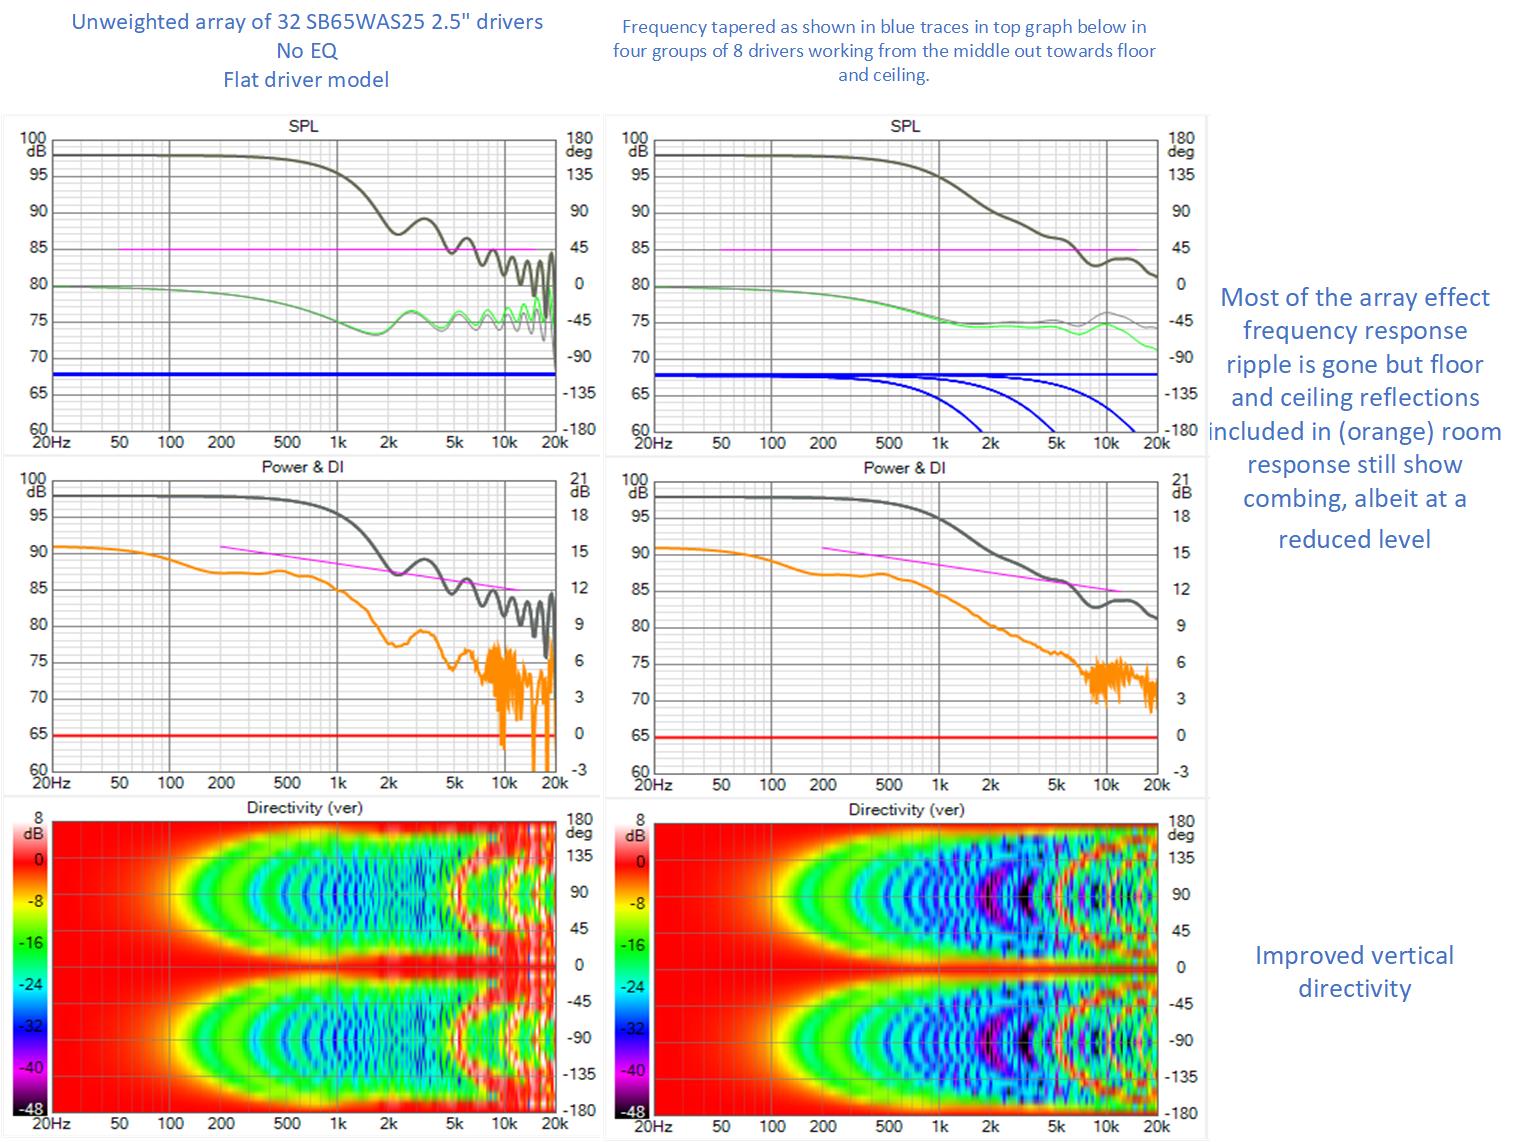
I went back to my straight line array simulation again and recalled something from my simulations during the initial design. I initially put those drivers in to see how far down it extended the vertical directivity. But with those image drivers in the HF reflections from those more distant drivers cause that severe combing shown in my post a few days ago.Without them the picture is more like one might expect in real life, smoothed and absent room effects.
The point from this is that while floor and ceiling reflections help the bass response and vertical directivity, they are not friendly to the HF response and we might be well served by carpets and ceiling tiles or diffusers in our listening rooms.
The equalization here is two stages of inversion like before with the 2nd stage being a placeholder for DRC in the physical world.
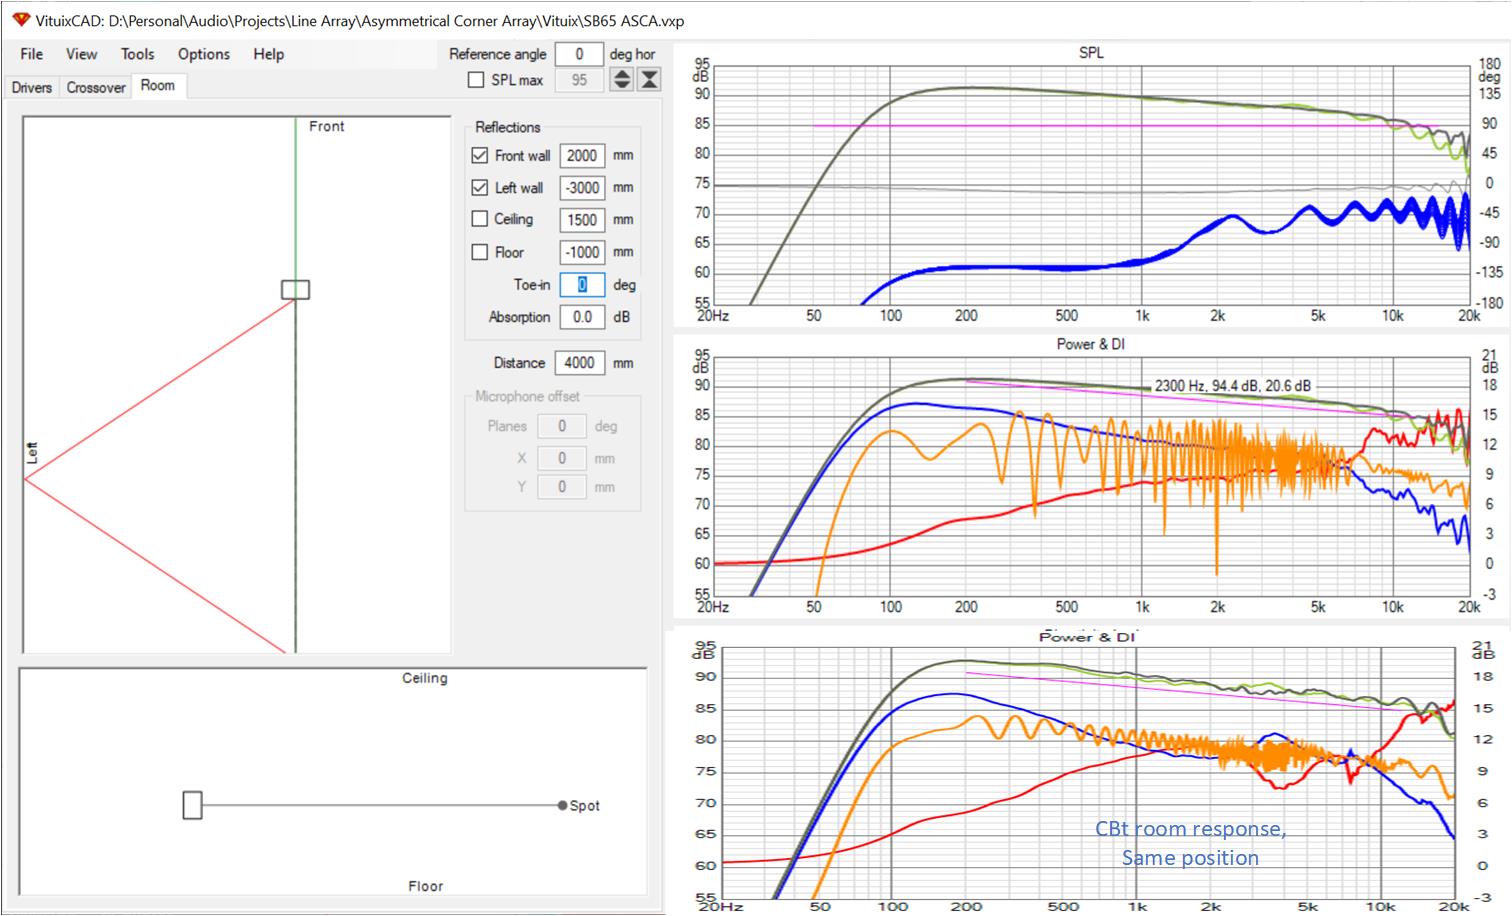
Recall the orange trace in the middle graph is the room response. This screenshot was taken with only the ceiling reflection included and that reflection causes the 7-12 kHz ripple.
More coming on the room response in next post
The point from this is that while floor and ceiling reflections help the bass response and vertical directivity, they are not friendly to the HF response and we might be well served by carpets and ceiling tiles or diffusers in our listening rooms.
The equalization here is two stages of inversion like before with the 2nd stage being a placeholder for DRC in the physical world.
Recall the orange trace in the middle graph is the room response. This screenshot was taken with only the ceiling reflection included and that reflection causes the 7-12 kHz ripple.
More coming on the room response in next post
Attachments
More on room responses
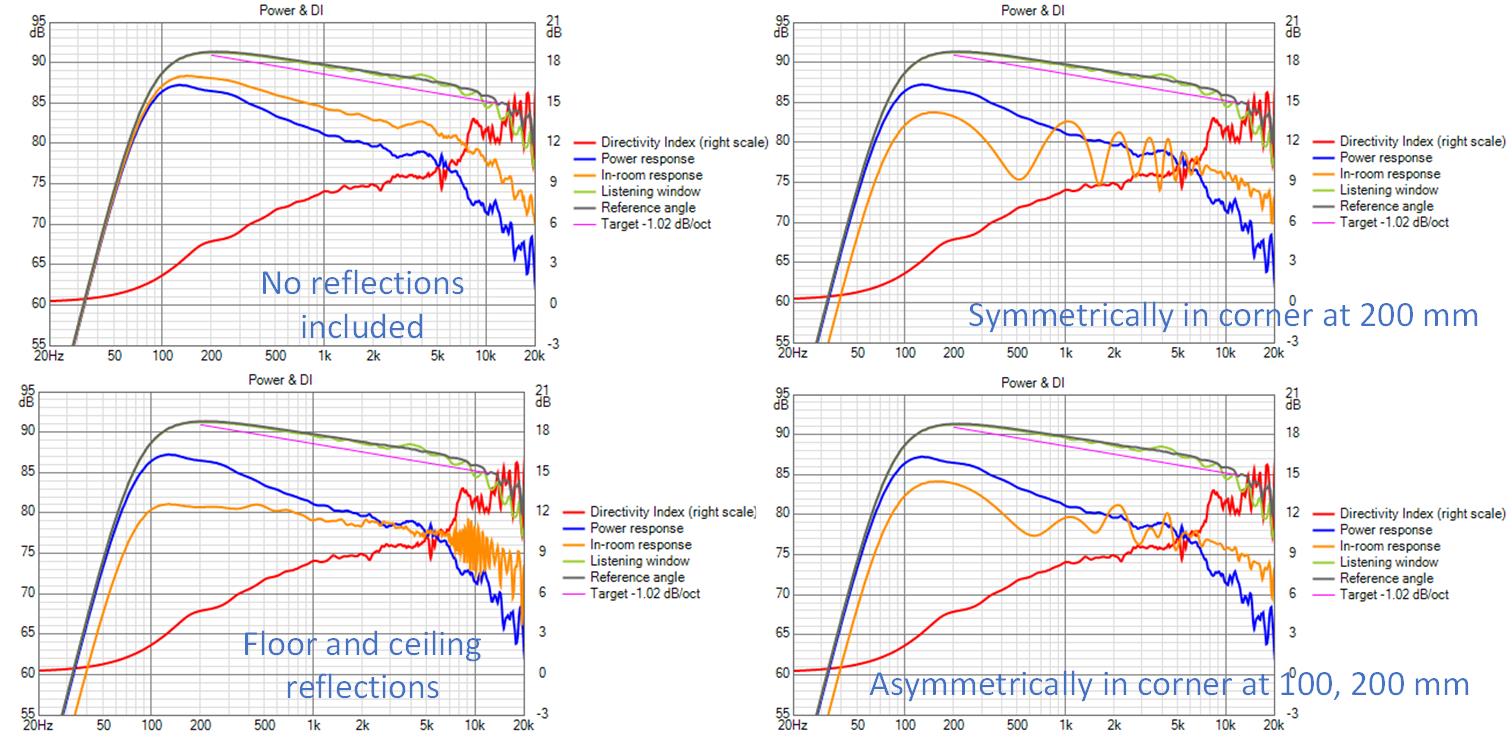
On the left side, I'm showing room response with and without floor and ceiling reflections. Note what happens in the top octave and a half but also notice how the low end response flattens out at a lower SPL level. I don't really understand why.
On the right hand side, I'm showing the much reduced boundary interference with an asymmetrical driver placement in a corner line array and the reason I called my design ASCA for Asymmetrical Corner Array.
All reflections are included in the room responses below. I see an expected bass hump due to the corner support but just eyeballing it I don't think equalization of the upper part of that support will hold over a full +/- 10 degree listening window as the dips above the hump move with positon However, treating for nulls above 500 Hz is much easier than for 200 hz.
Attachments
When I compare CBT vs Floor to Ceiling straight line array in corner position, I see its an easy win for the straight line array because it can be fit more tightly into the corner and therefore needs less absorption
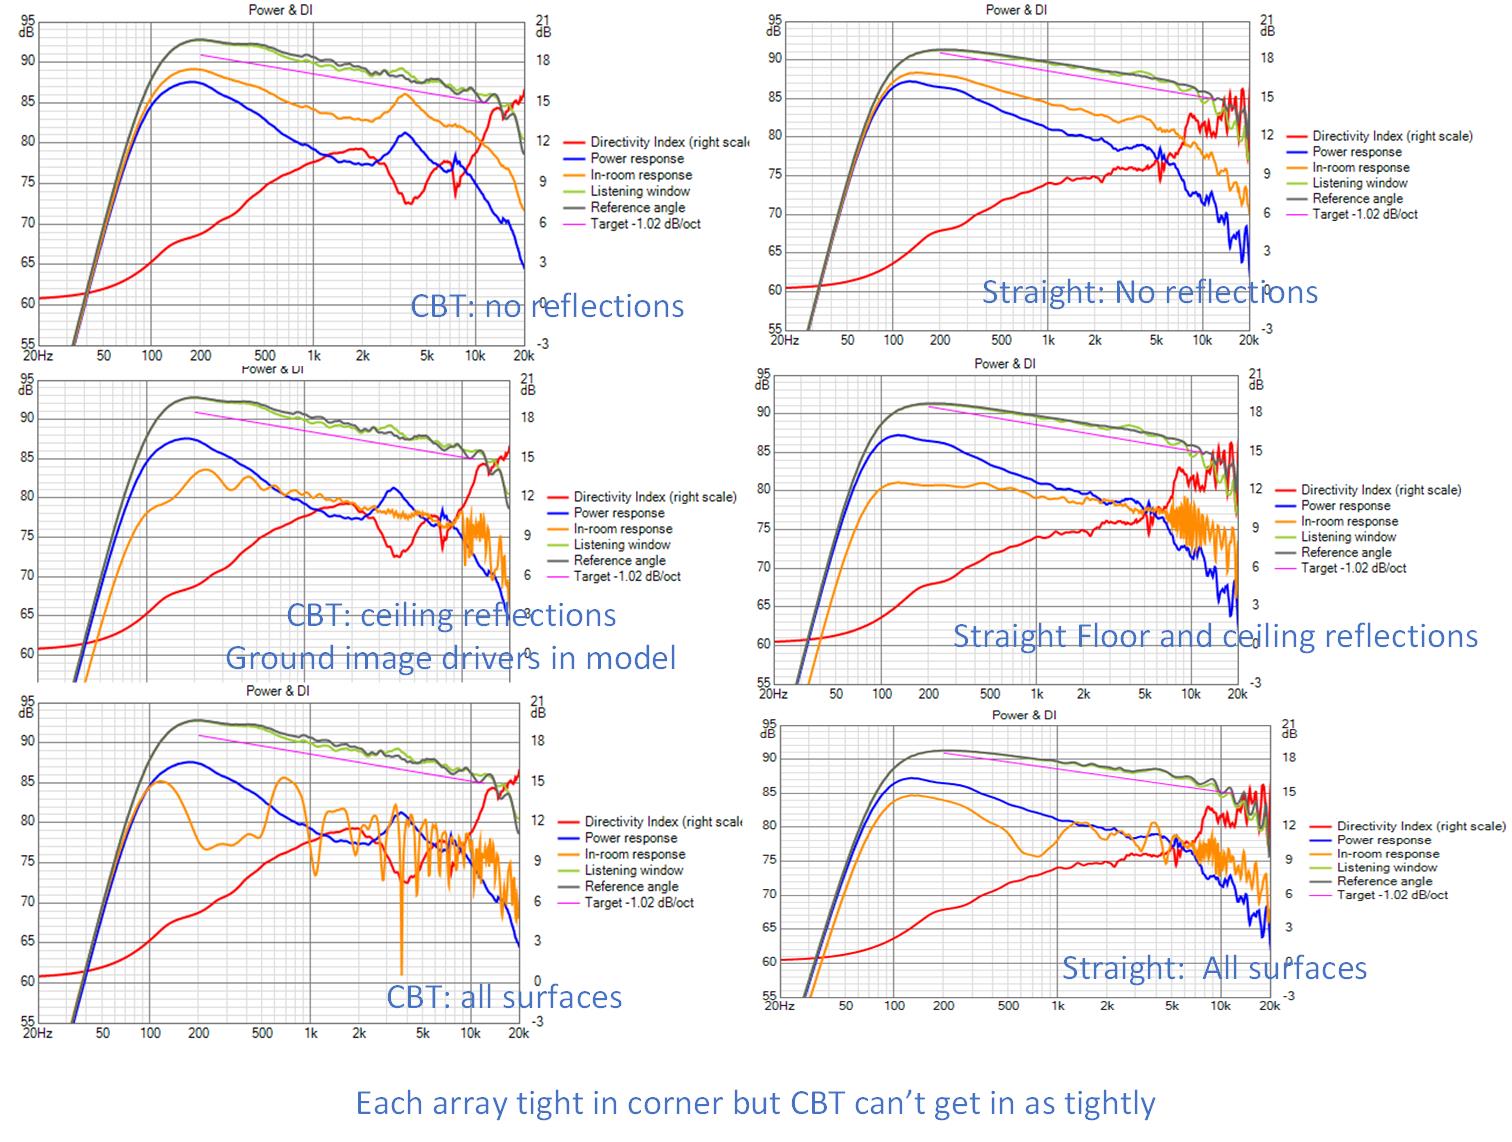
but when the arrays are pulled well out into the room, its a different story:
but when the arrays are pulled well out into the room, its a different story:
Attachments
Yet another view of the CBT's horizontal pattern showing that what looks like blooming in the polar map are horizonal side lobes. I still don't know if they are real or even if real that they will color reflected sound that finds its way back to the LP
Attachments
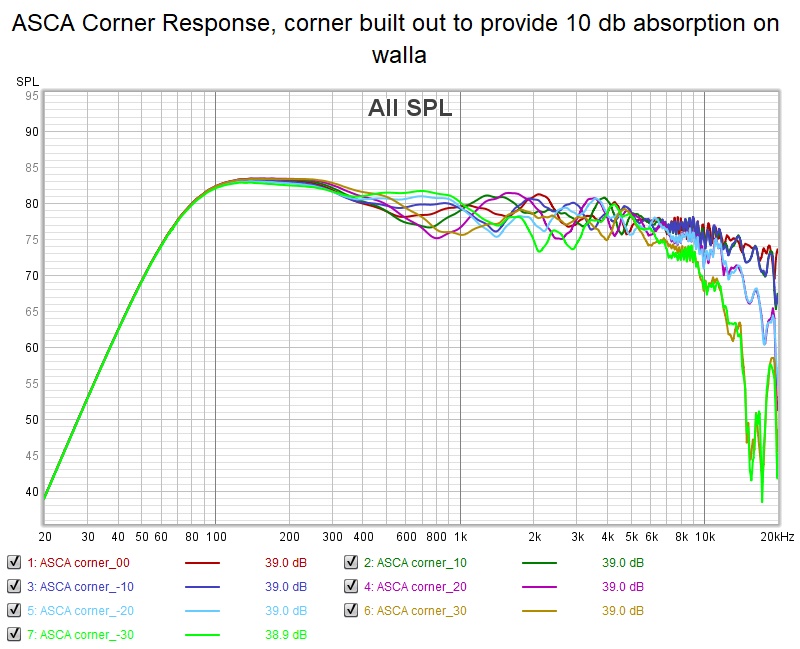
Back to the straight array, ASCA, the one I actually built. All this analyis confirms for that my situation a straight line array flanked by absorber panels will give me the best in room response.
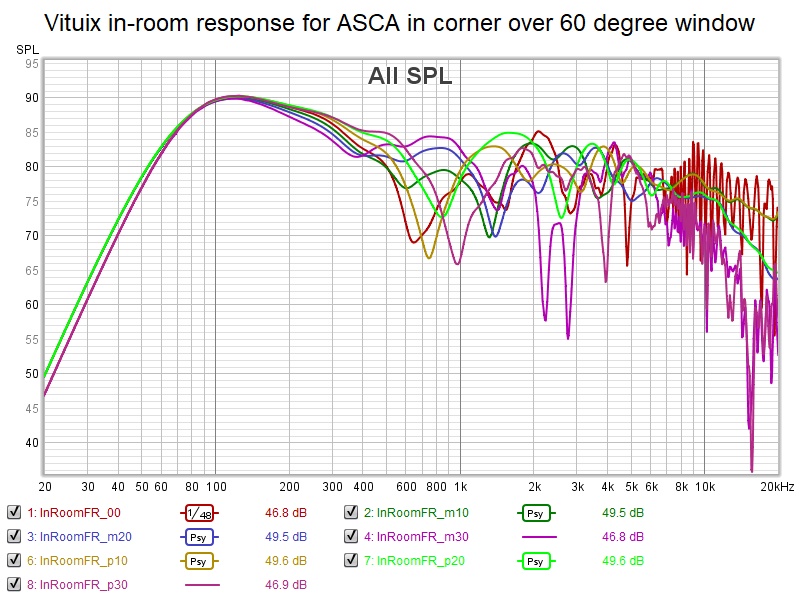
I imported Vituix calculated in room responses across my presumed +/-10 degree listening window for ASCA tight in a corner and 6db absorpton. 2" of rockwool will provide at least 6 db absorption at the first null increasing to 10 db at 1.5 khz or so and above.
Note these FRs are psycho-acoustic smoothed; REW won't FDW an imported FR.
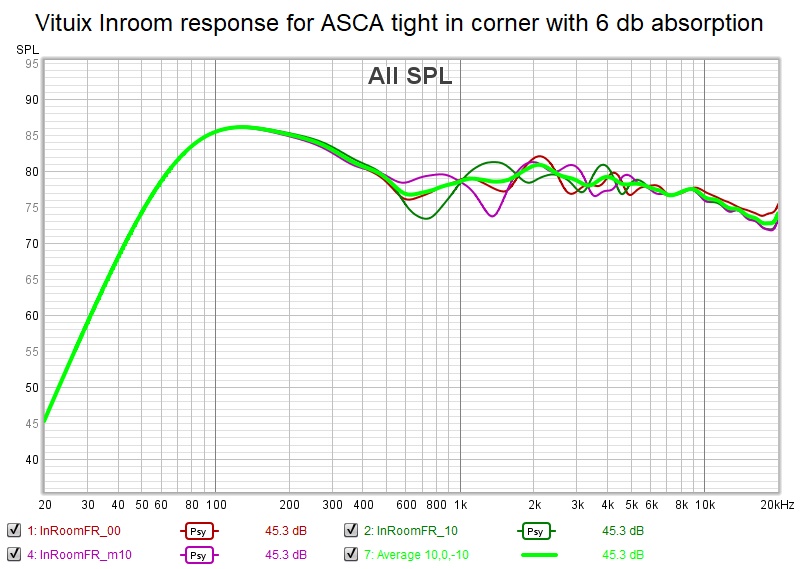
Corner support extends out to 500 Hz and will equalize nearly flat across the window. The two shallow nulls (two because the driver center is off center in the corner) will be better than +/- 3db when EQed to the average.
If it comes out that good in real life I will be very pleased; so far I've only used these speakers well out away from my garage walls.
I imported Vituix calculated in room responses across my presumed +/-10 degree listening window for ASCA tight in a corner and 6db absorpton. 2" of rockwool will provide at least 6 db absorption at the first null increasing to 10 db at 1.5 khz or so and above.
Note these FRs are psycho-acoustic smoothed; REW won't FDW an imported FR.
Corner support extends out to 500 Hz and will equalize nearly flat across the window. The two shallow nulls (two because the driver center is off center in the corner) will be better than +/- 3db when EQed to the average.
If it comes out that good in real life I will be very pleased; so far I've only used these speakers well out away from my garage walls.
Attachments
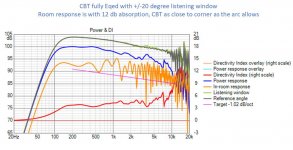
Well, since I'm actually looking for an excuse to design/build another speaker, I thought I should do a similar analysis for a CBT, not as tight in a corner and so with more absorption.
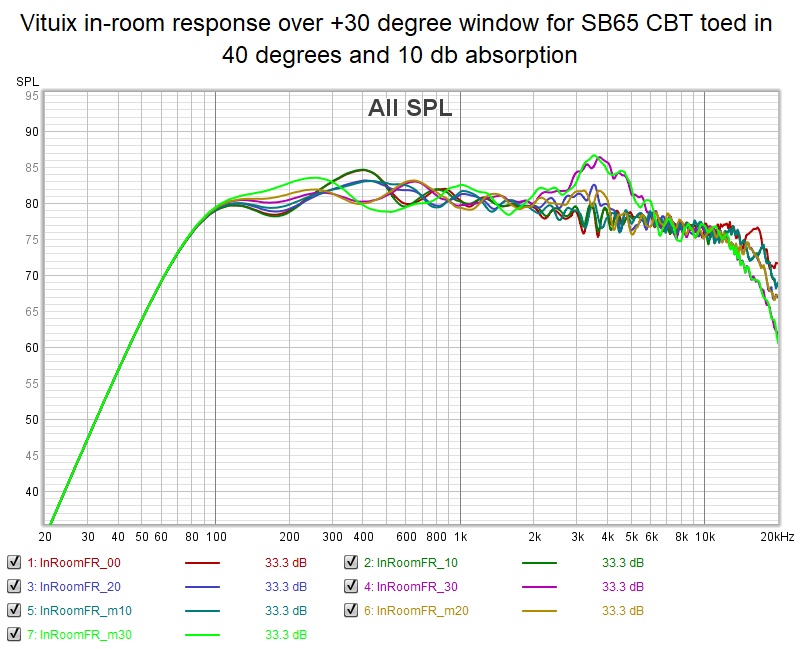
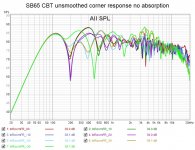
The responses are remarkably close together over the entire 60 degree window except for the horizontal sidelobes in the upper midrange/lower treble at 30 degrees off axis.
If I restrict the window to just 20 degrees, it looks even better.
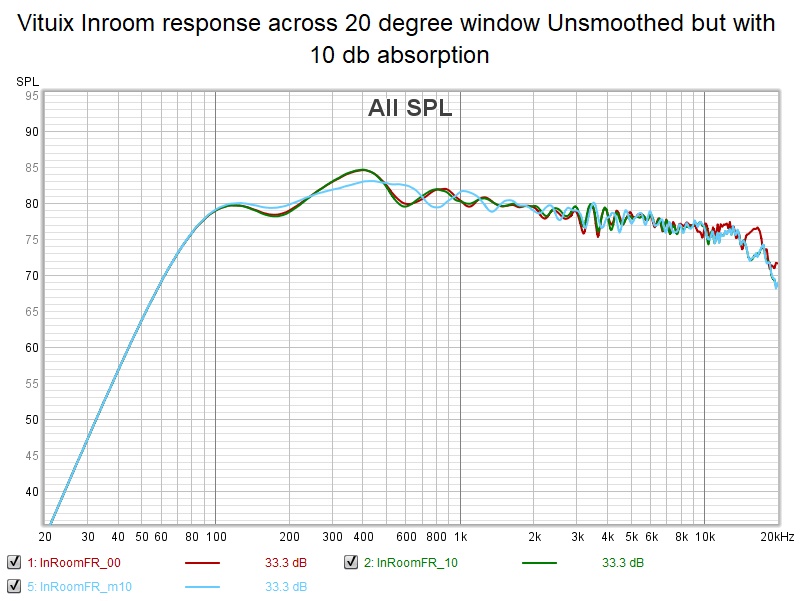
the zero and plus ten responses are right on top of each other and so I would use the axial response for an EQ reference and sit between 0 and 10. If anyone is seated at -10 degrees, they will be within 3db.
Is this a case of CBT being better than straight floor to ceiling or just a case of more absorption being better. I think the former. The difference across a limited window between CBT and straight may be small but over a 60 degree window it is.
Finally you can see comb lines in the top octave for the straight line array that the CBt simulation doesn't show. (this last sim was with no absorption)
The responses are remarkably close together over the entire 60 degree window except for the horizontal sidelobes in the upper midrange/lower treble at 30 degrees off axis.
If I restrict the window to just 20 degrees, it looks even better.
the zero and plus ten responses are right on top of each other and so I would use the axial response for an EQ reference and sit between 0 and 10. If anyone is seated at -10 degrees, they will be within 3db.
Is this a case of CBT being better than straight floor to ceiling or just a case of more absorption being better. I think the former. The difference across a limited window between CBT and straight may be small but over a 60 degree window it is.
Finally you can see comb lines in the top octave for the straight line array that the CBt simulation doesn't show. (this last sim was with no absorption)
Attachments
-
 Vituix in-room response over +30 degree window for SB65 CBT toed in 40 degrees and 10 db absorpt.jpg186.2 KB · Views: 296
 -
 Vituix Inroom response across 20 degree window Unsmoothed but with 10 db absorption.jpg160.8 KB · Views: 303
 -
 Vituix in-room response for ASCA in corner over 60 degree window.jpg195.3 KB · Views: 287
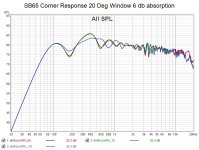
Well, that isn't exactly apples to apples so here we go again
Across the full 60 degree window the corner response with no absorption really isn't too bad except for two sharp nulls, one of which is well off axis

Reduced to the 20 degree listening window, it looks even better:
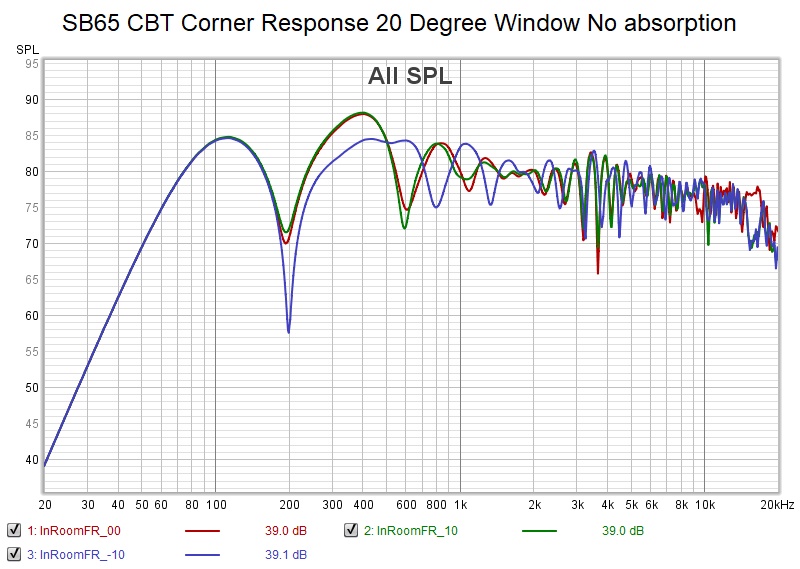
but it does show a sharp null at 200 Hz where our target absorber panel,
4" thick spaced out 3" or 6" spaced out 1", only has 6db of attenuation
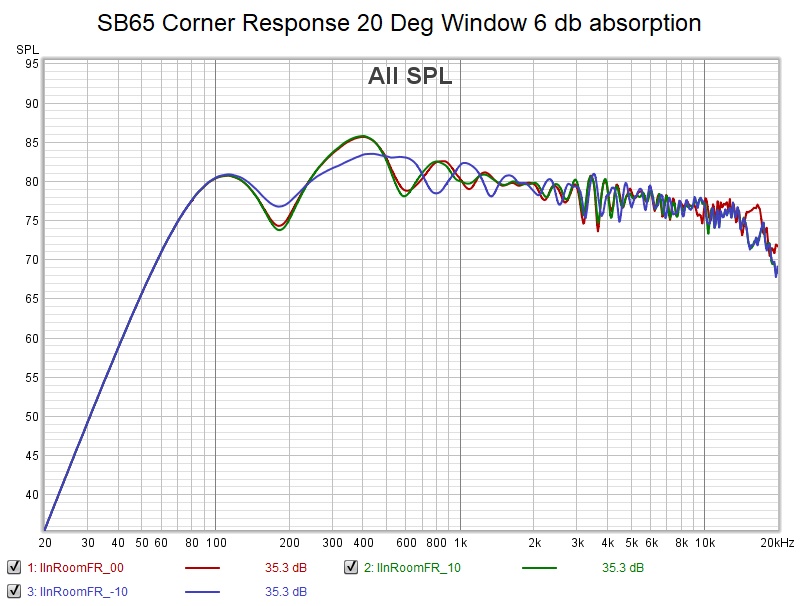
apparently 6 db is sufficient absorption to reduce that first null to less 3db variation across the entire 20 db window and less than 1 db in half that window
Across the full 60 degree window the corner response with no absorption really isn't too bad except for two sharp nulls, one of which is well off axis
Reduced to the 20 degree listening window, it looks even better:
but it does show a sharp null at 200 Hz where our target absorber panel,
4" thick spaced out 3" or 6" spaced out 1", only has 6db of attenuation
apparently 6 db is sufficient absorption to reduce that first null to less 3db variation across the entire 20 db window and less than 1 db in half that window
Attachments

The cleanest response may be with ASCA with the corner built out with 7" thick absorption panels
over a full 60 degree window
and over the central 20 degree window
which looks EQable to +/-1.5 db across the window
over a full 60 degree window
and over the central 20 degree window
which looks EQable to +/-1.5 db across the window
Attachments

One other piece to this puzzle is to consider building out the corner with 90 dgree horn flares placed as close to the driver as possble instead of absorbers. I have already convinced myself not to do this because of issues with the far from ideal resulting horn throat seen in Axidriver. Here is what Vituix has to show about it.
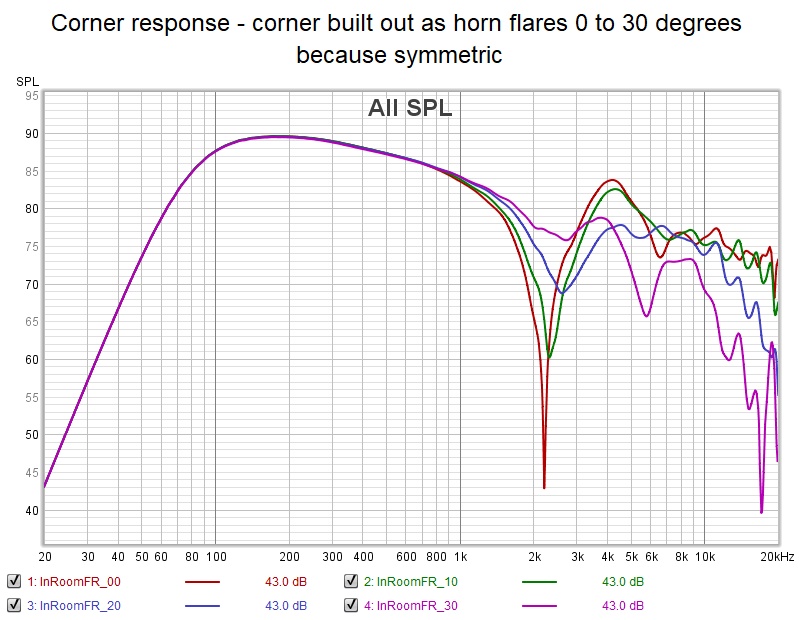
You get a cancellation null that moves with off axis angle, deepest on axis. I would say that this confirms the previous conclusion that absorbers are the better solution. If you want to save absorber, build out the corner but leave room for an inch or so of absorber on the surface of the flare.
You get a cancellation null that moves with off axis angle, deepest on axis. I would say that this confirms the previous conclusion that absorbers are the better solution. If you want to save absorber, build out the corner but leave room for an inch or so of absorber on the surface of the flare.
Attachments
I sent my Vituix file to Kimmosto and asked him about the horizontal sidelobes. He responded that I had the selected the wrong direction of curvature. To me, it was logical that negative Zaxis was behind the baffle. However its actually toward the mic, a "standard" inherited from LspCAD with which I have no experience. So I have been simulating an array focussed on the listener's feet rather than a CBT. I suppose I would be more embarrassed if I had a wider audience.
I don't think that invalidates my conclusion that the straight array is better for me or for anyone that needs to place the array in close proximity to walls. The closer to the corner, the less absorption needed to tame the boundary interference and the straight array can be closer.
I don't think that invalidates my conclusion that the straight array is better for me or for anyone that needs to place the array in close proximity to walls. The closer to the corner, the less absorption needed to tame the boundary interference and the straight array can be closer.
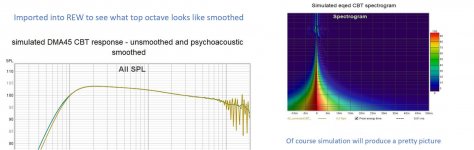
Corrected DMA45 CBT response
Here are a set of pictures that present the corrected CBT response but for an array of 1.5" DMA45's rather than the 2.5" SB65WBAC25.
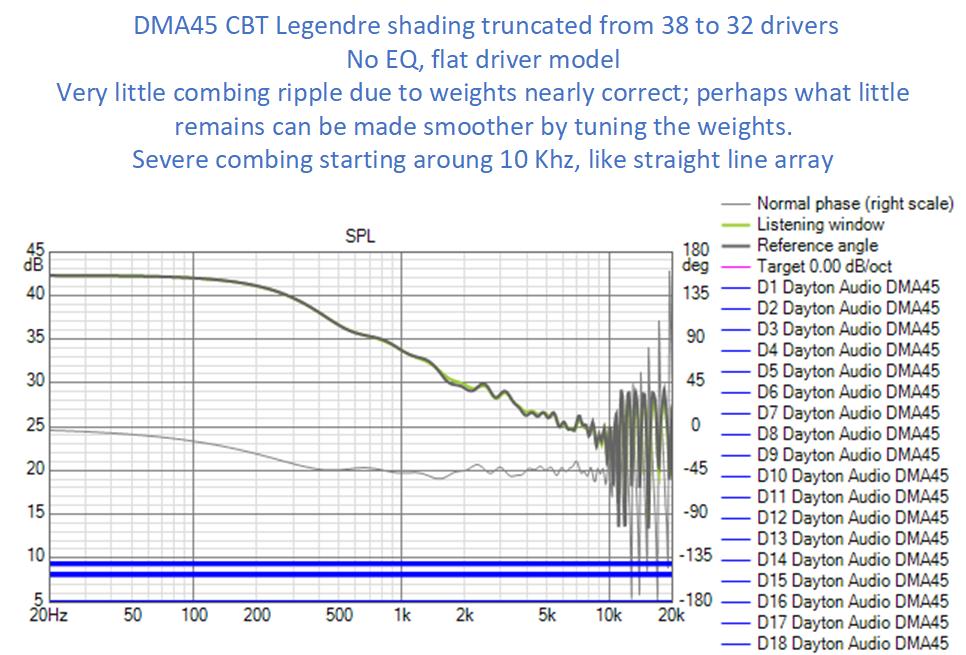
Since there is very little array effect ripple to flatten, the power response is proportionally smoother. Recall re' the room response below that the straight array does so much better with 12 db absorption provided by 4" thick pads.
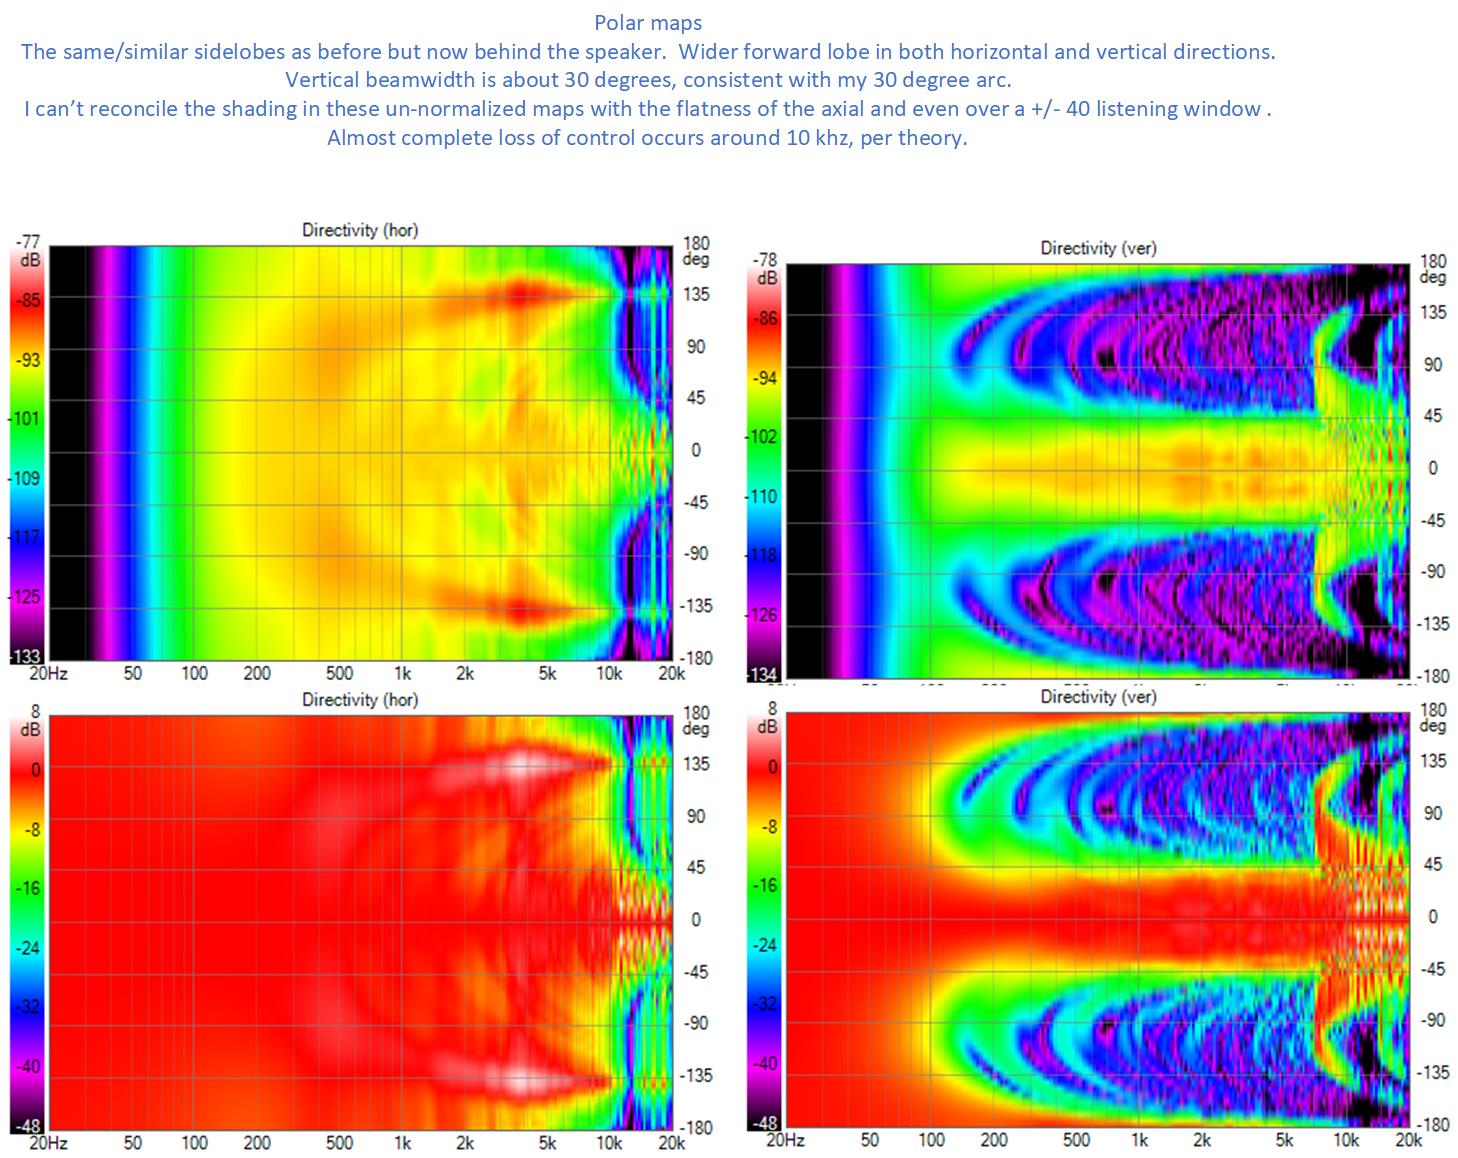
Here are the polar maps. In general, we see a much wider response. The horizontal curve is surprisingly wide so I wonder if another embarrassment is hiding in my simulation. The vertical map is, I think, consistent with theory.
I had to import the simulated IR into REW and look at it smoothed to fine tune the response in the top octave. I looked at the spectrogram to see what it showed there as well. The lower frequency part of the spectrogram simply shows that I chose linear phase equalizer blocks for the most part in the simulation.
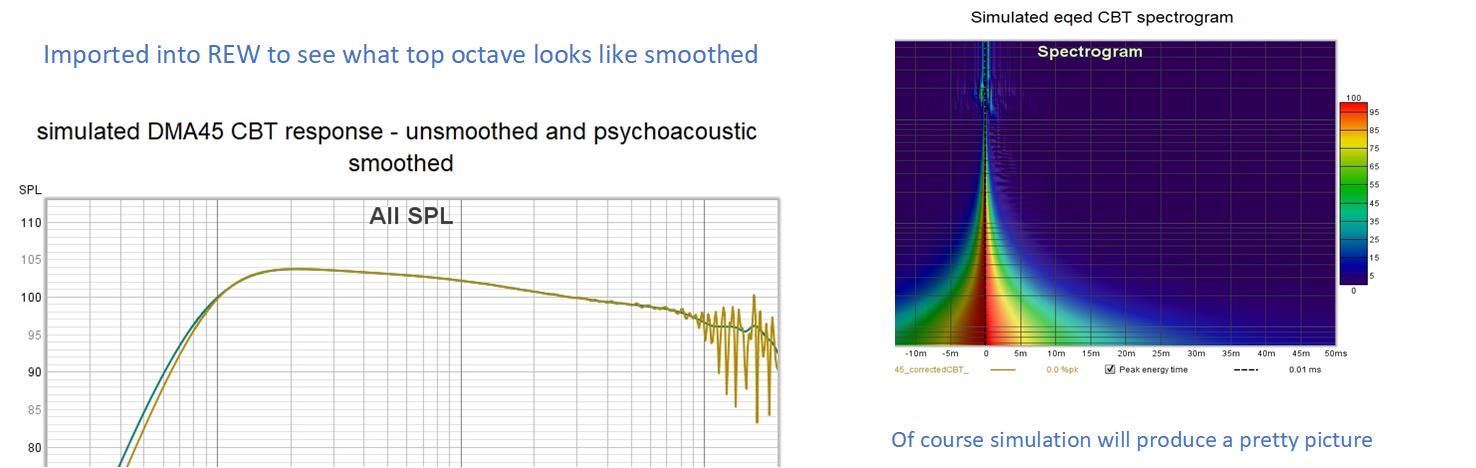
Here are a set of pictures that present the corrected CBT response but for an array of 1.5" DMA45's rather than the 2.5" SB65WBAC25.
Since there is very little array effect ripple to flatten, the power response is proportionally smoother. Recall re' the room response below that the straight array does so much better with 12 db absorption provided by 4" thick pads.
Here are the polar maps. In general, we see a much wider response. The horizontal curve is surprisingly wide so I wonder if another embarrassment is hiding in my simulation. The vertical map is, I think, consistent with theory.
I had to import the simulated IR into REW and look at it smoothed to fine tune the response in the top octave. I looked at the spectrogram to see what it showed there as well. The lower frequency part of the spectrogram simply shows that I chose linear phase equalizer blocks for the most part in the simulation.
Attachments
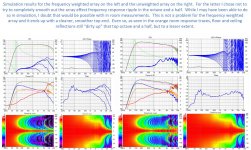
this morning I decided to see if frequency weighting would clean up the treble. I had second thoughts when I started to implement it on the CBT so I went to my ASCA straight array instead.
This picture compares the line array effects for both unweighted and frequency weighted 32 driver straight arrays. The grey traces in the top graph are the axial responses. The orange traces in the middle graphs are room responses and include just floor and ceiling reflections.
Equalization yields the following picture:
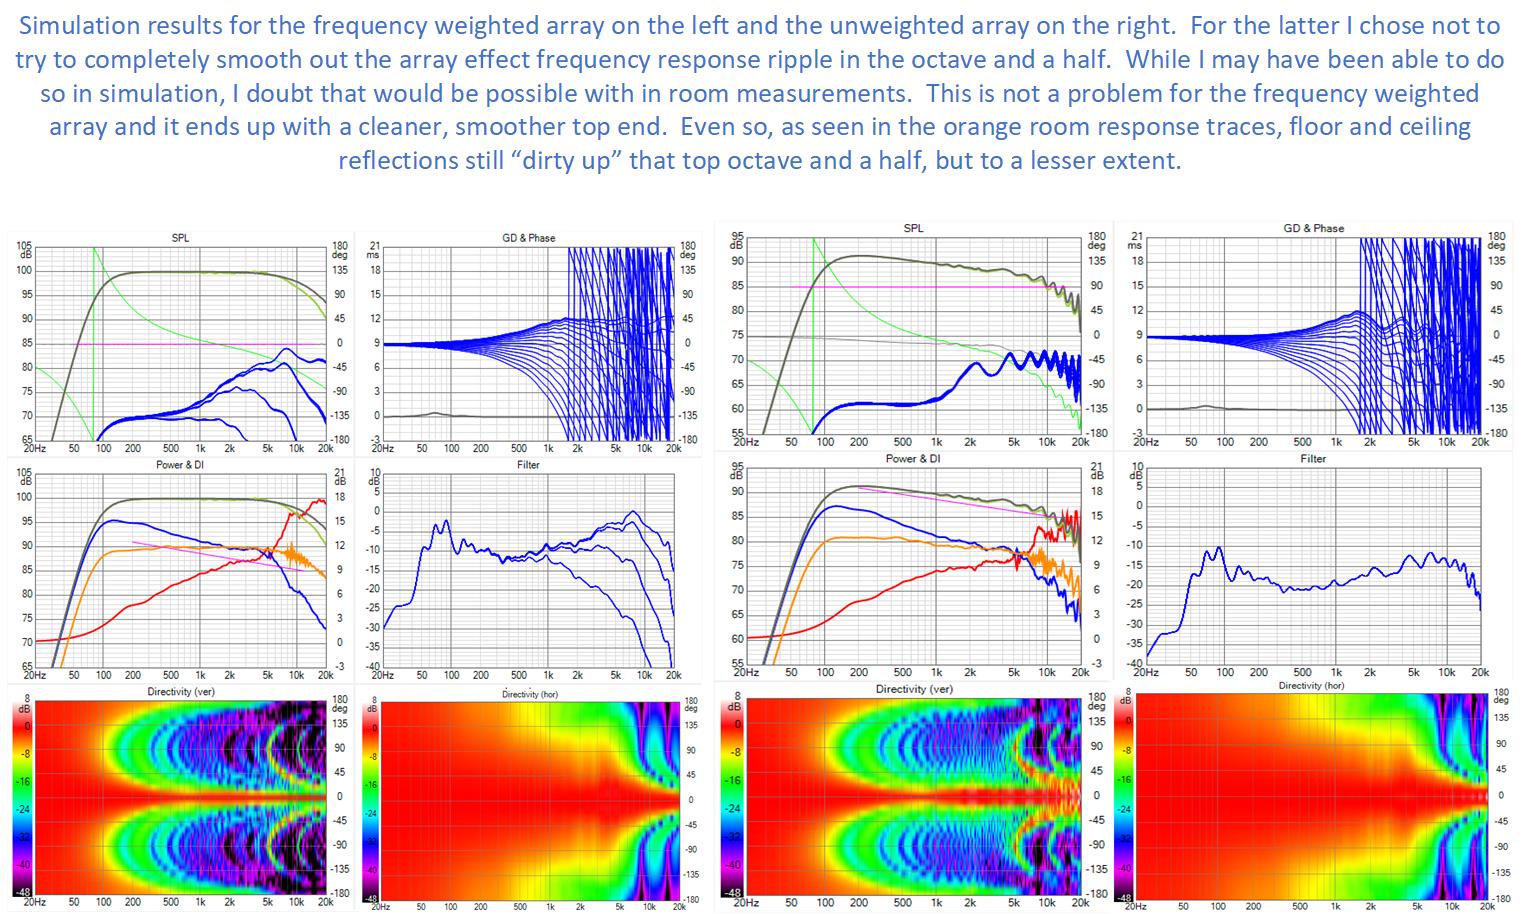
I see I left off the room curve on the weighted array equalization. That doesn't detract from the fact that it is dramatically cleaner, not only than the unweighted straight array but also than the CBT.
This picture compares the line array effects for both unweighted and frequency weighted 32 driver straight arrays. The grey traces in the top graph are the axial responses. The orange traces in the middle graphs are room responses and include just floor and ceiling reflections.
Equalization yields the following picture:
I see I left off the room curve on the weighted array equalization. That doesn't detract from the fact that it is dramatically cleaner, not only than the unweighted straight array but also than the CBT.
Attachments

Frequency dependent weighting of CBT
This morning I attacked frequency dependent weighting of a CBT
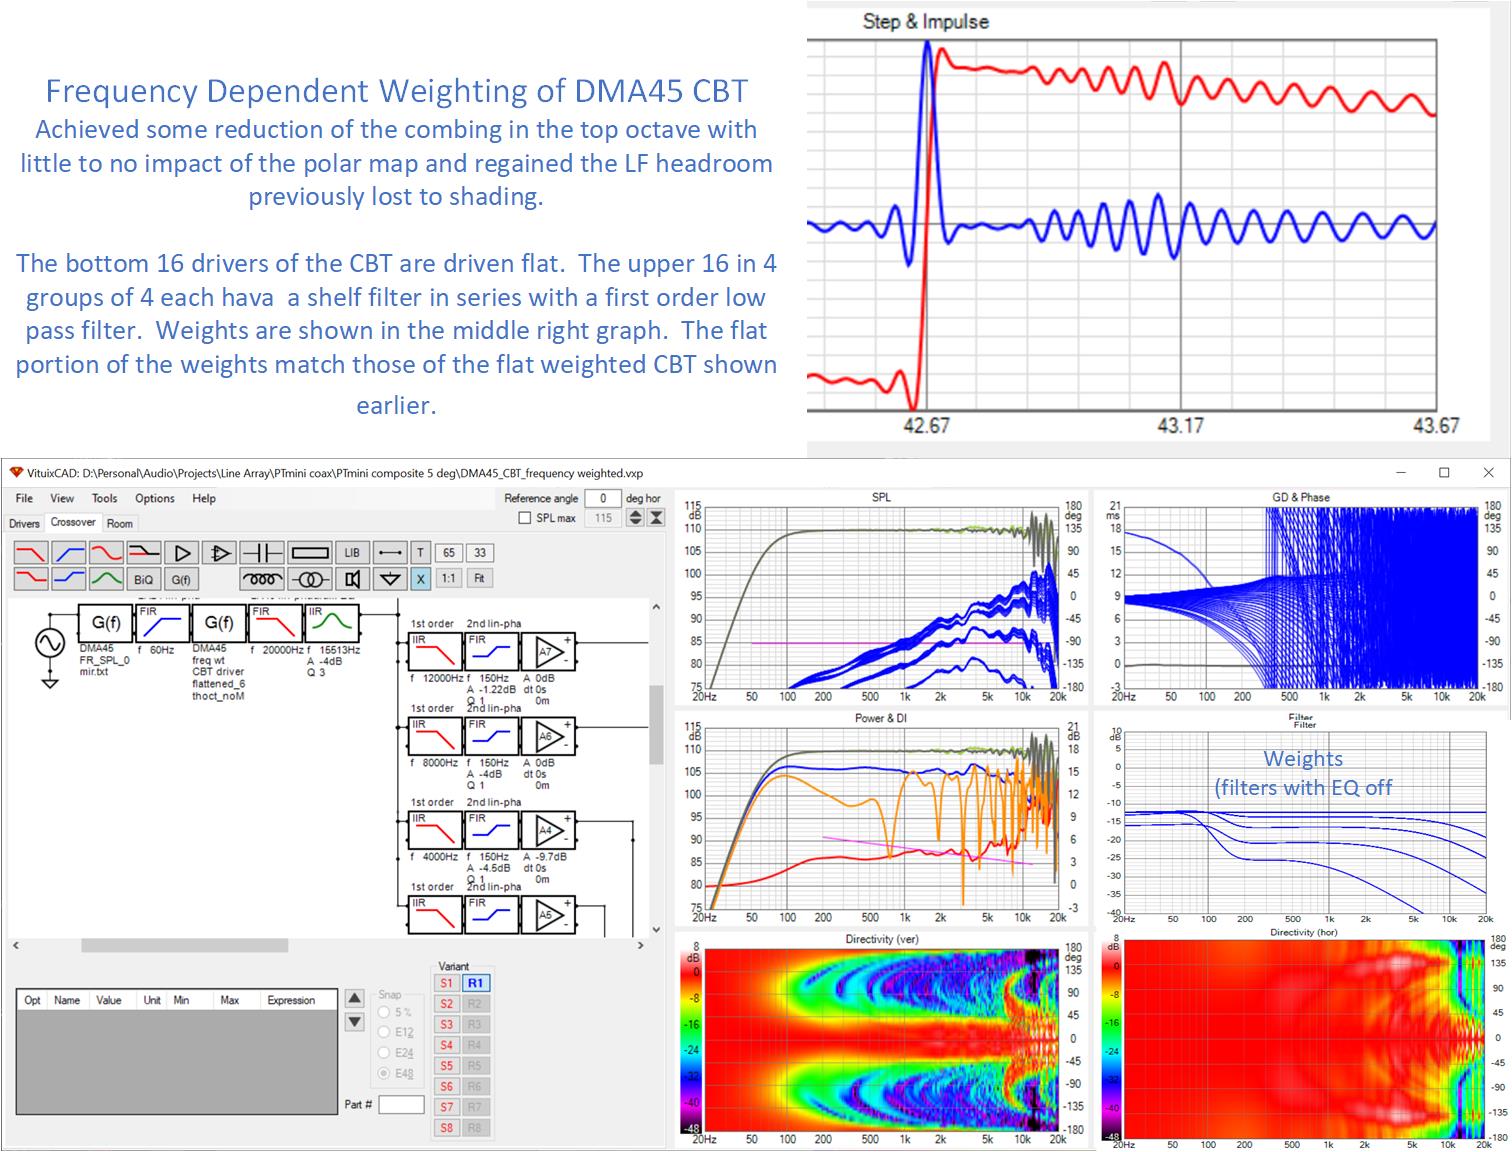
The improvements are evident in this graph:
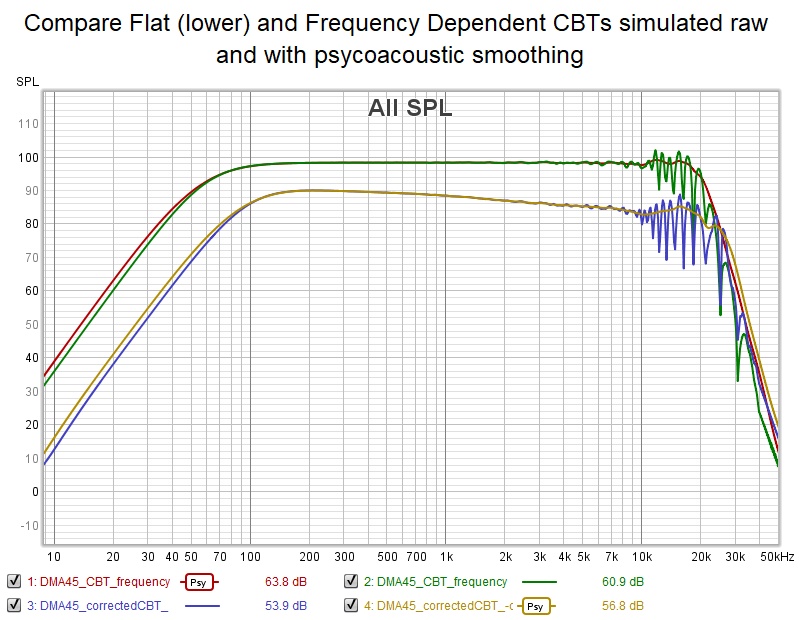
The top pair of traces, simulated response overlaid with psycho smoothed copy, is the frequency dependent weighted CBT. The improvment in the top octave is obvious. At the low end, I simply set the high pass filter cutoff down from 100 to 60 Hz, supported by the recovered headroom.
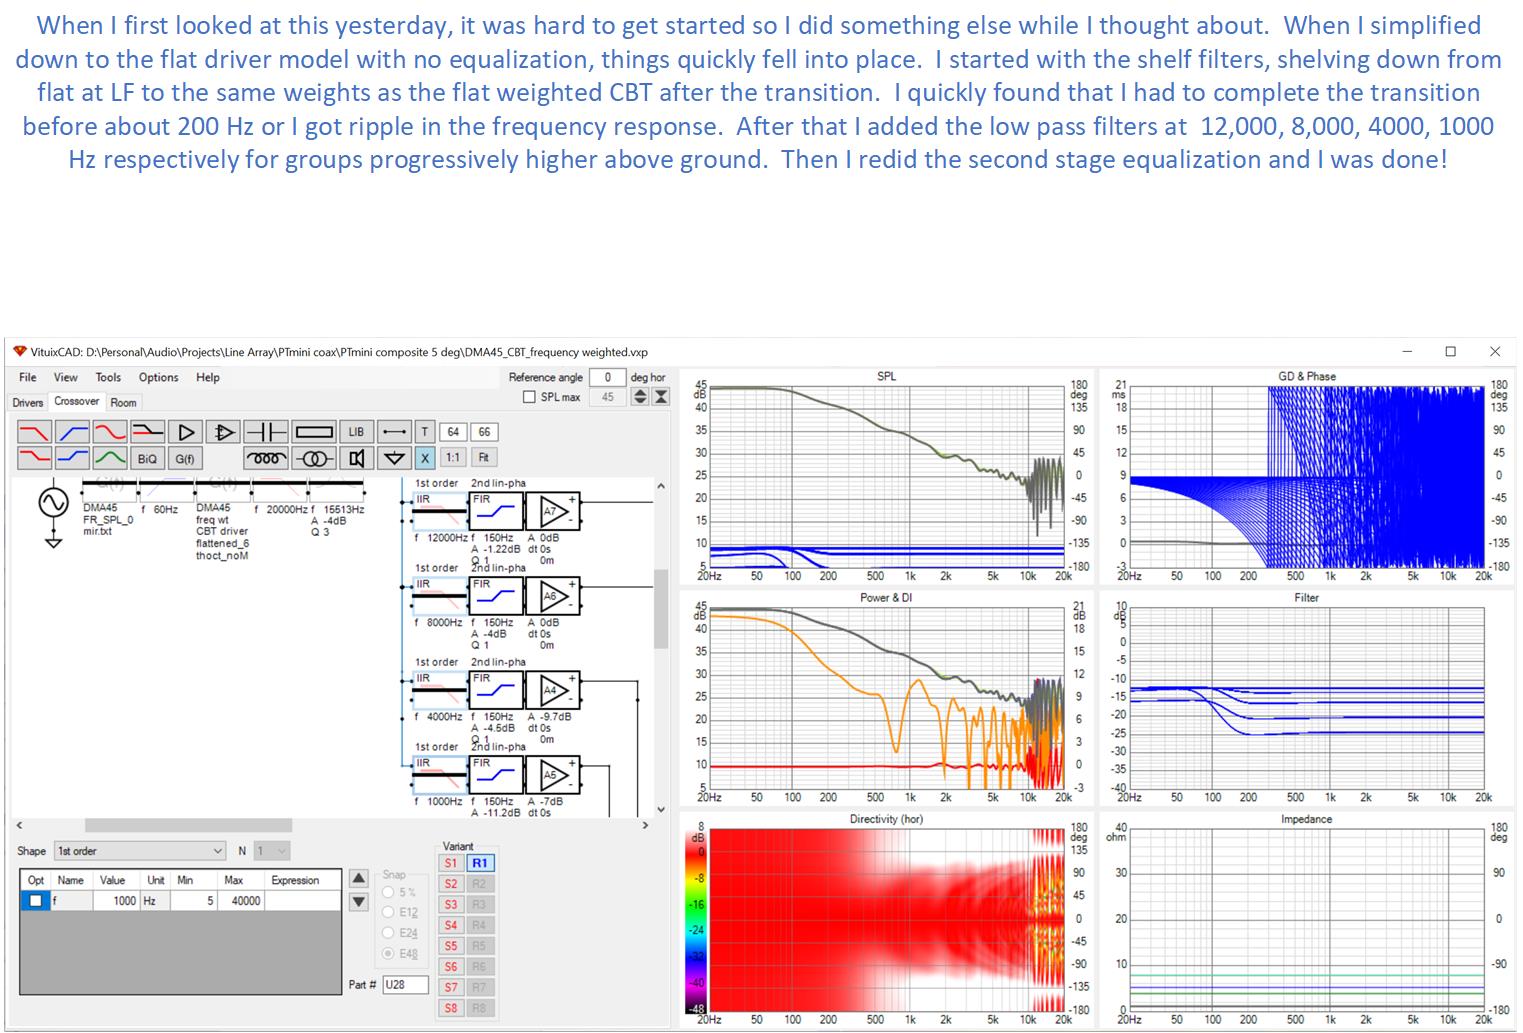
A few words on how I developed these weights on this picture:
This morning I attacked frequency dependent weighting of a CBT
The improvements are evident in this graph:
The top pair of traces, simulated response overlaid with psycho smoothed copy, is the frequency dependent weighted CBT. The improvment in the top octave is obvious. At the low end, I simply set the high pass filter cutoff down from 100 to 60 Hz, supported by the recovered headroom.
A few words on how I developed these weights on this picture:
Attachments


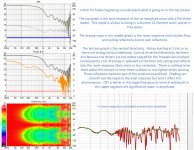
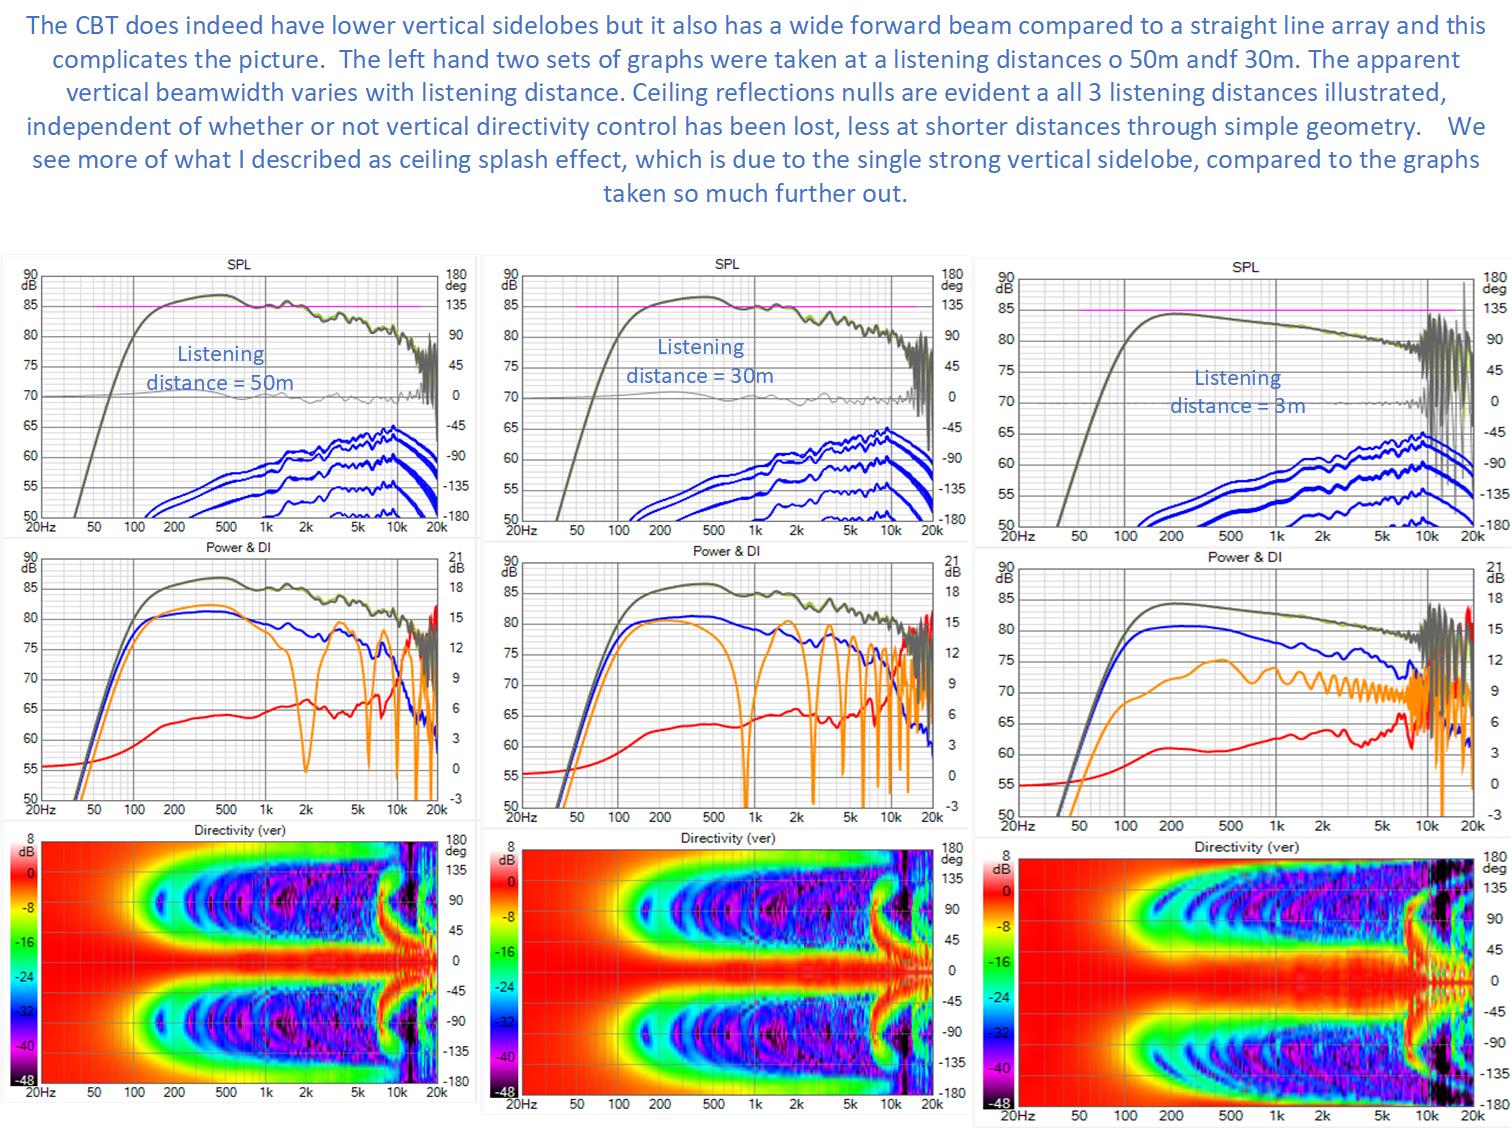
Well the CBT does indeed have lesser vertical sidebands and they are confined to higher frequencies but that doesn't mean it has less ceiling splash. Explanation in the picture.
It was easy for me to confuse myself about the CBT being better in this regard because I still have some simulations with the CBT curve facing the wrong way around 🙂
It was easy for me to confuse myself about the CBT being better in this regard because I still have some simulations with the CBT curve facing the wrong way around 🙂
Attachments
Last edited:
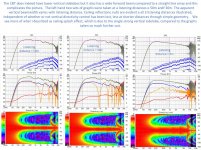
How does the response of a finite discrete line array vary with listening distance. We know that that a continuous infinite line has only the 3db per doubling of distance roll off as well as a -3db per octave. We have seen that the discreteness gives rise to some response ripple along that slope. In the following slide we will see position dependency in that ripple
Here is the simulated response in room where floor and ceiling reflections make it a quasi infinite array with improved uniformity of response:
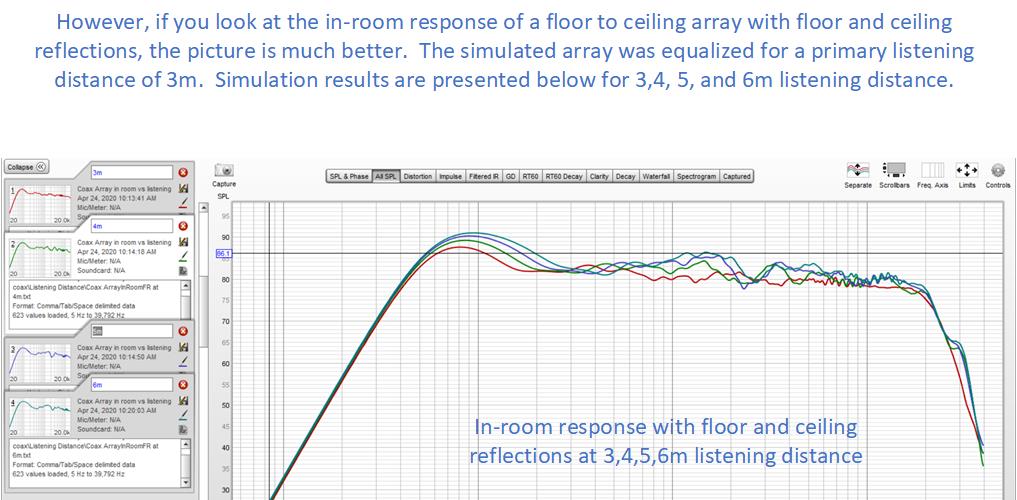
This array inroom would be +- 3db over a 3m to 6m listening distance range when equalized for the center of the range, and significantly closer at most frequencies. You would definitely equalize for your primary listening position but it wouldn't be terrible further back in the room.
Here is the simulated response in room where floor and ceiling reflections make it a quasi infinite array with improved uniformity of response:
This array inroom would be +- 3db over a 3m to 6m listening distance range when equalized for the center of the range, and significantly closer at most frequencies. You would definitely equalize for your primary listening position but it wouldn't be terrible further back in the room.
Attachments

- Home
- Loudspeakers
- Full Range
- Full range line array for wall or corner placement