Hi xrk971,
I was just about to reply to your post No. 138 when I found BYRTT’s and your posts. Just in case someone else has not understood my previous post, here is what I was about to reply to your post No138.
Let me guide you through the block diagram first of all. The signal from generator V1 first goes through buffer stage B1which drives the inputs of the three B&O Xover filters H1, H2 and H3.
H1 is a 2nd order HP filter set to 1KHz with a Q of 0.5 non-inverting
H2 is a 1st order BP filter set to 1KHz with a Q of 0.5 non-inverting
H3 is a 2nd order LP filter set to 1KHz with a Q of 0.5 non-inverting
These filter values came from Dr. John Kreskovsky’s spreadsheet detailed earlier in this thread. I entered 1KHz for Fx and 1 for gamma.
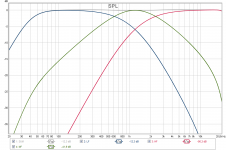
The outputs of H1, H2 and H3 are all summed in the summing stage E2, who’s output represents the acoustic response of a system using this type of Xover when all the drivers are mounted on an infinite baffle. So this is an idealized system that has perfect drivers and no diffraction issues.
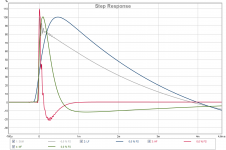
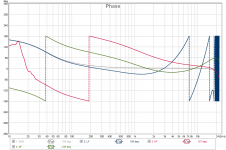
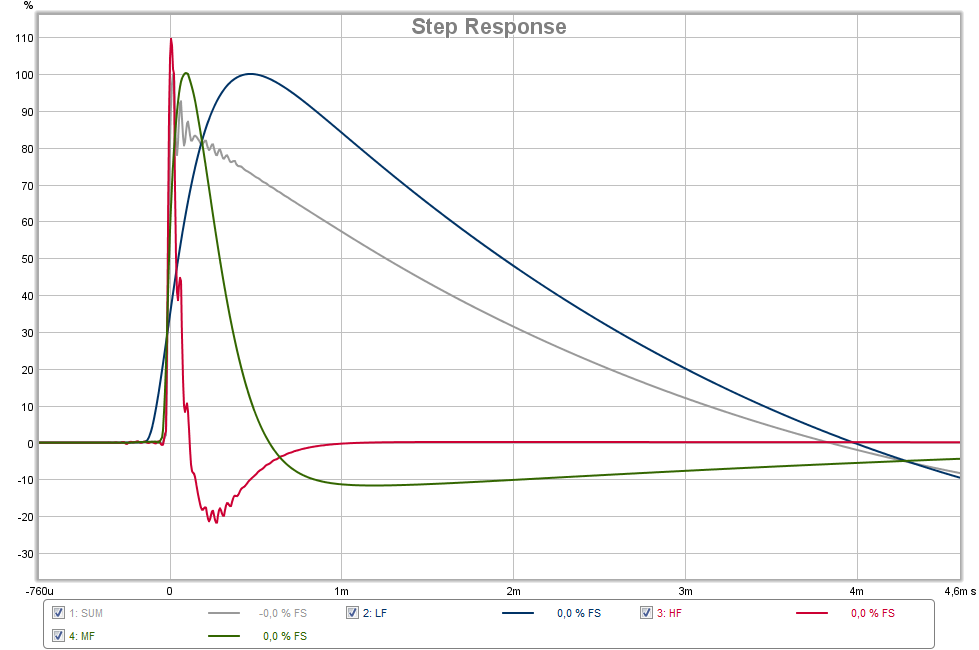
The responses of these filters are shown in Figure 2 together with their summed output and as can be seen, the output is perfectly flat and in figure 3 you can see that it has a true square shaped step response, while in Figure 4, you can see that it has a perfectly flat group delay that is a true indicator that the system is linear phase.
All of the above is very well known, so in order to further the analysis, I included some of the parameters of loudspeaker drivers by adding into the signal path the drivers bandwidth and acoustic offset. To do this, I connected the output of H3 to the input of a 2nd order filter with a pass band of 2 decades in frequency comprising of H8 and H9. Since the output of H3 contains the woofer signal, I set the pass band of H8 and H9 from 40Hz to 4KHz, which I think is a reasonably high bandwidth for a woofer. The output of H9 is then connected to B4, which enabled me to set the acoustic offset for a woofer to 100uS of delay, which again I think is a reasonable time offset for a woofer.
As you can see, I have done the same thing for the mid-range driver and tweeter. All three outputs are then connected to the E1 summing stage, which provides a second output showing the effects on the response when the driver’s bandwidth and acoustic offset are included with the B&O Xover.
So there are two outputs, E1 and E2 that show the difference that some of the real world driver parameters have on the idealized B&O Xover response.
Hope this makes it a little clearer.
Peter
I was just about to reply to your post No. 138 when I found BYRTT’s and your posts. Just in case someone else has not understood my previous post, here is what I was about to reply to your post No138.
Let me guide you through the block diagram first of all. The signal from generator V1 first goes through buffer stage B1which drives the inputs of the three B&O Xover filters H1, H2 and H3.
H1 is a 2nd order HP filter set to 1KHz with a Q of 0.5 non-inverting
H2 is a 1st order BP filter set to 1KHz with a Q of 0.5 non-inverting
H3 is a 2nd order LP filter set to 1KHz with a Q of 0.5 non-inverting
These filter values came from Dr. John Kreskovsky’s spreadsheet detailed earlier in this thread. I entered 1KHz for Fx and 1 for gamma.
The outputs of H1, H2 and H3 are all summed in the summing stage E2, who’s output represents the acoustic response of a system using this type of Xover when all the drivers are mounted on an infinite baffle. So this is an idealized system that has perfect drivers and no diffraction issues.
The responses of these filters are shown in Figure 2 together with their summed output and as can be seen, the output is perfectly flat and in figure 3 you can see that it has a true square shaped step response, while in Figure 4, you can see that it has a perfectly flat group delay that is a true indicator that the system is linear phase.
All of the above is very well known, so in order to further the analysis, I included some of the parameters of loudspeaker drivers by adding into the signal path the drivers bandwidth and acoustic offset. To do this, I connected the output of H3 to the input of a 2nd order filter with a pass band of 2 decades in frequency comprising of H8 and H9. Since the output of H3 contains the woofer signal, I set the pass band of H8 and H9 from 40Hz to 4KHz, which I think is a reasonably high bandwidth for a woofer. The output of H9 is then connected to B4, which enabled me to set the acoustic offset for a woofer to 100uS of delay, which again I think is a reasonable time offset for a woofer.
As you can see, I have done the same thing for the mid-range driver and tweeter. All three outputs are then connected to the E1 summing stage, which provides a second output showing the effects on the response when the driver’s bandwidth and acoustic offset are included with the B&O Xover.
So there are two outputs, E1 and E2 that show the difference that some of the real world driver parameters have on the idealized B&O Xover response.
Hope this makes it a little clearer.
Peter
Byrtt,
Thanks for the explanation. That is neat to do it with real audio signals loop back thru sound card. That is real data we are looking at and not just theory. As you say, it is simple but hard in practice. This may explain why Dunlavy used 1st order electrical, to arrive as 2nd order acoustically.
Yes its real data that are analog or digital available at soundcard electric I/O.
When you say hard in practice remind me in a Duelund paper he talks about when really having perfect sum one can stand in front of drivers without being able to pinpoint their bandpass because they sum so perfect, then he say they need acoustic offset within 1mm to listener and each driver have their own box to be remove able for calibrating distance to listener, well then its clear why in practice its hard to get there.
Did the same plots at Fx 1200Hz gamma 1,0 because thought they can mayby help you when calibrating your system that you have a close to same target where filters are run in a more perfect domain electric than acoustic. To see the three bandpass sections SR that sum to the triangle think can be help when trimming system one driver at a time how it approximate should look like. My soundcard probably fall off somewhere below 10Hz and HF is limited by 24kHz DAC filters when run at 48kHz sample rate and can be seen push little to slopes at HF but still very usefull.
Attachments

Hi BYRTT,
Yes, you are corerct. Well done.🙂
Peter
Thanks polite of you Peter, sorry i got first with comment and in that way a little did steal your hard work and nice documentation, wasn't meant so I'm just very interested and enjoy the stuff.
Byrtt and PLB,
Thanks for all your help in showing me how this works and the fine points of what has to be done for it to look perfect. Seems like well behaved wide band drivers from woofer to mid and tweeter are required. I am thinking maybe one approach is to use a smaller woofer like 6in and chosen to have very high bandwidth with minimal breakup. Like an SBA Satori etc. The mid needs to be high sensitivity and widest of all because it has to span both sides of the xo. The Scanspeak 10F is probably ideal here even though it seems it is underutilized. The smoothness and wide bandwidth is what is important. Then for the tweeter a regular soft dome is fine as we now push the center frequency higher - say 2.5kHz. The woofer has to pull a big part of the work here from 50Hz to 2.5khz, but needs to be smooth to 5kHz and preferably higher. I know I will be searching for woofers that are flat out to 5kHz. The Heil AMT which goes as low as 600Hz would probably work with a HP at 2.5kHz.
https://www.madisoundspeakerstore.com/satori-woofers-6-7/satori-mw16p-black-egyptian-reed-cone/
Last edited:
Pop up IR.wav of your last two results and I will investigate windowing and square waves with Cool Edit; only takes a couple of minutes. Export from REW with rectangular window:
View attachment 492611
File will be about 32k; just do the usual and change extension to .asc.
Ok, thanks for the offer. Here you go... 100-500ms rectangular window 32bit.
Attachments
Yes its real data that are analog or digital available at soundcard electric I/O...
Byrtt,
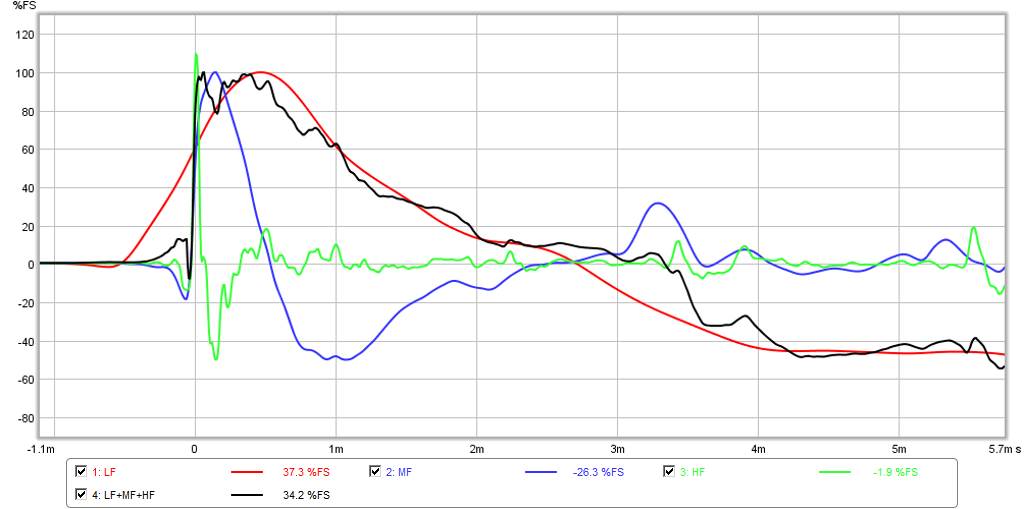
I finally figured out how to plot multiple traces of any parameter ("Overlay" plot feature) 🙂 REW actually is a very nice fully featured plotting package in general. Nice graphs.
Your plots of the different SR's for LF/MF/HF/ALL inspired me. Here is what I have - they sort of resemble what you have.
Attachments

Last edited:
xrk971 wrote:
With suitable drivers two-way solutions are possible using asymmetrical constant-voltage crossovers.
BTW I will play a little with the spreadsheet and see if other Q-values and the splitting of the pole frequencies would give a more reasonable 3rd-4th-3rd order filler driver combo.
One general point: The phase response part of a driver's response has a more detrimental effect on the summed response than its amplitude response part.
This leads to an interesting solution for those who use speakers of the econowave style (i.e. PA woofer plus Horn).
Regards
Charles
Thanks for looking into this. So is the LR2-BW1-LR2 the simplest way to get a response that sums flat and has decent cone control for woofer and tweeter?
With suitable drivers two-way solutions are possible using asymmetrical constant-voltage crossovers.
BTW I will play a little with the spreadsheet and see if other Q-values and the splitting of the pole frequencies would give a more reasonable 3rd-4th-3rd order filler driver combo.
One general point: The phase response part of a driver's response has a more detrimental effect on the summed response than its amplitude response part.
This leads to an interesting solution for those who use speakers of the econowave style (i.e. PA woofer plus Horn).
Regards
Charles
Last edited:
Ok, thanks for the offer. Here you go... 100-500ms rectangular window 32bit.
Somebody is up way to late....
I'll put some more pics up later; but relax. You've got a really nice alignment with both variants showing extensive square wave performance in 400Hz-3.5kHz range using full IR; and lots of crisp views when reflections are suppressed.
Here is full IR convolution in 140Hz zone of swept square wave:

For measurement set up reflections/modes are sympathetic.
More later.....
The phase response part of a driver's response has a more detrimental effect on the summed response than its amplitude response part.
You meant on the final sound. Agree. It should be phase_accurate 😀
I was pretty unclear (once again), sorry ! :-(
What I wanted to say is that the influence of the drivers out of band phase response on the amplitude response of the whole arrangement is larger than the out of band amplitude response's influence on the amplitude response of the whole arrangement.
Regards
Charles
What I wanted to say is that the influence of the drivers out of band phase response on the amplitude response of the whole arrangement is larger than the out of band amplitude response's influence on the amplitude response of the whole arrangement.
Regards
Charles
Byrtt,
I finally figured out how to plot multiple traces of any parameter ("Overlay" plot feature) 🙂 REW actually is a very nice fully featured plotting package in general. Nice graphs.
Your plots of the different SR's for LF/MF/HF/ALL inspired me. Here is what I have - they sort of resemble what you have.
Thanks the plot later in day after job time will try analyze to see if we can find some clues.
A quick comment when compare to my electric is HF at 110% MF/LF at 100% is good, but sum shall start at 100% make some very steep sawtooth (HF fall off or call it system LP) and then triangle shall first real start at aprox 85% falling off to the right. In sum that we clear can see raw LF hump turn to 100% is a error and points little to errors PLB showed us which was timing offset and amplitude lower down in slopes but its complicated setup we also have a LF and HF that where they meet in air have to cansel to get right slopes to blend with MF. That HF and MF goes too negative by over 40% i don't know but will check tonight mayby its to steep slopes or suddenly slope fall off deep low.
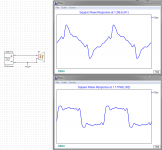
There seems to be a faster way to reveal square waves from a system that do real bench it with a oscilloscope, remember bwaslo mentioned it over your Trynergy thread. In his XSim program make simple circuit by link a ideal driver to the amp then double click the driver and link frd file from measurement of speaker. Now start the "Square Wave Response" and as default it shows 1kHz but in the "Scale" meny one can sweep up and down in frq. Took the IR-1 file you uploaded for Barleywater imported it to REW and then export a frd file to use in XSim. Below is what XSim show for the 1,2kHz you showed at post 118, but then see had you choosen 1,177kHz instead : )
Barleywater,
Here what XSim get out of the IR-1 file when asking a 140Hz square wave:
Attachments

Last edited:
Here is the filler-driver-less topology that I mentioned for the direct-radiator/horn combinations:
http://www.diyaudio.com/forums/multi-way/5435-active-subtractive-xos-4.html#post153944
It would need some refinements though. I f someone is interested I can help with these.
This is from an old thread of mine. There are things I wouldn't express the same way anymore as I did back then. The 3rd/3rd order symmetrical could be built in a simpler fashion for instance. And it isn't true that only subtractive crossovers can be transient-perfect. And the transfer functions offered by subtractive crossovers can of course also be achieved with other topologies.
Regards
Charles
Last edited:
Correct me if wrong but even it has very flat phase it seems add a 360º phase turn around filler center and then add system passband ending at little >540º, where the ala B&O is linear phase only error is system passband little >180º and outside mid frq area. Below is a Duelund mid filler at 1500Hz A value 2,828427.
Attachments

Last edited:
Somebody is up way to late....
I'll put some more pics up later; but relax. You've got a really nice alignment with both variants showing extensive square wave performance in 400Hz-3.5kHz range using full IR; and lots of crisp views when reflections are suppressed.
Here is full IR convolution in 140Hz zone of swept square wave:
View attachment 492754
For measurement set up reflections/modes are sympathetic.
More later.....
Oh goody...
I feel better now. 😱
As the famous line in the ending of a popular cartoon from the late 70's went: "If it weren't for those pesky little *reflections*, I would have gotten away with it too."
Byrtt,
Good idea on using xsim to simulate the step response. I wonder if REW has a utility for importing a .wav file (truncated via editor program) that can do the same?
So if changing from 1.200kHz to 1.177kHz changes the result significantly, does that mean it is a reflection issue or a time alignment/phase alignment issue?
A pair of PA130-8's are on order as well as a waveguide (PRV Audio WG16-25-B) for my PRV D280Ti CD. I think I want to try to make a high efficiency "Econotransient" speaker next. WMTMW using the two Beta 12cx's, the PA130-8 for mids, and the D280Ti for the highs. Probably push central freq higher up to 2kHz, the woofers might balk...
The waveguide is a 45 deg pattern and about 6in wide with 1200Hz min XO. I am hoping it has a nice integration or blend into the 5in PA310-8's frequency response and polar pattern wise. The XO freq may need fiddling with for a good match.
Last edited:
Yes Mr. Virginian, REWclause has got this functionality in his Java bag:

For this square wave log sweep of 5 seconds length was generated from 1kHz to 1.25kHz in Cool Edit, saved as 32bit integer wave. This was imported into REW; various shifting and windowing is applied to get square wave set to desired location and the 'A times B' function in options of 'All SPL' view used to convolve IR-1 with square wave for display.
Various window lengths and types may be used to focus in ways that combined with multiple microphone positions allow discrimination of baffle behavior, room reflections, and effects of filters. REW's EQ functionality allows selection of devices such as miniDSP, DCX2496 and others; these filters setting may be exported, then re-imported and A times B used to see what will happen when used live. John Mulcahy has done a lot of great work with this SW development; and he has received numerous feature requests, some expressing continued development for more convenient application of EQ filters.
XSim makes use of FR representation of a system's response for a convolution result as demonstrated by BYRTT; similarly SPICE implementations allow use of external filters/signal sources for getting the goods.
Barleywater,
I am not surprised that it can be done, and great to know. I am a bit slow so can you elaborate on the process again? Why is a swept square wave needed? Sounds tricky all that shifting in cooledit. Can I apply the window on the IR-1 data to remove reflections?
Thanks.
For this square wave log sweep of 5 seconds length was generated from 1kHz to 1.25kHz in Cool Edit, saved as 32bit integer wave. This was imported into REW; various shifting and windowing is applied to get square wave set to desired location and the 'A times B' function in options of 'All SPL' view used to convolve IR-1 with square wave for display.
I am not surprised that it can be done, and great to know. I am a bit slow so can you elaborate on the process again? Why is a swept square wave needed? Sounds tricky all that shifting in cooledit. Can I apply the window on the IR-1 data to remove reflections?
Thanks.
- Status
- Not open for further replies.
- Home
- Loudspeakers
- Multi-Way
- "Filler" driver ala B&O