More transconductance plots
Here are some more transconductance plots.
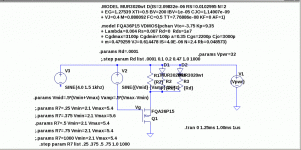
First is the LTSpice Circuit.
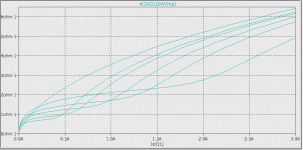
Second is an plot of output stage transconductance vs. drain current for a variety of values of the source resistor R7. From top to bottom on the right side of the plot the R7 values are: 1000, 1.0, 0.75, 0.5, 0.375, 0.25 ohms.
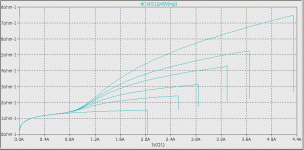
Third is a plot output stage transconductance vs. drain current for R7 = .5 ohms and a variety of resistance values Rd in series with the diodes. From top to bottom the values are: 0.0001, 0.1, 0.2, 0.47, 1.0, 1000 ohms.
Attachments
More curves
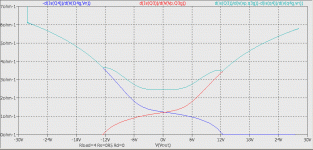
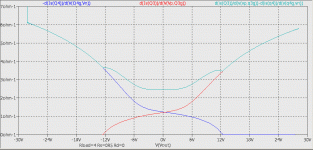
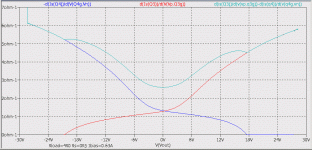
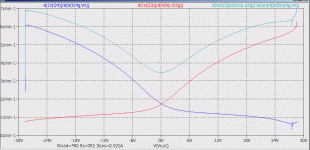
In a push-pull output stage, it is important to look at the combined transconductances of the P-fets and N-fets. I have generated such plots which I present here.
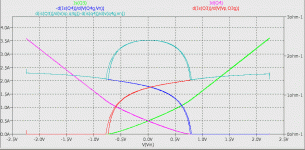
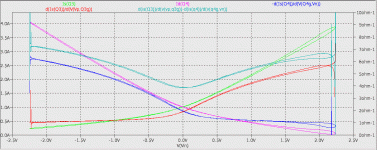
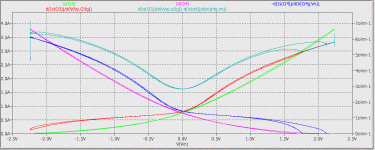
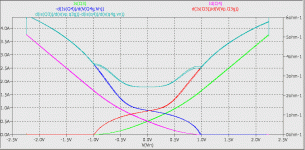
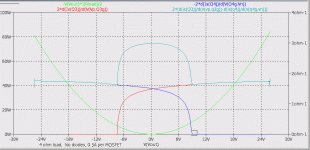
Each graph contains 5 curves:
Green and violet are the P-ch and N-ch device currents respectively.
Red and Blue are the P-ch and N-ch device transconductances resp.
Cyan is the sum of the device transconductances.
Multiply all of these curves by the number of MOSFETs on each rail.
The 1st curve is the F5 Turbo V2 at 0.5 amp bias per MOSFET.
The 2nd curve is the F5 Turbo V2 at 0.75 amp bias per MOSFET.
The 3rd curve is the F5 Turbo V2 at 1.0 amp bias per MOSFET.
The 4th curve is an F5 without the Turbo diodes at 0.5 amp bias per MOSFET.
The combined transconductance curve (Cyan) obviously benefits from higher bias.
The 4th curve clearly shows the "clunk" that occurs when the amp leaves class-A.
Attachments
Zoom function in Windows
This CTRL + + and CTRL + 0 is great.
Why did MS copy apple and adopt mouse control? Shortcuts were all the rage and I loved them way back. Lotus123 was all about shortcuts, your fingers remembered where to go to get the next operation up, far faster than using the mouse control system.
Thanks again to those that helped, by pointing "the way".
Zoom Function in MAC
The shortcuts work in Mac as well, we use the "command" button. So both OS copied each other.
Rush
This CTRL + + and CTRL + 0 is great.
Why did MS copy apple and adopt mouse control? Shortcuts were all the rage and I loved them way back. Lotus123 was all about shortcuts, your fingers remembered where to go to get the next operation up, far faster than using the mouse control system.
Thanks again to those that helped, by pointing "the way".
The shortcuts work in Mac as well, we use the "command" button. So both OS copied each other.
Rush
Question. What would happen if you removed the resistors? second question. How is the use of diodes different then putting a cap across the Rs?
If the resistors are removed, the only way to establish bias is through the diodes whose threshold is temperature sensitive. This means that if the bias is adjusted for "normal" operating temperature, as Nelson describes, then on cold startup there will probably be no current thru the diodes or MOSFETs, until a significant signal is applied. Horrible distortion too. Without the resistors in parallel with the diodes, it probably cannot be made temperature stable.
Let me augment my last post.
It might be possible to play games with the thermistors and their series resistors to track the diode temperature behaviour. I do not have enough experience with that to know if it could work.
It might be possible to play games with the thermistors and their series resistors to track the diode temperature behaviour. I do not have enough experience with that to know if it could work.
If the resistors are removed, the only way to establish bias is through the diodes whose threshold is temperature sensitive. This means that if the bias is adjusted for "normal" operating temperature, as Nelson describes, then on cold startup there will probably be no current thru the diodes or MOSFETs, until a significant signal is applied. Horrible distortion too. Without the resistors in parallel with the diodes, it probably cannot be made temperature stable.
Perhaps I have a bad understanding. Easily possible and happens all the time. The Mosfets are biased at the gates and 1a of current would flow through the diodes even without the resistors. The resistors are there to temper the response of the Mosfets. Diodes are used as Vref in other circuits, having an intrinsic resistance and Vdrop with current flowing through them. If I figure right, the diode has a resistance of about .6-7R if using the chart. It would seem like it would provide similar action all by itself. I know there is a reason I am wrong, just trying to figure it out.
What is different about using a diode vs a cap as Euvl eluded to?
I built a F5 Turbo about 2 years ago without thermistor or diode and do not have a problem with bias stability.
Just word of warning Nelson.
You better be going to work early and staying back late everyday over next few weeks.
Something is in the mail.
😀
Sorry Nelson. For some reason there is a prohibition of sending alcohol to the USA.
I will have to think of something else to send you.
I built a F5 Turbo about 2 years ago without thermistor or diode and do not have a problem with bias stability.
Are you referring to my response to buzzforb about totally removing the source resistors and passing all current through the diodes? That was the bias stability context that I was talking about.
Patrick,
Did you really tried to bypass the degeneration resistor with a cap, like in the cathode resistors for tube amps?
If this works, should also an array of led work ? Beside the fact that there will be no place to measure the bias.
D.
Did you really tried to bypass the degeneration resistor with a cap, like in the cathode resistors for tube amps?
If this works, should also an array of led work ? Beside the fact that there will be no place to measure the bias.
D.
Which Klunk-Klunk is better?
The second plot shows the output stage transconductances of a F5 Turbo V2 (With diodes) at low bias of 0.5A per MOSFET into a 4 ohm load. The transconductance increase smoothly up to about 70 watts where the opposite rail MOSFET turns off, creating a dip.
Of course the Turbo V1 bias could be increased to 1.5 amps per MOSFET in order to have 70 watts class-A but that would dissipate about 200 watts at idle.
The bottom line is
pure class-A no Klunk-Klunk, but power hungry
Class-B bad Klunk-klunk, less power
Turbo V2 no Klunk-Klunk if properly biased, less power
The first plot shows the output stage transconductances of a F5 Turbo V1 (No diodes) at low bias of 0.5A per MOSFET into a 4 ohm load. It is only capable of about 8 watts class-A.KLUNK!-!KNULK

The second plot shows the output stage transconductances of a F5 Turbo V2 (With diodes) at low bias of 0.5A per MOSFET into a 4 ohm load. The transconductance increase smoothly up to about 70 watts where the opposite rail MOSFET turns off, creating a dip.
Of course the Turbo V1 bias could be increased to 1.5 amps per MOSFET in order to have 70 watts class-A but that would dissipate about 200 watts at idle.
The bottom line is
pure class-A no Klunk-Klunk, but power hungry
Class-B bad Klunk-klunk, less power
Turbo V2 no Klunk-Klunk if properly biased, less power
Attachments
Just for my curiosity, reduce Rs to 0r22 and keep Vbias at 250mVdc.
How do the curves compare like that? with and without the diodes?
How do the curves compare like that? with and without the diodes?
I forgot to mention, that the previous curves are with 1R0 source resistors (not 0R5) with MOSFET bias of 0.5A.Just for my curiosity, reduce Rs to 0r22 and keep Vbias at 250mVdc.
How do the curves compare like that? with and without the diodes?
With the 0R5 source resistor it requires a lot more bias to get the kink out of the transconductance curve at low power levels.
Here is what the curve looks like with Rs=0R5 at 0.5A bias:
Attachments
It is the same as the first plot in post 542.Is this the same as post542?
Here are plots of transconductance with Rload=4R0 Rs=0R5. From left to right the bias currents per MOSFET are 0.5A, 0.63A and 0.925A.
Attachments
- Status
- Not open for further replies.
- Home
- Amplifiers
- Pass Labs
- F5 Turbo is posted
