If I have many traces in a file how do I copy all of the to clipboard?On any tabular data,you can right click, and select copy to clipboard, and then goto to EXCEL, paste the data.
One by one?
the PCB isI will try. Any suggestions for starting values?
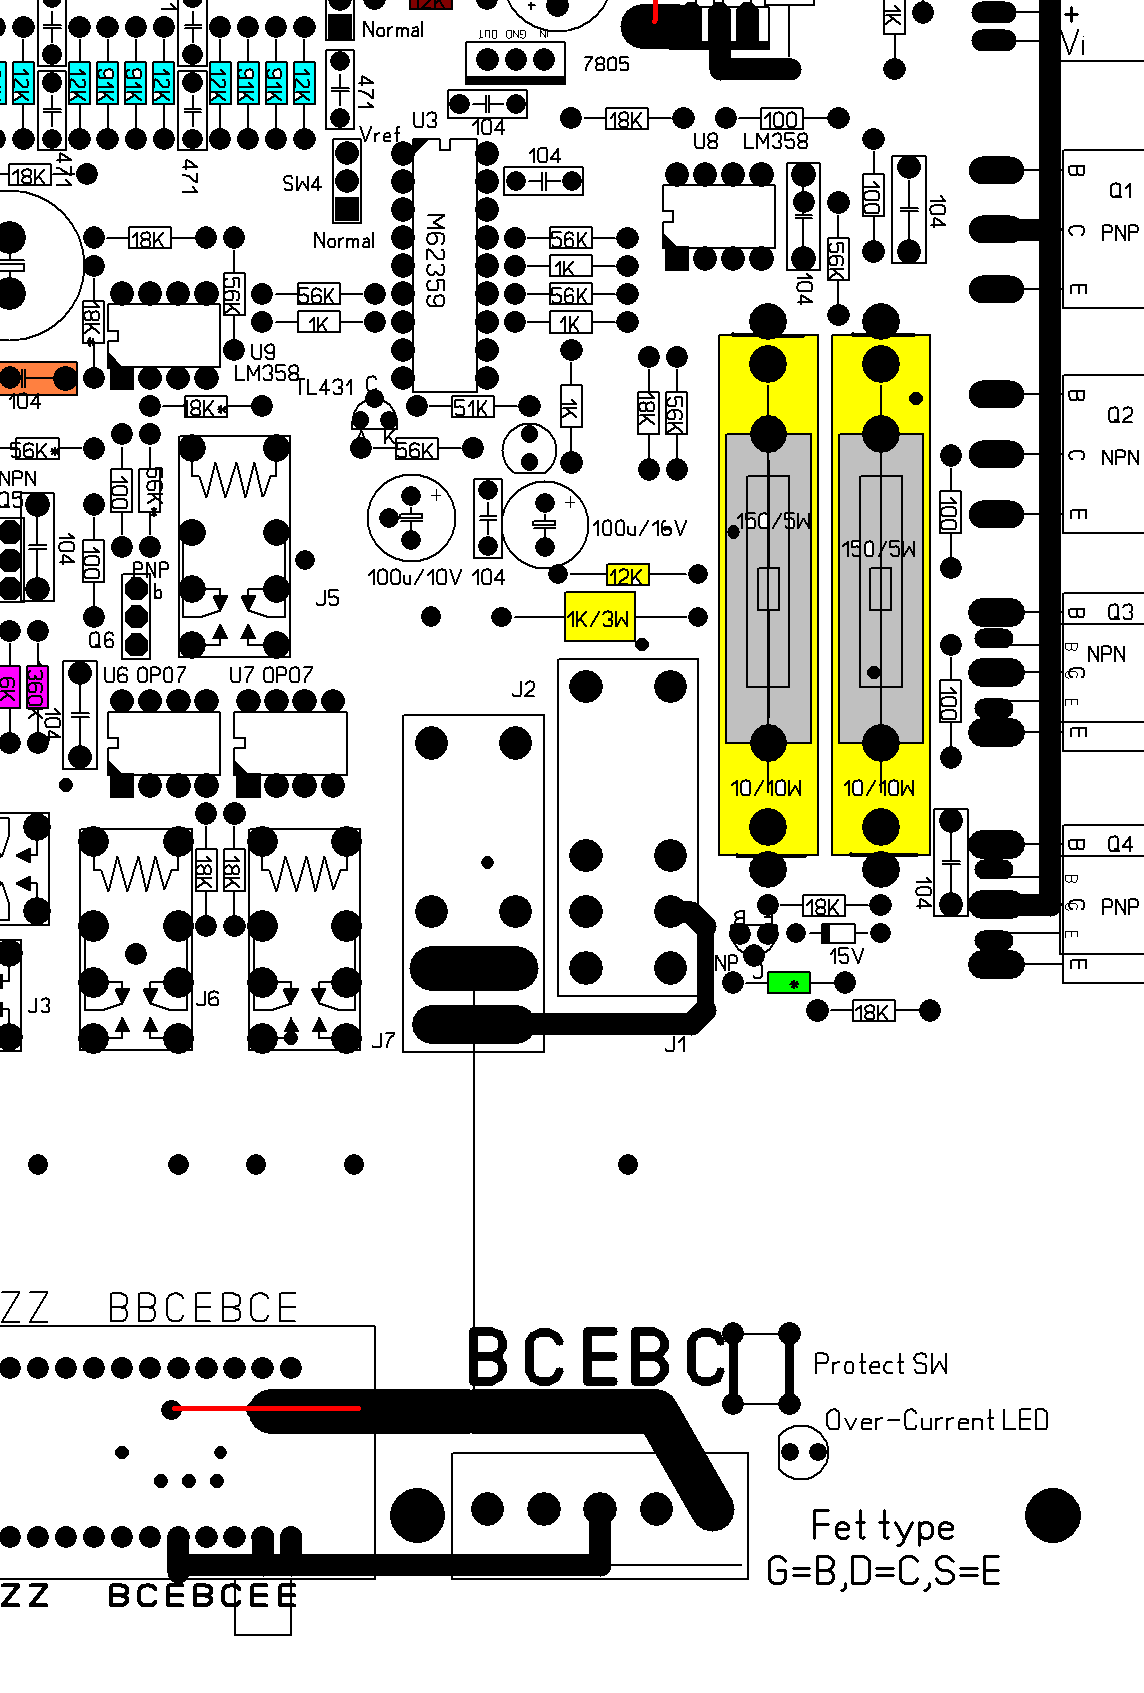
The protect circuit
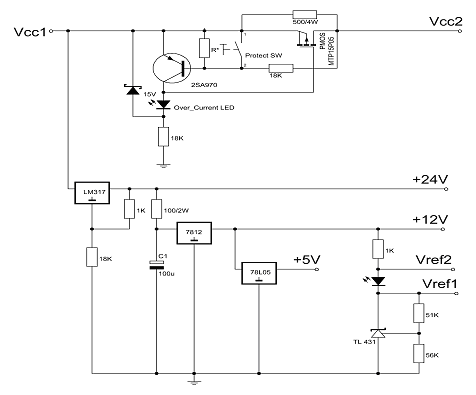
In circuit the 'R*' is the ‘Green’ color resistor on PCB picture
The Resistor of connect to 2SA970 base(18K) is Above 15V zener,SomeBoard may be 56K.
You can first remove the R *, and then measure the power transistor , large current Vce-Ic curve, you can see the curve turning point was the maximum protection current, and then according to the schematic calculate R*.
You need copy and paste one by one.If I have many traces in a file how do I copy all of the to clipboard?
One by one?
Or
You can use Excel to open the cuv file (File -> Open ->File type(All file))
The save file '.cuv' is txt type file and with ‘Tab-delimited’.
to NicMac:
measure FET ,you can insert G to B / S to E / D to C
and press 'Load Condition' button to load ‘N-JFET Vgs-Id(Fix Vce)’ measurement conditions,

The measurement conditions mean
1. It set Vb from -5V to 0V step 0.1V mean Vgs from -5V to 0V step 0.1V
2. Set constant Vce=10V mean Vds is fixed at 10V.
3. RB=6K mean Gate protect resistor choice 6K ohm
4. RC=75 mean drain current sample resistor is 75 ohm.
5. Imax=30mA mean measurement end at current reaches 30mA.
Hi locky_z,
I would like to find the Idss value. Is this where Vb=0 on the x-axis?
YesHi locky_z,
I would like to find the Idss value. Is this where Vb=0 on the x-axis?
However, due to the problem of measurement accuracy, there will be a few mV of error. When Vb=0,in fact Vb may be 5mV or -3mV,
So I suggest, If you want to measure Idss,you can short Gate & Source,and then put them into E socket. drain insert into C socket, and load 'NPN Vce-Ic' or 'NMOS Vds-Id' condition to measure.
Short gate and source of the JFET as a constant current diode,This ensures that Vgs = 0,
Because B socket is NULL, So the condition of 'Vce-Ic' or 'Vds-Id' can be considered a two terminal device that connect C & E measurement conditions,
After get the curve, It parallet to X-axis, the corresponding Y-axis is Idsss.
I know this is a construction site and I dont want to take away the fun and time you are spending building from scratch -- However, anyone can buy a complete with CRT readout curve tracer from China --- Brand: SMT MAX, Model CA4810A curve tracer. Looks like a compact version of the Tek 576 but is new and does some things the old Tek doesnt. I bought one via the Internet and have used it... If this Pc version ever makes it to commercial market status, I'd buy one built.
Last edited:
I know this is a construction site and I dont want to take away the fun and time you are spending building from scratch -- However, anyone can buy a complete with CRT readout curve tracer from China --- Brand: SMT MAX, Model CA4810A curve tracer. Looks like a compact version of the Tek 576 but is new and does some things the old Tek doesnt. I bought one via the Internet and have used it... If this Pc version ever makes it to commercial market status, I'd buy one built.
As far as I can see what you're talking about is about 9 times the price, weighs 13 kg (not to mention the shipping cost), and draws analog curves on a CRT screen...
On the plus side, it goes HIGH 😱 in voltage
The DIY curve tracer for PC does this digitally, (allowing printing, exporting, comparing, etc...), needs 5 minutes to setup, and weighs 2 kg
I think we're comparing carrots and potatoes here.
connect a PC with a CRT monitorHow difficult would it be to convert the curve tracer to a scope/crt readout?
sam

No PC.
From the curve tracer to an analog Oscilloscope.
I have an Tek 2465 that I would like to interface to the CT.
sam
From the curve tracer to an analog Oscilloscope.
I have an Tek 2465 that I would like to interface to the CT.
sam
As far as I can see what you're talking about is about 9 times the price, weighs 13 kg (not to mention the shipping cost), and draws analog curves on a CRT screen...
On the plus side, it goes HIGH 😱 in voltage
The DIY curve tracer for PC does this digitally, (allowing printing, exporting, comparing, etc...), needs 5 minutes to setup, and weighs 2 kg
I think we're comparing carrots and potatoes here.
If evey test and control equipment needed a PC, I would have to use several PC's to run my tests and experiments. I already have one PC dedicated to data acqusition and control of an Audio Precision instrument. Then I would need another to test transistor characteristics and another PC for measurements and another for waveform generation and another for ??? When running a lab experiment or doing R&D on a system, dedicated test equipment is better/more practicle even if more expensive. BTW this crt model will display two devices at the same time on the screen. Great for matching/comparing transistors.
Look, I understand all the pro's of using a pc to control a piece of equipment and locky's Curve tracer looks like a great piece of test equipment, will probably end up getting one.
In the meantime I simply want something like locky's that stores the info ,quick set-up
and interfaces to the X Y inputs of my scope. I love to see a smooth trace on a CRT.
I've used Heathkits and Tektronix curve tracers in the past and they worked great but
they take some time to set up and can't retrieve or store any info.
I'm scope poor,I have the Tektronix 7000 series,2465, HP1740A,41 etc.
Like RNMarsh said, you have two channels for matching.
sam
You also run all software on one PC. so your desktop will be more simple.If evey test and control equipment needed a PC, I would have to use several PC's to run my tests and experiments. I already have one PC dedicated to data acqusition and control of an Audio Precision instrument. Then I would need another to test transistor characteristics and another PC for measurements and another for waveform generation and another for ??? When running a lab experiment or doing R&D on a system, dedicated test equipment is better/more practicle even if more expensive. BTW this crt model will display two devices at the same time on the screen. Great for matching/comparing transistors.
My device can't measure two transistor at same time,but you can measure them one by one.
The screen will show all curve in a screen,you can match them by the curve on screen.
One screen contail more 500 curve.
The device Measurement is very flexible.
It allows user-defined measurement curve, for example, can be measured Vce-Ic, a Vbe-Ic, Hfe-Ic, Ib-Ic, and even can be measured three-terminal regulator, Vi-Vo, Io-Vo, and also somecharacteristics of the circuit module, such as the transmission linear of the current mirror.
calibrating the device after replacing resistors
I would very much like a detailed description of how to calibrate the curve tracer after replacing one or more of the current sinking and sourcing resistors.
Locky_Z gave some information a few posts back, but the method does not work for me.
I would very much like a detailed description of how to calibrate the curve tracer after replacing one or more of the current sinking and sourcing resistors.
Locky_Z gave some information a few posts back, but the method does not work for me.
For those who can read simplified Chinese :
¡¾Ô*´´¡¿ÍòÄÜ°ëµ¼Ìå²âÁ¿µç·(6Â¥¸üÐÂ) - ÒôÏìDIYÂÛ̳ - HIFIDIYÂÛ̳ - Powered by Discuz!
and some interesting measurements of Toshiba Dual FETs :
¾Ý˵ÓÃK389/J109ÂÏÉú³¡Ð§Ó¦¹Ü×öÊäÈë²¢²»ºÃ£¬ÊÇÂ𣿠- ÒôÏìDIYÂÛ̳ - HIFIDIYÂÛ̳ - Powered by Discuz!
Patrick
I just hit my Translate program key and all is now in English... no problem!
Locky_Z,
is it correct that if I measure at low voltages the supply voltage only needs to be 24V + the LM317 dropout voltage (about 2.7V) i.e. > 27V?
is it correct that if I measure at low voltages the supply voltage only needs to be 24V + the LM317 dropout voltage (about 2.7V) i.e. > 27V?
Another question.
I am measuring Id->Vgs @ constant Vce.
I'm pushing the tracer a bit measuring up to 4.1A using a laboratory power supply supposedly good for 5A. I have modified the current limiting circuit to permit the measurements and it does not trigger.
Everything looks fine and data are reproducible. However, when I inspect the curve data I have noticed that Vce is only constant up to about 2A after which it drop down to arrive at about 5-6V at 4A ?!?
What is causing this?
I have tried with a 10A PSU but it does not improve/change anything.
Cheers,
Nic
Yes,Locky_Z,
is it correct that if I measure at low voltages the supply voltage only needs to be 24V + the LM317 dropout voltage (about 2.7V) i.e. > 27V?
But I suggest the voltage as high as possible.
Because the voltage output by power amplifier,the amp sink and source voltage drop more than 2.5V,so the ‘output voltage swing’ less ‘Vcc-5V’.
Second, the DUT voltage drop and RC voltage drop must less voltage output swing, The voltage drop of RC across the higher, the higher the measurement accuracy.
1.The more current, Amp sink/source voltage drop may increase,you need to increase the parameter "Options->config->Volatge drop(sink) , Voltage drop(source)" ,Increase them. the ‘output voltage swing’ may reduce.Everything looks fine and data are reproducible. However, when I inspect the curve data I have noticed that Vce is only constant up to about 2A after which it drop down to arrive at about 5-6V at 4A ?!?
What is causing this?
I have tried with a 10A PSU but it does not improve/change anything.
2.When current increase,the voltage drop of RC increase,system may adjust the amplifier output,try to keep Vce constant, But the DUT Vce + VRC is less ‘output voltage swing’, so when current more high,the Vce can't keep constant.
- Status
- Not open for further replies.
- Home
- Amplifiers
- Solid State
- DIY Curve Tracer for PC