Not sure what you are arguing about here. A log sweep analysed by constant width FFT will give decreased level with 10 dB/decade. It's just the method making this.
Not sure what you are arguing about here. A log sweep analysed by constant width FFT will give decreased level with 10 dB/decade. It's just the method making this.
I know an artifact of the processing, the amplitude of the sine wave does not go down 10dB/decade. It just adds a level of confusion it's easy to configure a general purpose tool to give instantaneous amplitude and frequency as I just showed. BTW it also used constant width FFT's just taking the level of the peak bin. The 960 point FFT represents 10ms, the sweep is slow enough in this case the energy stays within a bin or so.
The tool should do all the work, having to draw lines on a plot and eyeball the difference is silly. Whatever Audacity does when you select the entire waveform of a sweep and ask for the spectrum is the wrong answer.
Last edited:
I know an artifact of the processing, the amplitude of the sine wave does not go down 10dB/decade. It just adds a level of confusion it's easy to configure a general purpose tool to give instantaneous amplitude and frequency as I just showed. BTW it also used constant width FFT's just taking the level of the peak bin. The 960 point FFT represents 10ms, the sweep is slow enough in this case the energy stays within a bin or so.
The tool should do all the work, having to draw lines on a plot and eyeball the difference is silly.
Ok understood it is a method related discussion. I usually do the correction needed when I analyze PN to get linear response.
Ok understood it is a method related discussion. I usually do the correction needed when I analyze PN to get linear response.
And white noise is flat, tools setup for noise analysis (overlap and add FFT averaging) will give the wrong answer on a swept frequency. Noise has all frequencies all the time. This was not worth an argument Audition etc. all give the same wrong answer because they are asked the wrong question.
EDIT - A fine point, they also seem to exaggerate the effects of platter eccentricity no idea why and not worth investigating.
Last edited:
It also misleads when one is considering physical mechanisms in play: it's wrong to report that rms stylus velocity of a sweep falls at -10dB/decade because it doesn't - but the report says it does...………….
LD
LD
Last edited:
Almost, but one then implicitly relies upon accuracy of the sweep...…….and besides the whole graph needs tilting and re-labelling.It's just the method making this.
LD
Apologies to Hans for making this an argument but I want a tool that works for any sweep rate removing as many variables as possible. I would not choose the overlap and add FFT method on a non-stationary signal. Letting a tone spin down, for instance, gives gives an unknown sweep rate. BTW the same problem shows up with one huge FFT, unfortunately the frequency resolution is so high everything shows up.
Last edited:
That's the crux IMO. It opens doors.I want a tool that works for any sweep rate removing as many variables as possible.
LD
I have stuck a memo on my pc screen frame. Pls confirm the content is correct:Not sure what you are arguing about here. A log sweep analysed by constant width FFT will give decreased level with 10 dB/decade. It's just the method making this.
"FFT: Bins are of constant width in frequency.
RTA: Bins are of constant width in octave.
White noise: Equal energy per Hz bandwidth.
Pink noise: Equal energy per octave bandwidth.
Consequently,
Linear sweeps and white noise appear as:
Flat on FFT
Rising at 3dB/oct (10dB/decade) on RTA
Log sweeps and pink noise appear as:
Dropping at 3dB/octave (10dB/decade) on FFT
Flat on RTA"
Next, I hope Scott will make his method public in a way that I can understand how to implement it. 🙂
George
Next, I hope Scott will make his method public in a way that I can understand how to implement it. 🙂
I sent it to JP for comment, there is an issue around trimming the file so there are no problems. "Stretching" spot frequencies and piecing the plot together is the only practical way of eliminating the cutter from the equation without exotic optical, etc. equipment IMO.
No need to be shy about discard of rogue timeslices, and there's a place for interpolation. Should work with spots in principle...….I sent it to JP for comment, there is an issue around trimming the file so there are no problems. "Stretching" spot frequencies and piecing the plot together is the only practical way of eliminating the cutter from the equation without exotic optical, etc. equipment IMO.
LD
Almost, but one then implicitly relies upon accuracy of the sweep...…….and besides the whole graph needs tilting and re-labelling.
LD
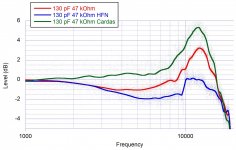
Yes, the accuracy of the sweep affects; but in my hands most of them differ between each other even if I measure amplitude directly. Comparison to some fixed frequencies I can say that some sweeps and wihte/pink noises are better than others. Below is pink noise on three records corrected for slope. Red = Ultimate Analogue test LP, Blue= HFN test LP and Green=Cardas test LP.
So to know, I would say one must measure a lot of records with fixed fr, sweeps, noise and then try to judge from that. Looking at different tests from magazines, one can see very different frequency responses from the same cartridges. Probably they used different records and which one to trust?
Attachments
Probably they used different records and which one to trust?
That's what we are trying to determine. You have to admit 5dB of difference might matter though I think +-0.1dB RIAA conformance is beyond what is necessary.
Last edited:
That's what we are trying to determine.
Below is a comparison of pink noise (corrected) with fixed frequencies on the Ultimate Analogue test record. Some differences but are basically agreeing. So a fixed frequencies from trusted records is IMO the best source of reference to evaluate how sweeps and noises perform. My results so far of those I have:
Ultimate Analogue test record: Good fixed f, ok pink noise above 1 kHz
Elipson test record: Good fixed f, good white noise, ok pink noise
Deviations found on these, not acceptable IMO:
Tacet record:
HFN record.
Cardas test record
Ortofon test record
Attachments
Doesn't the radius of the sweep track come into it? I presume that the various test records have their sweep and noise tracks at different positions on the side.Yes, the accuracy of the sweep affects; but in my hands most of them differ between each other even if I measure amplitude directly. Comparison to some fixed frequencies I can say that some sweeps and wihte/pink noises are better than others. Below is pink noise on three records corrected for slope. Red = Ultimate Analogue test LP, Blue= HFN test LP and Green=Cardas test LP.
It would be curious for spots, because there would be many amplitude results with the same f point, and a statistical spread.Should work with spots in principle...…
I wonder what that variation would be? Ever curious.
But this effect probably means it won't work for spot tones.
LD
It would be curious for spots, because there would be many
The more samples available with the same nominal freq the better for f determination. All statistical tools at your hands.
It’s only the “give me a single number, any number” guys that will object to this.
All this is an intellectual exercise we (*) enjoy doing, isn't it?
George
(*) You enjoy doing, I enjoy watching 🙂
I dare say we are heading into uncharted territory here (here be dragons). I've not enough time at the moment to actually keep ontop of this but it looks fun 🙂
Doesn't the radius of the sweep track come into it? I presume that the various test records have their sweep and noise tracks at different positions on the side.
I think it is just records with different QC standards. The one I don’t have is the Clearaudio test record that according to some I know is good quality. It is a copy of the old JVC TRS1007.
Right George, that's it.I have stuck a memo on my pc screen frame. Pls confirm the content is correct:
"FFT: Bins are of constant width in frequency.
RTA: Bins are of constant width in octave.
White noise: Equal energy per Hz bandwidth.
Pink noise: Equal energy per octave bandwidth.
Consequently,
Linear sweeps and white noise appear as:
Flat on FFT
Rising at 3dB/oct (10dB/decade) on RTA
Log sweeps and pink noise appear as:
Dropping at 3dB/octave (10dB/decade) on FFT
Flat on RTA"
Next, I hope Scott will make his method public in a way that I can understand how to implement it. 🙂
George
We can try to make new definitions how to present information, but we can't change physics.
Take an exponential sweep that goes with A sec per decade.
So going from 1kHz to 100kHz takes 2*A sec.
Now take an FFT of the signal with bin widths of 1kHz.
The first bin goes from 1kHz to 2kHz
The time duration of the signal in bin1 will be 0.3A sec, in the second bin 0.18A sec and so on.
This first bin represents the energy at the logarithmic halve between 1kHz and 2kHz, which is 1.32kHz.
Now we have to find the time duration of the signal going into a bin at ten times this frequency, being 13.2kHz.
Calculation gives a value of 0.03A sec or 10 times shorter in time.
But since FFT bins do collect energy, the energy for a signal with constant amplitude collected in 1/10 of the time is 10*log(1/10)=10dB/decade.
Hans
- Status
- Not open for further replies.
- Home
- Source & Line
- Analogue Source
- Cartridge dynamic behaviour