That won’t be easy, because you are not looking at one frequency but a bin of several at the same time.Not to run ahead, but there's also opportunity to report harmonic distortion versus f in an accurate way. In each timeslice, we already determine fundamental f, of course, so we know exactly where to look for harmonics from the same timeslice/FFT.
As well as discarding harmonics for the purpose of measuring fundamental, we could separately measure/report harmonics, if we choose.
That might be revealing of many physical performance params, such as stylus geometry, tracing error, alignment, etc etc.
Lots of doors open with Scott's method.
LD
So when looking from 1kHz to 2kHz, the 2nd harmonics lies at 2 to 4kHz and the 3rd between 3 and 6kHz.
So unless you are using bins that get wider the same rate as the frequency, this won’t work to my opinion, unless you look at every individual frequency before calculating the average level of a bin
Hans
Last edited:
No, f range in each time slice is narrow so fundamental falls into one or few bins. So do harmonics and that permits discrete and unique measurement associated with that narrow f range. LDThat won’t be easy, because you are not looking at one frequency but a bin of several at the same time.
So when looking from 1kHz to 2kHz, the 2nd harmonics lies at 2 to 4kHz and the 3rd between 3 and 6kHz.
So unless you are using bins that get wider the same rate as the frequency, this won’t work to my opinion, unless you look at every individual frequency before calculating the average level of a bin. Od
Hans
No, f range in each time slice is narrow so fundamental falls into one or few bins.
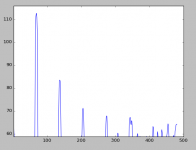
The flat top window maximizes the accuracy of amplitude but gives up a little frequency resolution, here the width is 2-3 bins. The harmonics are still where they should be. This plot is one 10ms slice at around 6800Hz (f/100 on the plot), JP's sweep again. Things get a little tight at the high frequency end, but still looks good here. Work in progress.
Attachments
Scott,
I had an understanding problem to what extend harmonics from a sweep are meaningful, since the signal is never steady but changing in frequency all the time.
Therefore I made a sweep over exactly the same freq. span from 1kHz to 50kHz, over the same time of 28.4 sec with the same 16mV rms as JP's sweep.
From both sweeps I took the same 10msec time slice around 6800Hz as you did.
The first two harmonics from JP's sweep fit perfectly with your image at resp. -30dB and -44dB below the main lobe. Further on there are some differences.
The mathematically generated sweep on the other hand shows no harmonics at all.
So what you are trying to achieve is to really reveal hidden information.
Great idea.
Hans
P.S. Eventually you could also extract the surface noise level from the record as you can see in my images.
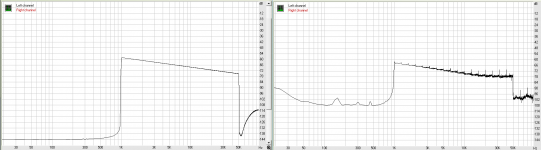
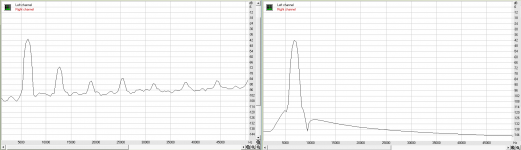
Attachments
Last edited:
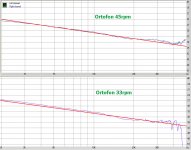
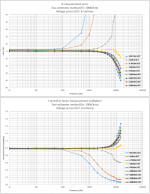
I've played the Ortofon test record at 45rpm, now theoretically going to 67.5kHz.
In the image below, the same channel is shown for 33 1/3 and 45rpm, both going to 50kHz.
The ups and downs near 50kHz in the 33 1/3rpm recording, are now shifted to outside the 50kHz region, that's why I stopped the image at 50kHz, proving to my opinion that those jaggies are to be attributed to the record and not to my cart.
My conclusion is that the CH precision record is very good, but only going to 30kHz and it's not CV recorded.
The Ortofon is CV recorded and of reasonable quality, but I'm not really impressed.
By far the best record seems the one that JP used, CV recorded and flat to 50kHz without anomalies.
Question is whether this record is still avalable ?
Hans
Attachments
We could, to an extent, examine if/how noise floor changes with the fundamental tone f...…...which correlates to trackability stress for CV. Many doors open. Good to see you're getting into it, Hans. LDEventually you could also extract the surface noise level from the record...……..
Last edited:
We could, to an extent, examine if/how noise floor changes with the fundamental tone f...…...which correlates to trackability stress for CV. Many doors open. Good to see you're getting into it, Hans. LD

@Bill,
Do you or anybody else see by any chance the possibility to get more measurements from your Ortofon OM super Cart.
I would like to finalize my part in finding the best fitting replacement circuit.
What I’ve now is based on only a few points measured by dear George.
If possible I would like to have at least one point per octave from 1 kHz up to 1MHz, some 11 complex data points.
Hans
Hi Hans,
I'm not going to be able to do it for a while. Backlog is down from 22 years to 4 but i'd have to build a test set from scratch. I do have spare cart bodies if anyone does have a suitable test jig.
I'm not going to be able to do it for a while. Backlog is down from 22 years to 4 but i'd have to build a test set from scratch. I do have spare cart bodies if anyone does have a suitable test jig.
Hi Hans
In a few days I am expecting an EMU-0404 soundcard that Mogens (mkc) kindly has donated to the cause. I hope with this I can provide complex impedance data up to 96kHz.
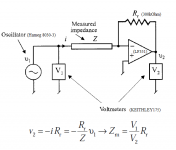
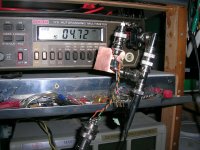
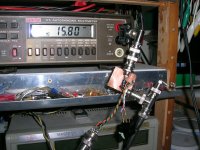
Meanwhile, I am struggling with a simple diy self balancing bridge to get Z modulus data.
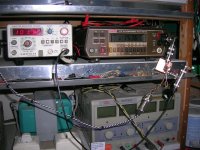
I am manually measuring up to 150kHz (every 10kHz above 10kHz) just to cover the resonance area.
In the weekend I will post results.
Phase data is a problem. Only calculating from Lissajous figures, but this is not that a precise method.
George
In a few days I am expecting an EMU-0404 soundcard that Mogens (mkc) kindly has donated to the cause. I hope with this I can provide complex impedance data up to 96kHz.
Meanwhile, I am struggling with a simple diy self balancing bridge to get Z modulus data.
I am manually measuring up to 150kHz (every 10kHz above 10kHz) just to cover the resonance area.
In the weekend I will post results.
Phase data is a problem. Only calculating from Lissajous figures, but this is not that a precise method.
George
Thank you George.Hi Hans
In a few days I am expecting an EMU-0404 soundcard that Mogens (mkc) kindly has donated to the cause. I hope with this I can provide complex impedance data up to 96kHz.
Meanwhile, I am struggling with a simple diy self balancing bridge to get Z modulus data.
I am manually measuring up to 150kHz (every 10kHz above 10kHz) just to cover the resonance area.
In the weekend I will post results.
Phase data is a problem. Only calculating from Lissajous figures, but this is not that a precise method.
George
I'll be happy to see your results.
Hans
I can go up to 3MHz, but not with extreme accuracy, so may be we can complement each other.Hi Hans
In a few days I am expecting an EMU-0404 soundcard that Mogens (mkc) kindly has donated to the cause. I hope with this I can provide complex impedance data up to 96kHz.
Meanwhile, I am struggling with a simple diy self balancing bridge to get Z modulus data.
I am manually measuring up to 150kHz (every 10kHz above 10kHz) just to cover the resonance area.
In the weekend I will post results.
Phase data is a problem. Only calculating from Lissajous figures, but this is not that a precise method.
George
Hans
but not with extreme accuracy,
I don't support extremities 😀
George
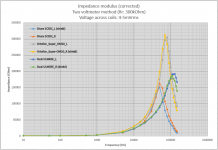
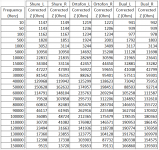
The spot freq "Z modulus" manual measurements for the three cartridges of Bill
George
George
Attachments

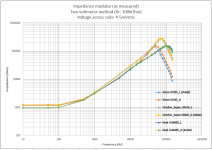
George,The spot freq "Z modulus" manual measurements for the three cartridges of Bill
George
Great job, thank you.
Unfortunately because I need to be able to the extract the complex value of the |Z| you measured, I can't use this info.
Hans
Thanks Hans.
I understand.
I would also love to extract phase data too but with my equipment it’s not that easy (or reliably feasible at that low signal level).
George
I understand.
I would also love to extract phase data too but with my equipment it’s not that easy (or reliably feasible at that low signal level).
George
I think there is still a lot of interesting information there. I need to print it out and have a think.
First impression of those graphs is that the Ortofons are behaving like ideal inductors, with exact x10 for every decade, while the Shure and Dual show signs of falling inductance with frequency in the 1kHz to 5kHz region, with stable value above this.
- Status
- Not open for further replies.
- Home
- Source & Line
- Analogue Source
- Cartridge dynamic behaviour