The only difference between men and boys is ......😀 😀 😀I hope so.
I am more than grateful to Mogens
George

Have lots of fun with it.
Hans
Interesting result for the day. I tried the time slice method on the harmonics and got a similar result (as LD) on JP's file so I went back to my file where I let the 3150kHz tone on the Adjust + LP freely spin down from ~5kHz to 500Hz. The distortion was flat (pretty good BTW for my not so expensive Grado, ~-48dB 2nd's and ~-60dB 3rd's) which is interesting in that the stylus groove geometry would appear to be the sole cause of the distortion.
Very low distortion figures for vinyl.
At what level is this 3150Hz recording Scott?
George
IIRC -20dB so lowish.
OK, thanks
One in my "to be done" list is, to test the generator section of the cart for distortion vs level and vs freq
George
One in my "to be done" list is, to test the generator section of the cart for distortion vs level and vs freq
George
Interesting result for the day. I tried the time slice method on the harmonics and got a similar result (as LD) on JP's file so I went back to my file where I let the 3150kHz tone on the Adjust + LP freely spin down from ~5kHz to 500Hz. The distortion was flat (pretty good BTW for my not so expensive Grado, ~-48dB 2nd's and ~-60dB 3rd's) which is interesting in that the stylus groove geometry would appear to be the sole cause of the distortion.
Interesting that the distortion remains stable while level drops when slowing down. The conclusions seems correct that the only cause can be the distortion in the record itself.
That however immediately raises the question how to interpret this test in other occasions like JP’s recording.
Hans
In a spin down test of a monotone sine, geometric relationship between stylus and groove remains constant. For example pinch effect or tracking angle offset error. Velocity and cartridge output drops with rpm along with frequency, and harmonic distortion remains a constant fraction of fundamental level - in principle at least and that seems to be as Scott reports.Interesting that the distortion remains stable while level drops when slowing down. The conclusions seems correct that the only cause can be the distortion in the record itself.
That however immediately raises the question how to interpret this test in other occasions like JP’s recording.
Hans
In contrast, JP's sweep is constant velocity. So geometry between stylus and groove changes as the groove shape becomes compressed along the linear axis with increasing frequency. Errors such as pinch effect and tracking angle offset error etc etc therefore increase with frequency, whereas fundamental level stays constant. And harmonic distortion increases as a fraction of fundamental level with increasing f.
The nature of the harmonic distortion law for the CV sweep is interesting and unexplained, whereas I think one can readily get that Scott's run-down sweep follows a flat law because stylus-groove geometry doesn't change. But that's an interesting observation in itself, because it means nothing else is in-play other than geometry.
Lastly, the synthetic sweep you generated doesn't show 2nd or 3rd harmonic distortion. And that's an interesting control test for JP's real sweep, because it shows the continuously shifting f doesn't introduce harmonic distortion itself - at least to any notable extent.
So this harmonic test method versus f is straightforward for CV sweeps, or for RIAA sweeps accepting that as it relates to constant programme level.
LD
Last edited:
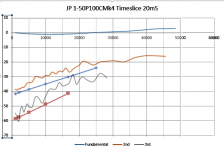
Here's my equivalent of LD's plot #1208. I used log/log but the basic wiggles seem to be close. The effective smoothing is different but I don't think it fundamentally matters, I notice a 6dB difference in the relative harmonic levels so I will use another program to calibrate and try to find where the discrepancy comes from. Even if we don't end up with a DIY test LP we can add this to our open source analysis package.
Attachments
Is it correct that looking at 10kHz, that at this point the 2nd at -33dB and the 3rd harmonics at -50db are belonging to the base frequency of 10kHz ?Here's my equivalent of LD's plot #1208. I used log/log but the basic wiggles seem to be close. The effective smoothing is different but I don't think it fundamentally matters, I notice a 6dB difference in the relative harmonic levels so I will use another program to calibrate and try to find where the discrepancy comes from. Even if we don't end up with a DIY test LP we can add this to our open source analysis package.
In that case the second harmonic goes to 25kHz and the third to 16.7 kHz, right ?
Or do we have to read it differently and say the 2nd harmonic at 10kHz belongs to 5kHz base and the third harmonic at 10kHz to the 3k3kHz base ?
Assuming that the first one is true, I tried to match the distortion curve with an exponential curve.
Slightly adjusted from my earlier estimate, I have now used in the image below for the 2nd harmonic exp(freq/11800)/130 and for the 3rd harmonic exp(freq/7800)/1000.
Second going to 25kHz and the third to 16,7kHz.
Hans
Attachments
Is it correct that looking at 10kHz, that at this point the 2nd at -33dB and the 3rd harmonics at -50db are belonging to the base frequency of 10kHz ?
In that case the second harmonic goes to 25kHz and the third to 16.7 kHz, right ?
Right the frequency axis goes with the fundamental, I guess there are several confusing ways to present the data. 🙂
Thx, it mostly confirms the method and I think this might emerge as a useful performance indicator. For example, it should reflect stylus profile and alignment, and perhaps wear...…..?I notice a 6dB difference in the relative harmonic levels so I will use another program to calibrate and try to find where the discrepancy comes from. Even if we don't end up with a DIY test LP we can add this to our open source analysis package.
Fortunately, it works for any sweep -and the action is with fundamentals in the audioband so conventional audioband sweeps should do it though CV is best.
Can't explain the 6dB difference. I used a Blackman window but don't think that should matter...…….?
LD
Can't explain the 6dB difference. I used a Blackman window but don't think that should matter...…….?
LD
I just sampled a wider portion (500ms) to average out more noise around 5k with a Blackman-Harris window and Audition and got within 1dB of my original answer. I'm sure we can work out the discrepancy, reminds me of "why is it root 2qI for current noise ?". You are correct it is all relative so the window should not matter.
This is a plot of the 3150Hz tone on the Adjust + spun up and allowed to spin down with the latest version. One could speculate that the seconds are going up at high frequencies but there is not enough data yet to make any conclusions. This had RIAA, I didn't bother to factor any corrections (which will be another round of fussing with code).
Attachments

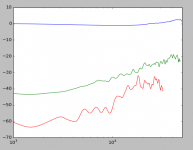
LD,I've been working on recreating Scott's SW method, and playing about to see what's possible. Here's the first attempt at using it to look at 2nd and 3rd harmonic distortion versus f using JP's 1 - 50kHz sweep file.
Rough at the moment and will improve, but bodes well.
LD
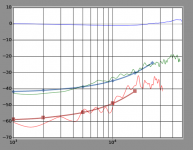
When applying the same two exp(freq/k)/l functions that fitted quite well in Scotts distortion image, I get the imaged results below.
Your distortion figures are higher, but looking at Scotts image where distortion is shown at 6800Hz, at resp ca. -30dB H2 and -44dB H3, perfectly corresponding with LTSpice in the posting directly below, I get the feeling that your image is more correct after all.
Cartridge dynamic behaviour
Hans
Attachments

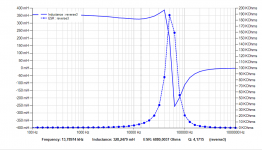
Just as a first test to check everything, here the inductance of the AT150MLX with 4.5mV applied.🙂
Note to George: None of these are recent purchases 😀
Hans
Attachments
I found the 6dB shift, I was finding the peak harmonic bin but taking the value of 2 bins over which amounts to a ~6dB shift down, it was a factor of 2 after all. The difference now is just noise.
I think you got it wrong.🙂🙂
Note to George: None of these are recent purchases 😀
I don’t mind about the timing or the recency of your actions. I care about the reasoning of your purchases.
Note. My younger daughter is an impulsive shoes buyer, a classic symptom of “a missing father absence” AND she is studying psychology. (that’s a heavier trait of my bad influence on her).
I know that by tomorrow, I will have regretted that I made it public (but we are only human)
George
- Status
- Not open for further replies.
- Home
- Source & Line
- Analogue Source
- Cartridge dynamic behaviour