I'm being dim again (it is monday). The superOM, which on paper has a 'better' inductor in its generator has a far higher resonant peak. I'm not convinced this is a good thing?
GeorgeFor those that are interested, a more detailed view of the same data.
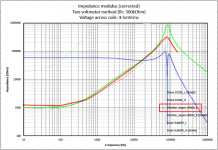
Corrected Z Modulus in linear scale and tabulated data.
George
I projected my initial wild guess for the resonance peak frequency and magnitude for the Ortofon OM10 in green on your measured result in red.
That's important information, which as it seems corresponds quite well to your measurement.
That's good to know, will save me quite some time.
In the same image you can see in blue the corresponding Reactance, here multiplied by a factor 1e5 for the purpose of bringing it on the same scale.
But to dissect the Cart into its individual parts, going from green to blue, it's obvious that I need more information.
Sorry if I expressed myself a bit rude when saying that I couldn't use your measurements for this purpose, it was not meant to be so and after all your resonance peak turns out unexpectedly to be vey helpful.
Hans
Attachments
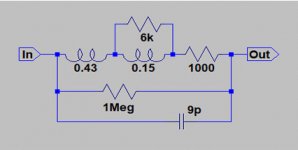
I honestly don't think this has anything to do with good or bad, it's simply the combination of resonance between the inductor and the parallel 9pF cap, limited in magnitude by the 1Meg resistance.I'm being dim again (it is monday). The superOM, which on paper has a 'better' inductor in its generator has a far higher resonant peak. I'm not convinced this is a good thing?
Hans
Attachments
Last edited:
Hi Hans
No worries. There was nothing in your post that should make you worry.
As I wrote, I understand that the lack of phase data hinders the modeling.
At least, it's good that Z modulus data fits the model you have built.
By the end of the week I may be able to show freq sweep impedance data up to 96kHz (Mogens's soundcard arrives tomorrow)
George
Hi George,
Given your last comment I assume you have heard from the postal service? I checked track and trace today and there do not seem to have been any movement since Wednesday last week.
Mogens
Given your last comment I assume you have heard from the postal service? I checked track and trace today and there do not seem to have been any movement since Wednesday last week.
Mogens
I honestly don't think this has anything to do with good or bad, it's simply the combination of resonance between the inductor and the parallel 9pF cap, limited in magnitude by the 1Meg resistance.
Hans
I meant from the point of view of having an optimised phono stage is a lower Q resonance better? I not that the super OM and SC35 track despite very different generator designs but the the solid pin OM (dual) could be considered to have preferable high frequency behaviour.
It's interesting stuff even if it makes little difference to the end output 🙂
and there do not seem to have been any movement since Wednesday last week
On the surface 😀
Beneath it, things are moving sloowwllyy 😀😀
George
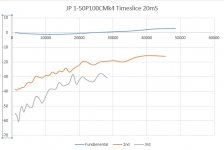
I've been working on recreating Scott's SW method, and playing about to see what's possible. Here's the first attempt at using it to look at 2nd and 3rd harmonic distortion versus f using JP's 1 - 50kHz sweep file.
Rough at the moment and will improve, but bodes well.
LD
Rough at the moment and will improve, but bodes well.
LD
Attachments
Rough at the moment and will improve, but bodes well.
LD
I might give it a shot later, looks very much like some kind of intercept behavior below 20k, interesting.
I've been working on recreating Scott's SW method, and playing about to see what's possible. Here's the first attempt at using it to look at 2nd and 3rd harmonic distortion versus f using JP's 1 - 50kHz sweep file.
Rough at the moment and will improve, but bodes well.
LD
Very interesting image.
The recorded window is ca 30 sec, from which you have taken 20msec timeslices. This means 30/0.02=1500 FFT’s to get the picture ??
That’s a rather huge exercise !!
Hans
\Very interesting image.
The recorded window is ca 30 sec, from which you have taken 20msec timeslices. This means 30/0.02=1500 FFT’s to get the picture ??
That’s a rather huge exercise !!
Hans
Not at all, for me in Python the plot appears as soon as you hit return as if the compute time was nil.
\
Not at all, for me in Python the plot appears as soon as you hit return as if the compute time was nil.
You must have quantum bits in your computer

As Scott says, computation time is fast. There's also future opportunity for overlapping timeslices/windows - each is just a f versus amplitude data point and multiple instances of the same data aren't additive.Very interesting image.
The recorded window is ca 30 sec, from which you have taken 20msec timeslices. This means 30/0.02=1500 FFT’s to get the picture ??
That’s a rather huge exercise !!
Hans
LD
Last edited:
Yes, it is interesting and that model seems to predict reality if the complex impedance measured has inductive phase that's assumed and the whole system is minimum phase - George will no doubt be in a position to report and look forward to that.I meant from the point of view of having an optimised phono stage is a lower Q resonance better? I not that the super OM and SC35 track despite very different generator designs but the the solid pin OM (dual) could be considered to have preferable high frequency behaviour.
It's interesting stuff even if it makes little difference to the end output 🙂
Looking ahead, what is then the physical meaning of the split in L, and the loss elements? Which part of the L is the generator?
LD
Yes it is interesting. Strictly, we only know the bandwidth of the system up to ~ 50k, so only harmonic information with fundamentals below ~25k might be reasonably trusted.... looks very much like some kind of intercept behavior below 20k, interesting.
In this test, for the region below 20kHz, both 2nd and 3rd harmonics apparently show direct relationship of f and log(amplitude), ie of the form amplitude = a*ekf. That is to say, at constant velocity, 2nd and 3rd harmonic distortion rise exponentially with f. And the constants are such that 3rd harmonic rises faster and there is an intercept.
I assume 2nd harmonic and 3rd distortion has different cause/mechanism.
On the face of it, tidy and well behaved.
LD
Last edited:
Yes, it is interesting and that model seems to predict reality if the complex impedance measured has inductive phase that's assumed and the whole system is minimum phase - George will no doubt be in a position to report and look forward to that.
Looking ahead, what is then the physical meaning of the split in L, and the loss elements? Which part of the L is the generator?
LD
This is the part I have no idea about at the moment, but looking forward to finding out more.
Good question, I'm also puzzled how to interpret this split.Yes, it is interesting and that model seems to predict reality if the complex impedance measured has inductive phase that's assumed and the whole system is minimum phase - George will no doubt be in a position to report and look forward to that.
Looking ahead, what is then the physical meaning of the split in L, and the loss elements? Which part of the L is the generator?
LD
That's why this transfer function, modelled by looking at the Cart from the outside, has to be compared with the FR of the Cart in action.
This will hopefully reveal the missing piece of the puzzle in the form of a second black box with a transfer function and answer the question which part of the coil is the generator.
Hans
George will no doubt be in a position to report
I hope so.
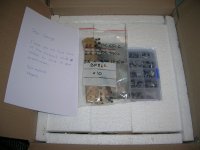
I am more than grateful to Mogens

George
Attachments
Second group-harmonic in this case is ca. (e^(freq/11800))/118 and third group-harmonic (e^(freq/7800))/780.Yes it is interesting. Strictly, we only know the bandwidth of the system up to ~ 50k, so only harmonic information with fundamentals below ~25k might be reasonably trusted.
In this test, for the region below 20kHz, both 2nd and 3rd harmonics apparently show direct relationship of f and log(amplitude), ie of the form amplitude = a*ekf. That is to say, at constant velocity, 2nd and 3rd harmonic distortion rise exponentially with f. And the constants are such that 3rd harmonic rises faster and there is an intercept.
I assume 2nd harmonic and 3rd distortion has different cause/mechanism.
On the face of it, tidy and well behaved.
LD
They cross at 44.5kHz.
Hans
- Status
- Not open for further replies.
- Home
- Source & Line
- Analogue Source
- Cartridge dynamic behaviour