But since FFT bins do collect energy, the energy for a signal with constant amplitude collected in 1/10 of the time is 10*log(1/10)=10dB/decade.
Hans there was never a disagreement, this requires a log sweep (there is no way to know if it is not). The software should be able to correct the slope to avoid the parallax of tilted axes. The overlap and add FFT also has poor rejection of LP eccentricity which varies with FFT length.
It's easy to demonstrate the artifact from LP eccentricity. When you have an off center LP the frequency of a recorded tone will have a minimum and maximum when the eccentricity is tangent to the tone arm. This FM will add to the linear FM of a slow sweep giving a staircase error when you use all the information in the FFT such as the usual overlap and add function in many audio packages.
The ideal goal would be to pair the instantaneous frequency and amplitude with some way to average out the inevitable tick and pop surface noise contamination.
The ideal goal would be to pair the instantaneous frequency and amplitude with some way to average out the inevitable tick and pop surface noise contamination.
Attachments
Hi George - don't think you're quite getting it yet. Scott's idea is to take take successive instantaneous f and amplitude of equal timeslices.The more samples available with the same nominal freq the better for f determination. All statistical tools at your hands.
It’s only the “give me a single number, any number” guys that will object to this.
All this is an intellectual exercise we (*) enjoy doing, isn't it?
George
For a sweep, that returns f response without slope no matter what sweep rate. For a spot tone it returns always the same f but a spread of amplitude values.
The issue of curiosity is what is the spread of amplitude for a spot tone?
LD
Last edited:
All this is an intellectual exercise we (*) enjoy doing, isn't it?
(*) You enjoy doing, I enjoy watching 🙂
Yes, keeping the brain active with seriously abstract problems is good therapy for a lot of things.
The issue of curiosity is what is the spread of amplitude for a spot tone?
LD
I'm using my usual approach, keep it simple at first and figure out where the non-idealities lie. In the general case with a very slow sweep the LP actually walks back and forth over frequencies and this causes some issues.
Hi Lucky.The issue of curiosity is what is the spread of amplitude for a spot tone?
I am under the impression that with Scott’s method there will be a slight spread in both amplitude and frequency within each time slice. At the limit of max sampling (thinnest time slice ) freq and ampl will approach “single” values.
But as usual, I may have got them all wrong 🙂
George
My bad - It's a red herring, and ahead of itself to consider spot frequencies using this method, so I'll just park it for now. In the limit, there's no such thing as 'instantaneous frequency', in case one wishes to make one's brain hurt. So there will be a best compromise of timeslice length that allows practically useful amplitude and f resolution. It is, as Scott puts it, the same challenge as faces spectrum analysers.Hi Lucky.
I am under the impression that with Scott’s method there will be a slight spread in both amplitude and frequency within each time slice. At the limit of max sampling (thinnest time slice ) freq and ampl will approach “single” values.
LD
Hi Lucky.
I am under the impression that with Scott’s method there will be a slight spread in both amplitude and frequency within each time slice.
George
Yes, there are two ways of smoothing uncertainty, simple filtering of noise and fitting the data to a low order polynomial. I don't think we need any rocket science here to get what we need. Frankly I would be happy with the last plot of JP's sweep.
Ah yes.
Everyone would have been happy to manage such a plot (if you mean the one in post #1126)
George
Everyone would have been happy to manage such a plot (if you mean the one in post #1126)
George
Ah yes.
Everyone would have been happy to manage such a plot (if you mean the one in post #1126)
George
No #1135 that's real data.
Last edited:
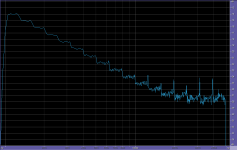
I'm glad we could finally agree on the 10dB/dec FR slope for an exponential sweep.Yes, first try on JP's fairly clean sweep file. I used small (960 point for 96k sampling) FFT's so everything slices up nice and even. The flat top window was a must, all other windows have scallop loss which showed up as noise without fiddling with an overlap strategy. Plot is dB vs frequency, I need to fancy up the titles and axes.
@JP I can PM you the code, I had to "steal" the flat top window from Matlab.
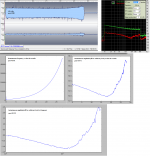
With all respect, the image you showed, level/frequency is very nice, nothing negative about that, but it needs your software to perform and cannot be used in general.
My question in all honesty is, how much more information does your image give compared to the outcome of a general available overlapping FFT program like RMA, that everybody can use, in this case using a 1024Pt FFT.
Comparing deviation of the FR to the red 10dB/dec line to your image, I think results are very close, possibly saving you the time to make images for everybodies recording.
Hans
Attachments
With all respect, the image you showed, level/frequency is very nice, nothing negative about that, but it needs your software to perform and cannot be used in general.
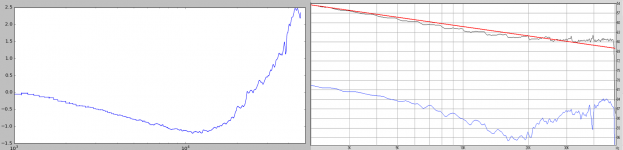
Hans, could you remove the slope and re-plot on the same scale? My entire plot fits in less than two divisions of the FFT plot and still has very little noise uncertainty. We are looking for things like subtle arm cart resonances, etc. there simply is too much noise and too many artifacts on the FFT plot.
Anyone using Linux or an RPI could run this with no intervention, Windows requires an install of a good Python package, Anaconda is essentially one click after a download and contains all the signal processing packages needed. We did this for the TT speed stability test in the TT thread, something no packages can do.
Another point if you are going to assume an exact log sweep you can simply take small time slices of the time domain response (time now correlates to frequency by assumption) and plot the log of the rms voltage in the slice vs time, no FFT's or processing needed at all. Of course REW etc. don't have a menu choice for that.
Hi Scott,
Did you post the python script you are using?
Mogens
JP is giving it a look, right now it needs cropping of sweep time domain waveform to remove leading and trailing silence. I can sent you a copy of what I have with the caveat that you need to trim the front right up to the beginning and trim everything at the end. This is not difficult. We should be able to make this automatic.
Hans, could you remove the slope and re-plot on the same scale? My entire plot fits in less than two divisions of the FFT plot and still has very little noise uncertainty. We are looking for things like subtle arm cart resonances, etc. there simply is too much noise and too many artifacts on the FFT plot.
Anyone using Linux or an RPI could run this with no intervention, Windows requires an install of a good Python package, Anaconda is essentially one click after a download and contains all the signal processing packages needed. We did this for the TT speed stability test in the TT thread, something no packages can do.
Another point if you are going to assume an exact log sweep you can simply take small time slices of the time domain response (time now correlates to frequency by assumption) and plot the log of the rms voltage in the slice vs time, no FFT's or processing needed at all. Of course REW etc. don't have a menu choice for that.
Below the image from RMAA projected on your image. It's not possible to export data from RMAA, so I had to do a Photoshop job, but the difference is obvious.
Trend is of course identical, but your image is much smoother.
Question is, to what accuracy do we need this information or can we do with less smoothness?
But again, compliments for the result.
Hans
Attachments
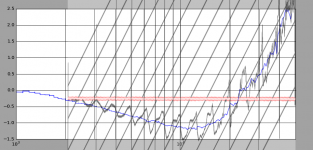
Yes - it is good and has great potential. The noise advantage and accuracy comes included, but the elephant in the room is that Scott's method directly and accurately reports real level, ie what we are actually interested in. No need to rotate or adjust pre-or post FFT, or rely on unknown accuracy of the sweep generation.Question is, to what accuracy do we need this information or can we do with less smoothness?
But again, compliments for the result.
A fine point, but also harmonic distortion is handled better, in that only fundamental suppression shows up and all other artefacts don't.
LD
A fine point, but also harmonic distortion is handled better, in that only fundamental suppression shows up and all other artefacts don't.
LD
An excellent point at high frequencies and with some stylus geometries the THD gets rather large and the difference between simple total rms voltage and the actual amplitude of the fundamental can diverge.
Not to run ahead, but there's also opportunity to report harmonic distortion versus f in an accurate way. In each timeslice, we already determine fundamental f, of course, so we know exactly where to look for harmonics from the same timeslice/FFT.
As well as discarding harmonics for the purpose of measuring fundamental, we could separately measure/report harmonics, if we choose.
That might be revealing of many physical performance params, such as stylus geometry, tracing error, alignment, etc etc.
Lots of doors open with Scott's method.
LD
As well as discarding harmonics for the purpose of measuring fundamental, we could separately measure/report harmonics, if we choose.
That might be revealing of many physical performance params, such as stylus geometry, tracing error, alignment, etc etc.
Lots of doors open with Scott's method.
LD
- Status
- Not open for further replies.
- Home
- Source & Line
- Analogue Source
- Cartridge dynamic behaviour