Hans,
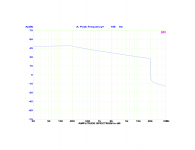
do you see the deviation 800 Hz-2000 Hz? The Ortofon is specified +/- 1,5 dB and in my hands it is reasonably good only from 2 kHz and up.
do you see the deviation 800 Hz-2000 Hz? The Ortofon is specified +/- 1,5 dB and in my hands it is reasonably good only from 2 kHz and up.
Yes, starting from 1800Hz downwards, FR starts to deviate from the 10dB/dec line.Hans,
do you see the deviation 800 Hz-2000 Hz? The Ortofon is specified +/- 1,5 dB and in my hands it is reasonably good only from 2 kHz and up.
At 850Hz deviation is in the order of -2dB.
Hans
Yes perfectly flat, Hans you are adding a layer of energy per octave processing that is unnecessary and adds confusion. I know RTA's before digital were all fractional octave based but we do not need this anymore.
Attachments
Last edited:
The file says it's 192...
The sweep ends at 22.05k and it's 16bit. Audacity's support of a wide variety of sound cards is so spotty I don't use it. Your plot is also not flat IMO octave based analysis is not useful with tone sweeps. As above the amplitude is flat vs. frequency why display it any other way?
Exactly - and now the penny has dropped, thank you. The slope of an energy based analysis depends on a variable we don't care about and is arbitrary: the sweep rate profile in the time domain. CV is constant level, and its as simple as that.As above the amplitude is flat vs. frequency why display it any other way?
LD
There's quite a bit odd about this file...……….
1. It lacks a signature cart-arm lf resonant system that is a hallmark of vinyl recordings.
2. It has a noise floor way below that of normal vinyl playback, which is remarkably consistent in spectrum across the band.
3. It is noiseless, in the sense it lacks tick and pop events.
4. The tone has virtually no harmonic distortion even at hf, which is normally present in abundance in vinyl playback.
5. There is effectively no amplitude modulation due to cart-arm instability.
Sherlock Holmes might say, forensically, this isn't of vinyl playback origin ?
LD
Thinking about it, the best way to extract f response f from a sweep might be to use Scott's idea for extracting instantaneous f and amplitude from set timeslices? That does away with relying on sweep rate.
Just looking at envelope amplitude versus time is prone to noise, particularly baseband warp/eccentricity or cart-arm resonance content, or pop-tick events.
LD
Just looking at envelope amplitude versus time is prone to noise, particularly baseband warp/eccentricity or cart-arm resonance content, or pop-tick events.
LD
Bingo, it was a mathematically generated pure exponential sweep to show one it in its purest form as on the Adjust+ and the Ortofon record.There's quite a bit odd about this file...……….
1. It lacks a signature cart-arm lf resonant system that is a hallmark of vinyl recordings.
2. It has a noise floor way below that of normal vinyl playback, which is remarkably consistent in spectrum across the band.
3. It is noiseless, in the sense it lacks tick and pop events.
4. The tone has virtually no harmonic distortion even at hf, which is normally present in abundance in vinyl playback.
5. There is effectively no amplitude modulation due to cart-arm instability.
Sherlock Holmes might say, forensically, this isn't of vinyl playback origin ?
LD
The time-domain function for a sinusoidal exponential C.V. sweep in radians is:

where f 0 is the starting frequency (at t = 0 ), f1 the final frequency and k the rate of exponential change in frequency.

I’m not going to react to mysterious “extra layers of energy” or Audicity possibly corrupting files.
There are all sorts of sweeps possible, but an exponential CV sweep has a spectrum that rolls off with 10dB/dec.
Let's accept the 10dB/dec as a fact of life or let someone prove it's incorrect, implying that all FFT software that I know is supposedly not working properly.
On a multi-second time recording I can’t see where the frequency of a sweep starts or ends .
And as far as its level deviates from an ideal straight line can only be coarsely guesstimated, the same applies to the frequency at that spot.
I therefore prefer the FFT by far, giving detailed info on both.
Hans
There are all sorts of sweeps possible, but an exponential CV sweep has a spectrum that rolls off with 10dB/dec.
Let's accept the 10dB/dec as a fact of life or let someone prove it's incorrect, implying that all FFT software that I know is supposedly not working properly.
No it doesn't and no we're not. The magnitude of that function is constant (1 in the above case). Look at your own time domain plot, you obviously have your own idea of what a "spectrum that rolls off " is. Fractional f does not fall out of ordinary trig identities or derivatives of sines and cosines.
BTW Audacity does not corrupt files it simply ignores your sound card settings in many cases, Google "Audacity and 24 bit" and see for yourself.
Last edited:
Switching the sound card to 192Khz did not bring anything new.
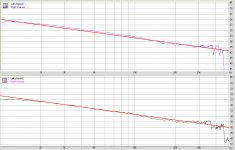
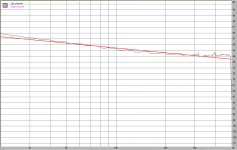
I now show the FR of both channels against the 10dB/dec ideal line.
Again, deviation is not that large, but not as smooth as the Adjust+ and the CH Precision record.
I have also added the time recordings, in case anybody is interested to see them.
You may notice a small gain difference between both channels of 1dB. That's because termination on one channel was 4k and on the other one 1k.
I played a bit with different values, but saw no differences, except in gain.
Hans
Attachments
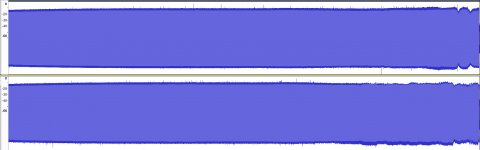
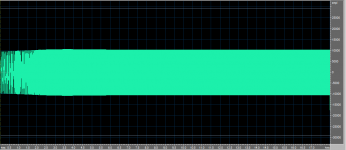
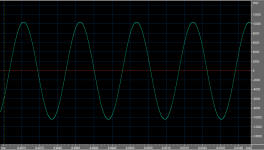
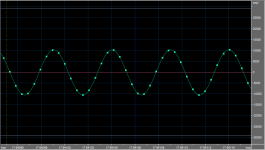
@Hans I hope we can resolve this politely so we can all move forward. Below is your raw data file at ~9sec and near the end (~18sec). The magnitude of both are ~10,300 codes at 16bits. The magnitude is the same, what are you calling the magnitude?
Attachments
Thinking about it, the best way to extract f response f from a sweep might be to use Scott's idea for extracting instantaneous f and amplitude from set timeslices? That does away with relying on sweep rate.
LD
Yes, first try on JP's fairly clean sweep file. I used small (960 point for 96k sampling) FFT's so everything slices up nice and even. The flat top window was a must, all other windows have scallop loss which showed up as noise without fiddling with an overlap strategy. Plot is dB vs frequency, I need to fancy up the titles and axes.
@JP I can PM you the code, I had to "steal" the flat top window from Matlab.
Attachments
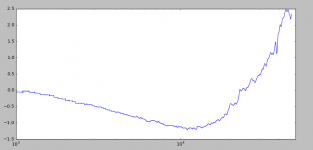
Thx - think this works and has obvious potential. Nice.Yes, first try on JP's fairly clean sweep file. I used small (960 point for 96k sampling) FFT's so everything slices up nice and even. The flat top window was a must, all other windows have scallop loss which showed up as noise without fiddling with an overlap strategy. Plot is dB vs frequency, I need to fancy up the titles and axes..
LD
Thx - think this works and has obvious potential. Nice.
There is a bit of blocking at low frequencies and adapting the FFT length would help but ironically this is the same problem as a spectrum analyzer's sweep time vs resolution BW and video BW. Better frequency resolution requires a longer sample time.
Scott,@Hans I hope we can resolve this politely so we can all move forward.
You are funny. What about politeness, what do you mean ?
That we have different opinions every now and then is no problem at all, it keeps one sharp.
We had this more than once in the past and now again with the 10dB/dec slope for an exponential CV sweep.
When asking to either accepting this 10dB/dec slope or alternatively for something proving the opposite, the answer is "no it doesn't and we are not."
That's then where it stops, doesn't it ?
Apart from the mathematical generated exponential slope, and the images showing the Ortofon sweep, all having 10dB/dec spectra, I re-show the spectrum of JP's recorded sweep as I did earlier which of course also has 10dB/dec.
No intervention of Audacity or anything else like mysterious added layers of energy, just an FFT taken directly from the .wav file.
Just a coincidence ?
With convincing arguments I never had any problem admitting that I'm wrong.
I hope you feel the same and I look forward to more respectful discussions in future.
Hans
Attachments
We had this more than once in the past and now again with the 10dB/dec slope for an exponential CV sweep.
Hans it's right there in your time domain plots again (#1133) the amplitude of the sine wave is the same (close) across the entire sweep, this is the magnitude of the waveform. The amplitude at 1kHz is not 3x the amplitude (of the time domain waveform) at 10kHz, is that not obvious????
Last edited:
- Status
- Not open for further replies.
- Home
- Source & Line
- Analogue Source
- Cartridge dynamic behaviour