Last edited:
Kees, as I started to go practically through your points, just to be sure - what do you mean by "line response over the surface of the diaphragm"? Are these simply SPLs measured in front of the diaphragm, at densely placed points along an arc? Do you really mean a thousand of them per 1 deg?Another tip which I have used before;
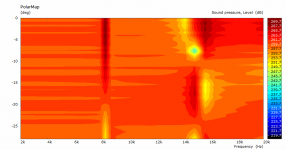
-let ABEC generate a line reponse over the surface of the diaphragm with a very high angular resolution (0.001degree).
-Then run the sim with the channels not attached tot the compression chamber.
-now, if you open this reponse in a VACS contour plot, you can scroll through the angles and determine the optimum place for the channel entries, this is the location where the frequency response has no dips/peaks.
-then thank me later 😉
Last edited:
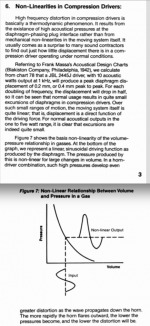
The reason that compression and rarefaction are different is because the PV curve of a gas is not linear but curved. However, for the most part, over the range of pressures that we see, linearity is pretty close. That means that the forces on the diaphragm are very very nearly the same on the forward and backward motions. I'm with Mabat, I don't see this as significant. Convex and concave should work the same as regards diaphragm motion.
Earl,The reason that compression and rarefaction are different is because the PV curve of a gas is not linear but curved. However, for the most part, over the range of pressures that we see, linearity is pretty close. That means that the forces on the diaphragm are very very nearly the same on the forward and backward motions. I'm with Mabat, I don't see this as significant. Convex and concave should work the same as regards diaphragm motion.
The Pressure/Volume non-linear curve results in a non-linear input/output waveform, measurable as harmonic distortion at high pressure (compression).
At the very low distortion measured from a high frequency compression driver/waveguide at typical domestic listening levels we can assume the forces on the diaphragm are nearly the same on the forward and backward motions.
When driven to their rated power, HD distortion levels for the same HF drivers may exceed 100% over large portions of their useable passband.
By corollary, wouldn’t that indicate the forces on the diaphragm at high pressure are different for forward and backward motions?
Art
Attachments
Last edited:
While reading some literature on electro-mechano-acoustical (lumped-elements) models of compression drivers, I wonder whether Jörg Panzer has already incorporated his latest - and apparently ongoing - research in this field in ABEC/Akabak.
Last edited:
At the very low distortion measured from a high frequency compression driver/waveguide at typical domestic listening levels we can assume the forces on the diaphragm are nearly the same on the forward and backward motions.
When driven to their rated power, HD distortion levels for the same HF drivers may exceed 100% over large portions of their useable passband.
By corollary, wouldn’t that indicate the forces on the diaphragm at high pressure are different for forward and backward motions?
Art
From what I understand - admittedly, I'm not the Technician/Engineer/Physicist here - some seemingly small details do matter (also) and are likely different for a forward radiating diaphragm.
J. Panzer, 2019:
"The output of the voice-coil slit is at the side of the compression chamber. Noting that the wavelength is larger than the radius of the membrane we assume the same sound pressure as inside the chamber. This is, of course, an approximation and may need further investigation."
and:
"The curves of the acoustic observation are close. Why there are still deviations between curves of simulation and measurement is unclear at this stage. The figures (edited) display a measured sound pressure curve of high level at the upper frequency band between 10 kHz and 20 kHz. This would be impossible to achieve with only the rigid body motion of the membrane. We suspect bending vibration at high frequency."
Last edited:
I found some time to try this out but the new version of ABEC is now released 'AKABAK3' with the old version not immediately available so I tried importing the 'tiny' example project into AKABAK3 but get the error:
"Importing whole ABEC project
ERRORS ------------------------
Script problem in section "Infinite_Baffle #4" at identifier "Position": 'offset' is not a valid integer value
"
the simulation however still seems to run but I can't find any results and in the log I get:
ERRORS ------------------------
Range check error
Solving aborted
so I guess somethings up but its the first time I have run this software so I could have done something stupid.
It seems like you're trying to run a sim with invalid parameters, eg the specified value is only valid in the far field.
Earl,
The Pressure/Volume non-linear curve results in a non-linear input/output waveform, measurable as harmonic distortion at high pressure (compression).
At the very low distortion measured from a high frequency compression driver/waveguide at typical domestic listening levels we can assume the forces on the diaphragm are nearly the same on the forward and backward motions.
When driven to their rated power, HD distortion levels for the same HF drivers may exceed 100% over large portions of their useable passband.
By corollary, wouldn’t that indicate the forces on the diaphragm at high pressure are different for forward and backward motions?
Art
Hi Art
Hope you are well.
I think that there are a couple of things wrong with your argument.
First, the 100% distortion does not come all from the PV curve nonlinearity. In fact, from what I know about nonlinear acoustics, it would be a small fraction of this, mostly very low order. The actual ratio would depend on a whole lot of variables, but my understanding is that the nonlinearities would be mostly BLi(x) nonlinearities at those levels.
Second, at 100% distortion, I would think that this would be beyond the intended operating range as the system would be unlistenable. That this level can be below the "power rating" is a sad statement on marketing ratings. Once any driver goes beyond its designed region of operation all bets are off as anything can happen.
Hence at the extremes of level that you are quoting there may be differences in pressure, but at normal "usable" operating range the differences would be a small %.
Last edited:
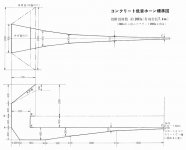
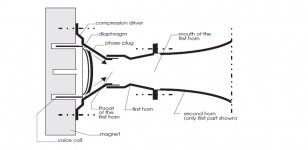
Speaking of nonlinear distortion in horn loudspeakers, many years ago Dutch scientists released a paper on this subject. They used a forward radiating midrange compression driver with a fiberglass diaphragm. It looks like the typical University Sound-type screw-on driver often found voice-only PA systems.
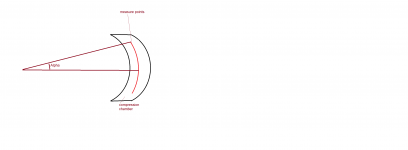
The phase plug appears to be a spherical cap.
The phase plug appears to be a spherical cap.
Attachments
Last edited:
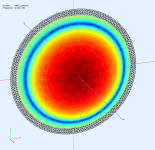
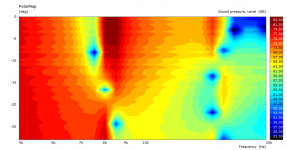
Oh boy this will be tricky. For now this is just a chamber without channels connected. There are basically no radial points without issues. 😱
Treatment of the surround will be critical I guess. More on that later.
Also, I suspect now that the "deep-drawn" diaphragm cavity would behave even worse in this respect.
(44 mm voice coil diameter; 0.5 mm diaphragm-phase plug distance.)
Treatment of the surround will be critical I guess. More on that later.
Also, I suspect now that the "deep-drawn" diaphragm cavity would behave even worse in this respect.
(44 mm voice coil diameter; 0.5 mm diaphragm-phase plug distance.)
Attachments
Good!
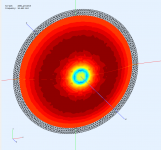
now scroll through the results and find the first 4 nodes (for a 4chnnl phaseplug), this is where youplace the channel entrances
now scroll through the results and find the first 4 nodes (for a 4chnnl phaseplug), this is where youplace the channel entrances
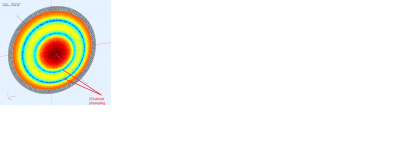
more clearly,
this way you can see how many channels are needed to get clean reponse to a certain frequency (apart from diaphragm breakup of course, you would need COMSOL to also model those)
this way you can see how many channels are needed to get clean reponse to a certain frequency (apart from diaphragm breakup of course, you would need COMSOL to also model those)
Attachments
Last edited:
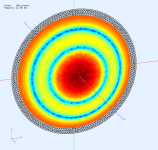
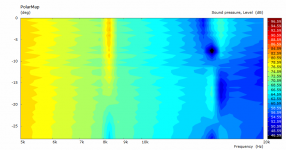
BTW, the following would be for a uniform axial drive along the whole chamber. That's much better but this won't be the case in practice as the surround contributes less and that makes quite a difference in the end. I wonder is this can be dealt with more effectively when using the diaphragm from the voice coil side 
(On the second plot I changed frequency axis to linear and the driving to constant excursion (was of constant acceleration before).)
(On the second plot I changed frequency axis to linear and the driving to constant excursion (was of constant acceleration before).)
Attachments
Last edited:
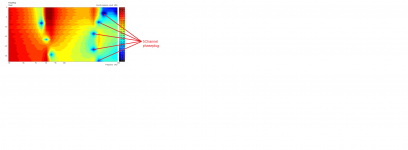
Sorry, I have been giving wrng info in the last 2 posts! (it has been a c ouple of years since I've done this myself)
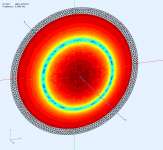
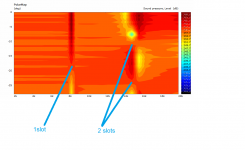
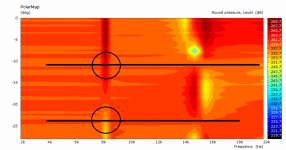
please see pic attached, the entrances should be at excatly in between the nulls and the nodes of the resonanes
probably the lines I marked aren't the whole picture,k please try and scale the color range for better insight (you should see what I mean if you place a horinzontal marker and look at the frequency plot of that, the angular location without strong peaks or dips are the proper ones
Attachments
Last edited:
Yea, I understand what you mean by the peaks and dips. I only still don't get why it should work this way. But I'll try to figure that out!
(The frequency resolution is also somewhat coarse as this is just a quick sim to make some insight).
(The frequency resolution is also somewhat coarse as this is just a quick sim to make some insight).
Attachments

Last edited:
So, if I'm getting this right, the two slots positioned as illustrated would in effect cancel the mode around 8 kHz? Is this a generally applicable principle here?
I just can't see how this could improve the wavefront at the throat of the waveguide as the slots terminate at different places.
I just can't see how this could improve the wavefront at the throat of the waveguide as the slots terminate at different places.
Attachments
Last edited:
- Home
- Loudspeakers
- Multi-Way
- Acoustic Horn Design – The Easy Way (Ath4)