We did do a psychoacoustical test of simulated diffraction which showed that higher levels and longer delays were more audible, so that's a data point.Do you have any support for this for this statement?
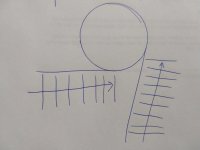
Two plane waves are traveling along a straight wall. All of a sudden the wall becomes circular and the wave starts diffracting. As both waves and boundaries are just rotates versions of the other, the amount of diffraction is the same.
The second derivative, however, is quite different at both point where the wave starts diffracting. The curvature is constant though.
So, shouldn't we minimize the (maximum) curvature?
I don't follow your example, but the 2nd Dir is constant on a circle so yes both diffract the same amount.
I have been playing around with improving the wave guides I have successfully used with a mid range AMT driver. I have been using a simple OS horn with a simple mouth radius. Using the OSSE profiles as guide curves for my own approach. See -https://www.diyaudio.com/community/threads/new-horn-wave-guide-for-midrange-amts.398912/#post-7349104

The question is what’s the best approach for modelling a rectangular AMT diaphragm in AKAbak?
I know some believe that adding a waveguide to AMT, doe not have any benefit. I have done a significant amount listening with and without guides, and to mine and others that have heard them, the waveguide improves the dynamics and benefits room interaction.
That's right, in cartesian coordinates we should always take the curvature.
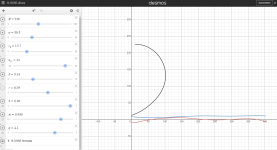
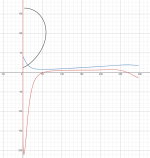
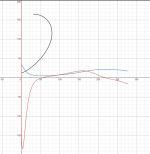
These are 1st (red) and 2nd (green) derivatives of a circular arc. They will give a constant curvature but neither of those is constant by itself.

https://www.derivative-calculator.net/
These are 1st (red) and 2nd (green) derivatives of a circular arc. They will give a constant curvature but neither of those is constant by itself.
https://www.derivative-calculator.net/
Yes, indeed.
But the OS minimizes the second derivative, not the curvature. So, is it minimizing the wrong thing?
But the OS minimizes the second derivative, not the curvature. So, is it minimizing the wrong thing?
I'm still not sure it does, haven't seen a proof. (I'm not saying it doesn't, I just don't know what to make of it.)
BTW, this is for a pure OS:


BTW, this is for a pure OS:
Last edited:
This is the generalized OS for k=1 and k=2:


Hard to say, maybe k=1 gives a lower integral value in some metric.
(The lower the 'k' the more is the curvature concentrated towards the throat, but it's higher at its maximum.)

Hard to say, maybe k=1 gives a lower integral value in some metric.
(The lower the 'k' the more is the curvature concentrated towards the throat, but it's higher at its maximum.)
Last edited:
For a very high k it's a "spread-curvature" shape, basically a circular arc - with a low curvature, but all along the profile.
(A high-loading, very smooth, but extremely beamy shape.)


...the limit for k→∞ being a tube.
(A high-loading, very smooth, but extremely beamy shape.)
...the limit for k→∞ being a tube.
Last edited:
Last edited:
No response from Faital?Since its interesting I sent query to their customer service. Lets see if there is an answer 🙂
nope. I suspect my message was not professional / credible enough worth their precious time 🙂
Last edited:
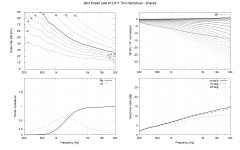
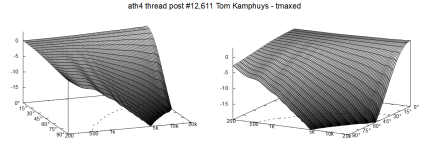
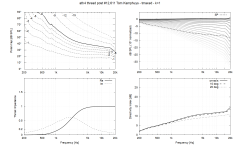
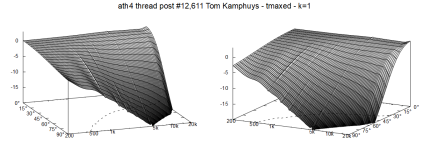
btw. here is another profile from yesterday, quite similar performance with very different parameters.
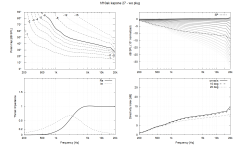
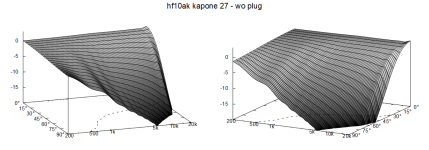
Curvature is also different, so real world compatibility to a particular compression driver would differ. I have no idea which one would work better on which driver, although the BEM result is about the same.
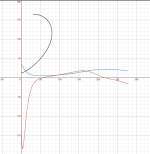
Tom's version makes better back side with tmax, less interference around the onion 🙂 I would guess its the smoother curvature when t gets closer to 1 and beyond, mine droops.


Curvature is also different, so real world compatibility to a particular compression driver would differ. I have no idea which one would work better on which driver, although the BEM result is about the same.

Tom's version makes better back side with tmax, less interference around the onion 🙂 I would guess its the smoother curvature when t gets closer to 1 and beyond, mine droops.
Last edited:
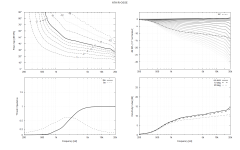
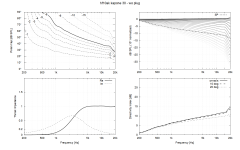
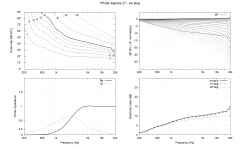
Yeah, smoothing the curvature further seems to reduce diffraction, DI is smoother without extra "boost", increased DI around 2kHz in the above sim labeled #27.
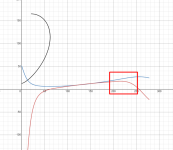
Whether this is a good or bad thing I don't know, little diffraction there helps increase DI to lower frequency with same diameter device which makes for more constant directivity. This is same profile as above other than few parameters tuned to smoothen the blue and red curvature lines in Desmos. DI ruler straight, but not constant of course. edit. added #27 graphs for easy comparison.

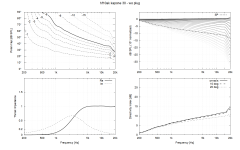
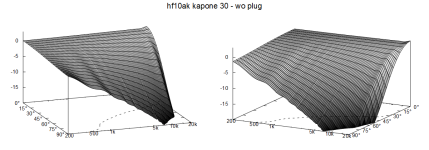
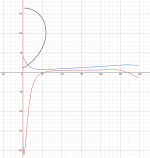
Whether this is a good or bad thing I don't know, little diffraction there helps increase DI to lower frequency with same diameter device which makes for more constant directivity. This is same profile as above other than few parameters tuned to smoothen the blue and red curvature lines in Desmos. DI ruler straight, but not constant of course. edit. added #27 graphs for easy comparison.


Last edited:
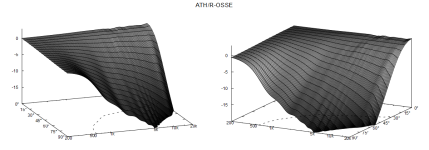
There's always quite strong diffraction at the very end of the R-OSSE contour that helps to increase the DI at lower frequencies, i.e. at those frequencies which make it to the end of the profile, i.e. only those with large-enough wavelengths. Higher frequencies "leave the contour" soon enough to not to meet the edge very strongly. That's why I still don't see much merit in adding a rear side, except very wide-directivity designs where more higher frequencies ever "see the edge".
Just curious - what software are you guys using to generate the images above?I have found something I quite like for the T34A, it is harder to get right than the B version. The simulation conditions seem to matter much more than I found previously.
View attachment 1176180View attachment 1176181
As I try to learn, I've been generating FRD files via ATH, and then importing them into VCAD to view performance. I was just curious if the above app is a faster process.
Last edited:
- Home
- Loudspeakers
- Multi-Way
- Acoustic Horn Design – The Easy Way (Ath4)
